This paper builds standard cell libraries for an advanced 7nm FinFET technology, supporting multiple threshold voltages and supply voltages. Circuit synthesis ...
This article has been accepted for publication in a future issue of this journal, but has not been fully edited. Content may change prior to final publication. Citation information: DOI 10.1109/TCSII.2015.2391632, IEEE Transactions on Circuits and Systems II: Express Briefs
13020
1
Performance Comparisons between 7nm FinFET and Conventional Bulk CMOS Standard Cell Libraries Qing Xie, Student, IEEE, Xue Lin, Student, IEEE, Yanzhi Wang, Student, IEEE, Shuang Chen, Student, IEEE, Mohammad Javad Dousti, Student, IEEE, and Massoud Pedram, Fellow, IEEE
Abstract— FinFET devices have been proposed as a promising substitute for the conventional bulk CMOS-based devices at the nanoscale, due to their extraordinary properties such as improved channel controllability, high ON/OFF current ratio, reduced short-channel effects, and relative immunity to gate line-edge roughness. This paper builds standard cell libraries for an advanced 7nm FinFET technology, supporting multiple threshold voltages and supply voltages. Circuit synthesis results of various combinational and sequential circuits based on presented 7nm FinFET standard cell libraries forecast 10X and 1000X energy reductions on average in the super-threshold regime, and 16X and 3000X energy reductions on average in the near-threshold regime, compared to those results of 14nm and 45nm bulk CMOS technology nodes, respectively. Index Terms— FinFET; 7nm technology; standard cell library; near-threshold computing; energy-efficient computing
I. INTRODUCTION nergy consumption has always been a critical performance metric for integrated-circuits (ICs). The voltage down-scaling has been quite effective in reducing the energy consumption of ICs. For some relaxed-performance applications, such as portable wireless devices, medical devices, and sensor network nodes, reducing the supply voltage to a very low value, slightly higher than the threshold voltage value of transistors, results in the minimum energy consumption [1][2][3]. The supply voltage that results in this minimum energy consumption, referred to as the minimal energy point (MEP), has been derived analytically as well as experimentally observed in the near-threshold voltage regime [4][5]. The steady down-scaling of feature sizes of the CMOS technology has been the driving force for the continual improvement in circuit speed and cost per functionality over the past several decades. However, due to the fundamental material and process technology limits, great challenges (i.e., how to mitigate the short-channel effects, minimize the leakage current, reduce the device-to-device variability) are encountered during the scaling down of conventional planar CMOS transistor beyond the 22nm [6][7]. Therefore, FinFET device, a type of quasi-planar double gate (DG) device with a process flow and layout similar to that of a conventional planar CMOS [8], has been proposed as a substitute for the planar CMOS device for technology nodes below 32nm [9]. It has been reported that FinFET devices offer superior scalability [10], lower gate leakage current [11], excellent
E
This work is supported by is supported by grants from the PERFECT program of the Defense Advanced Research Projects Agency and the Software and Hardware Foundations of the National Science Foundation. All authors are with the Department of Electrical Engineering, University of Southern California, Los Angeles, CA, United States (e-mail: {xqing, xuelin, yanzhiwa, shuangc, dousti, pedram}@usc.edu).
control of short-channel effects [12], and relative immunization to the gate line-edge roughness [13]. Because of the perceived benefits of FinFET devices, the VLSI industry has been working to push FinFET processes into volume production [14]. However, these advanced FinFET technology nodes are yet accessible to us. Considerable research efforts have been invested to forecast power and performance of advanced FinFET technologies to academia. For example, Sinha et al. presented a predictive technology model for multi-gate transistors (PTM-MG) for FinFETs in sub-20nm technology nodes [15]. This model is based on BSIM-CMG model [16]. An alternative approach, based on the fundamental physics principles i.e., atomistic sp3d5s* tight binding accounting for quantum physical effects such as confinement, band structure changes, tunneling, etc., is adopted by Gupta et al. and resulted in the design of 5nm gate-length FinFET device model (7nm spacing between edges of the diffusion regions) [17]. Chen et al. extract 7nm FinFET device model (10nm spacing between edges of the diffusion regions) from Synopsys TCAD simulation by using semi-classical transport models with some quantum corrections [18]. The authors in these two works presented characterization data of a single FinFET device and predicted the performance of simple FinFET logic cells and circuits. This device model is specified by using look-up-tables (LUTs) and is compatible with SPICE through a Verilog-A interface. Author in [17][18] have presented sub-10nm FinFET device models, however, there lacks standard cell libraries that enable a circuit-level analysis of these advanced FinFET technology nodes. This work brings analysis of sub-10nm FinFET technologies from the device-level to the circuit-level by presenting 7nm FinFET standard cell libraries. Note that although the preliminary version of this work [19] is based on the 5nm FinFET device model [17], we adopt a less aggressive 7nm FinFET technology, of which the device model extraction and validation are presented in [18]. This is because that, according to the industry feedback and ITRS roadmap [20], FinFET devices with 7nm gate channel length is expected to come to the market by the year of 2018, while the 5nm FinFET technology, which is considered as the scaling limit of the MOSFETs, still requires longer development time. The presented libraries can be used to perform logic synthesis, time and power analysis with the advanced FinFET device technology nodes. Multiple supply voltages ranging from the near-threshold to the super-threshold regime are supported in our 7nm FinFET technology nodes, allowing both high performance and low power usage. In addition, devices with multiple threshold voltages are supported to enable multi-threshold technology. As the baseline setups, 14nm bulk CMOS device standard cell libraries are also generated by using the same process. 7nm FinFET standard cell libraries contain all typical types of combinational cells and sequential cells. Each cell is carefully sized to achieve equal rise and fall times at the characterization supply voltage level. The standard cell libraries are built in the Synopsys Liberty
1549-7747 (c) 2015 IEEE. Personal use is permitted, but republication/redistribution requires IEEE permission. See http://www.ieee.org/publications_standards/publications/rights/index.html for more information.
This article has been accepted for publication in a future issue of this journal, but has not been fully edited. Content may change prior to final publication. Citation information: DOI 10.1109/TCSII.2015.2391632, IEEE Transactions on Circuits and Systems II: Express Briefs
13020
2
Front Gate
tfin
library (FinFET5nm) { process, voltage, units, templates, thresholds, etc. cell (inv_1x) {}; ... }
LG Drain
Back Gate
hfin
Gate
Gate Oxide (tox)
Source Insulator Bulk Si LG=7nm
(a) LSP
Back Gate
Source
tfin=3.5nm
cell (inv_1x) { area; cell_leakage_power; pin (IN) {}; ... }
pin (IN) { direction, function, input_cap; timing(), interal_power(); }
Data (delay, output slew, power, etc.)
Input Slew
Output Capacitance
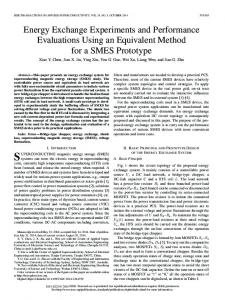
Figure 2. Hierarchy of Liberty format library. Drain
Front Gate
Logic Synthesis Tool (b)
netlist.v
.sdf
.saif
benchmark.v testbench.v
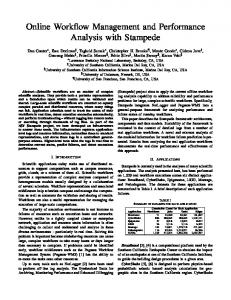
Figure 1. (a) Perspective view and (b) top view of the 7nm FinFET device.
format [21], which is widely used for logic synthesis and static timing analysis. With the presented libraries, various benchmark circuits are synthesized; and their dynamic and static power consumption results are reported. Comparisons between 7nm FinFET standard cell libraries and conventional CMOS libraries, e.g., 14nm and 45nm, are carried out for same benchmark circuits. Synthesis results demonstrate that 7nm FinFET technology can achieve 10X and 1000X energy reductions on average in the super-threshold regime, and 16X and 3000X energy reductions on average in the near-threshold regime, compared to those results of 14nm and 45nm bulk CMOS technology nodes. Note that this work forecasts the power consumptions of 7nm FinFET technology, while an analysis of process-induced variations at this technology node can be found in [22].The presented 7nm FinFET cell libraries are available at http://sportlab.usc.edu/downloads.
II. 7NM FINFET TECHNOLOGY Figure 1 shows the structure of a FinFET device. The FinFET device consists of a thin silicon body, with thickness of 𝑇𝑇𝑓𝑓𝑓𝑓𝑓𝑓 , that is wrapped by gate electrodes. The device is termed quasi-planar as the current flows parallel to the wafer plane, and the channel is formed perpendicular to the plane. The effective gate length 𝐿𝐿𝐺𝐺 is twice as large as the fin height ℎ𝑓𝑓𝑓𝑓𝑓𝑓 . Note that we define a FinFET technology by their effective gate lengths. Therefore, 𝐿𝐿𝐺𝐺 is set to be 7nm in 7nm FinFET device models. In this work, we focus on the shorted-gate FinFET devices because they provide better driving strength. The 7nm FinFET device models are adopted from [18].
III. STANDARD CELL LIBRARY CHARACTERIZATION A standard cell library is a set of high quality timing and power models that accurately and efficiently capture behaviors of standard cells in the computer-aided-design (CAD) domain. The standard cell library is widely used in many design tools for different purposes, such as logic synthesis, static timing analysis, power analysis, high-level design language simulation, and so on. In this section, we briefly describe the process of generating a 7nm FinFET standard cell library. A. Creating Standard Cells As shown in Figure 1 (a), the drive strength of a FinFET device depends on the ratio of fin height and channel length, whereas both parameters are determined by the fabrication technology. We investigate the numbers of P-type fins and N-type fins in all standard cells to achieve approximately equal rise and fall times. Appropriate sizing is obtained through HSPICE simulations. For each standard cell, multiple versions (1X, 2X, 4X, etc.) are created with different driving strengths. B. Building the Standard Cell Library We adopt the Liberty library format (.lib) [21] and the non-linear delay model (NLDM) in our library. We characterize and record delays and output slews at various input slew rates and output loads. The ranges of slew rates and output loads are determined in such a way
Gate-level Simulator .saif
Power Analysis Tool
Standard Cell Library Power Report
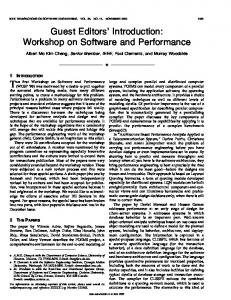
Figure 3. Power estimation method used in this work.
that the typical output slew and fanout capacitance are covered in these ranges with a big amount of margin at its lower and upper limit. The Liberty library is built in a hierarchical manner, as shown in Figure 2. The information of process, supply voltage, data units, look-up-table (LUT) template, triggering thresholds, and so on, is specified at the library-level. At the cell-level, the cell area, leakage power, and all input/output pins are specified. At the pin-level, the signal direction, symbolic function, and input capacitance are specified for each pin. In addition, timing parameters (propagation delay, output slew, and timing constraint parameters) and power parameters (internal power) are also stored in 2D LUTs at the pin-level. We obtain those parameters of each logic cell through HSPICE simulations at various input and output conditions. 1) Characterizing timing parameters: The timing parameters of a logic cell refer to propagation delays and slew rates of the output pin when the output makes a transition. For sequential cells such as D flip-flops and latches, the timing parameters also include timing constraint parameters such as the setup time and hold time of the data signal, and the recovery time and removal time of asynchronous control signals. We apply the single input switching (SIS) assumption such that only one input signal switches at a time. Therefore, propagation delays and slew rates are measured for the output pin related to each input pin, while signals of other input pins stay unchanged. We measure 50%-50% propagation delay and 20%-80% slew rate. For flip-flops, setup time and hold time are measured by using the bisection method [23]. 2) Characterizing power parameters: The power parameters of a logic cell include the leakage power and internal power. The overall power consumption is calculated by summing up the leakage power, the internal power, and the switching power (power consumed when charging and discharging the load capacitance.) We measure the leakage power consumption when there is no signal transition at the input and output. The internal power is measured by subtracting the switching energy at the load capacitance from the total energy consumption when output signal transits. IV. POWER CONSUMPTION ESTIMATION To accurately estimate the power consumption of VLSI circuits synthesized using the presented 7nm FinFET standard cell libraries, both of the leakage and dynamic power (consisting of internal power and switching power) consumption must be estimated correctly. The total leakage power consumption is relatively easy to derive – summing up leakage power consumption of all cells that are not being power gated. However, estimating the total dynamic power is not straightforward because it depends on switching activities of all nets in
1549-7747 (c) 2015 IEEE. Personal use is permitted, but republication/redistribution requires IEEE permission. See http://www.ieee.org/publications_standards/publications/rights/index.html for more information.
This article has been accepted for publication in a future issue of this journal, but has not been fully edited. Content may change prior to final publication. Citation information: DOI 10.1109/TCSII.2015.2391632, IEEE Transactions on Circuits and Systems II: Express Briefs
13020
3
circuits. Therefore, in this work, we jointly utilize the logic synthesis tool, gate-level simulator, and power analysis tool to produce accurate estimations of dynamic power. We adopt the power estimation method described in [24]. In this power estimation method, we first synthesize a benchmark circuit by using the presented 7nm standard cell libraries and obtain the synthesized netlist in Verilog format (named testbench.v) and a standard delay format (.sdf) file for gate-level simulator, e.g. ModelSim, NC Verilog. Note that, for the technology mapping step, we set the target delay of each benchmark circuit to be 30% more than the minimum delay at the given power supply and threshold voltage levels. A forward-switching activity interchange format (.saif) file, which contains state- and path-dependent information of all standard cells, is generated for each standard cell library. Meanwhile, based on an input benchmark.v file, which specifies the average switching activities at primary inputs of a synthesized circuit, another forward-saif file is generated for the circuit in order to set the primary input activities and produce information of nets in netlist that should be monitored for switching activity to the gate-level simulator. These forward-saif files, together with the netlist, sdf files, and a testbench, are used as inputs to the gate-level simulator. The gate-level simulator determines the information about switching activities at all nets in the netlist and log it in a backward-saif file. The power analysis tool, e.g., Power Compiler, uses this backward-saif file and the power af=0.10
Near-threshold
Sub-threshold
Energy (fJ)
af=0.15
af=0.20
af=0.25
MEP 0.02
0.2
0.25
0.3
0.35
0.4
0.45
af=0.10
af=0.20
Near-threshold
Sub-threshold
Energy (fJ)
af=0.15
0.04
af=0.25
Superthreshold
0.25
0.3
0.35
0.4
0.45
1.E+03
1.E+01
1.10 V
0.55 V
1.E+00 1.E-01
0.45 V 0.30 V
1.E-02 5
50Delay (ps)
0.35
0.45
0.4
0.5
af=0.05
af=0.10
af=0.15
af=0.20 af=0.25 MEDP
1.E+00
0.2
0.25
Super-threshold
Near-threshold
Sub-threshold 0.3
0.35
0.4
0.45
0.5
Supply Voltage (V) Figure 7. Energy-delay product of a 20-stage inverter chain versus supply voltage at different activities factors (af) for FinFET 7nm high 𝑉𝑉𝑡𝑡ℎ device. 1.E+04
FinFET 7nm high Vth FinFET 7nm normal Vth CMOS 14nm CMOS 45nm 0.80 V
1.E+03 1.E+02
1.10 V 0.55 V
1.E+01 1.E+00
500
0.45 V 10
0.30 V 100 Delay (ps)
1,000
Figure 9. Energy and delay values of a 16-bit multiplier for different libraries. 1.E+03
Leakage Power
Dynamic Power
Leakage Power
1.E+02
1.E+01 1.E+00 1.E-01 1.E-02 1.E-03
0.3
1.E+01
Power (uW)
Power (uW)
Dynamic Power
0.25
1.E-01
Figure 8. Energy and delay values of a 16-bit adder for different libraries. 1.E+02
0.2
1.E-01 0.15
Energy (fJ)
FinFET 7nm high Vth FinFET 7nm normal Vth CMOS 14nm 0.80 V CMOS 45nm
1.E+02
Super-threshold
2
0.5
Supply Voltage (V) Figure 6. Energy consumption of a 20-stage inverter chain versus supply voltage at different activities factors (af) for FinFET 7nm high 𝑉𝑉𝑡𝑡ℎ device.
af=0.25
4
1.E+02
0.02
0.2
Near-threshold
af=0.20
Supply Voltage (V) Figure 5. Energy-delay product of a 20-stage inverter chain versus supply voltage at different activities factors (af) for FinFET 7nm normal 𝑉𝑉𝑡𝑡ℎ device.
MEP
0.00 0.15
af=0.15
MEDP
0 0.15
EDP (fJ·ps)
af=0.05
0.06
af=0.10
Subthreshold
6
0.5
Supply Voltage (V) Figure 4. Energy consumption of a 20-stage inverter chain versus supply voltage at different activities factors (af) for FinFET 7nm normal 𝑉𝑉𝑡𝑡ℎ device.
af=0.05
8
Superthreshold
0.04
0.00 0.15
Energy (fJ)
V. SYNTHESIS RESULTS ON BENCHMARK CIRCUITS We synthesize various combinational and sequential benchmark circuits, as well as the LEON2 SPARC processor [25] (without any caches) by using the developed 7nm FinFET standard cell libraries. To show the improvement in terms of circuit speed and energy efficiency brought by the 7nm FinFET technology, we specify relaxed timing constraints in Design Compiler when synthesizing the benchmark
EDP (fJ·ps)
af=0.05
0.06
parameters in standard cell libraries to report accurate power consumption results. The overall power estimation flow is depicted in Figure 3. This same flow is also used to generate results for the 14nm and 45 nm CMOS designs. Note that all wire capacitances were ignored in all cases. An important factor when analyzing results presented below is that the circuit netlists used for the 7nm FinFET, 14nm CMOS, and 45nm CMOS technologies and different 𝑉𝑉𝑡𝑡ℎ values are not the same (they are, however, the same for different 𝑉𝑉𝑑𝑑𝑑𝑑 values once the technology and 𝑉𝑉𝑡𝑡ℎ value are specified). So some variations in these results across different technology nodes and threshold voltage combinations are due to the netlist differences. However, such netlist-induced differences do not eclipse delay, power, and energy reductions associated with physical and supply voltage scaling. Another contributor to the aforesaid variations in results is the voltage dependency of capacitances.
FF 7nm FF 7nm FF 7nm FF 7nm CMOS high Vth high Vth norm Vth norm Vth 14nm 0.45 V 0.30 V 0.45 V 0.55 V 0.30 V
CMOS 14nm 0.80 V
CMOS 45nm 1.10 V
Figure 10. Dynamic and leakage power consumptions of the c432 benchmark for different standard cell libraries.
1.E+01 1.E+00 1.E-01 1.E-02
FF 7nm high Vth 0.30 V
FF 7nm FF 7nm FF 7nm CMOS high Vth norm Vth norm Vth 14nm 0.45 V 0.30 V 0.45 V 0.55 V
CMOS CMOS 14nm 45nm 0.80 V 1.10 V
Figure 11. Dynamic and leakage power consumptions of the c3540 benchmark for different standard cell libraries.
1549-7747 (c) 2015 IEEE. Personal use is permitted, but republication/redistribution requires IEEE permission. See http://www.ieee.org/publications_standards/publications/rights/index.html for more information.
This article has been accepted for publication in a future issue of this journal, but has not been fully edited. Content may change prior to final publication. Citation information: DOI 10.1109/TCSII.2015.2391632, IEEE Transactions on Circuits and Systems II: Express Briefs
13020
Benchmark circuits 𝑉𝑉𝑑𝑑𝑑𝑑 c432 c880 c1355 c1908 c2670 c3540 16-bit adder 16-bit multiplier s820 s1196 s1423 LEON2 SPARC Benchmark circuits 𝑉𝑉𝑑𝑑𝑑𝑑 c432 c880 c1355 c1908 c2670 c3540 16-bit adder 16-bit multiplier s820 s1196 s1423 LEON2 SPARC
4 Table 1. Circuit delay/clock period and energy consumptions per operation. Circuit delay or clock period (ps) Energy consumption per operation(fJ) FinFET 7nm FinFET 7nm NCSU CMOS 14nm CMOS 14nm 45nm High 𝑉𝑉𝑡𝑡ℎ Normal 𝑉𝑉𝑡𝑡ℎ High 𝑉𝑉𝑡𝑡ℎ Normal 𝑉𝑉𝑡𝑡ℎ 0.30V 0.45V 0.30V 0.45V 0.55V 0.80V 1.10V 0.30V 0.45V 0.30V 0.45V 0.55V 0.80V 1,292 164.3 172.8 80.5 795 220.0 1,460 0.083 0.264 0.237 0.697 1.725 5.13 1,025 126.7 154.9 74.9 810.1 183.7 1,060 0.154 0.505 0.228 0.632 1.401 2.57 1,031 123.4 161.4 79.4 702.5 156.0 1,020 0.286 0.992 0.462 1.383 2.266 4.77 1,320 160.3 190.8 93.1 1,118 227.7 1,260 0.224 0.736 0.334 0.932 4.680 9.74 1,196 151.4 142.7 67.1 944.9 210.3 1,300 0.282 0.935 0.434 1.246 2.358 4.25 1,658 204.8 238.5 117.7 1,281 291.1 1,790 0.506 1.583 0.792 2.070 5.101 9.08 637.4 70.2 163.3 68.5 450.7 97.6 1,010 0.111 0.384 0.251 0.650 0.762 1.44 1,606 201.3 214.3 107.3 1,039 235.1 1,440 0.964 3.276 1.363 4.018 6.244 13.23 330.6 45.28 41.8 21.1 262.8 49.68 360.0 0.075 0.267 0.110 0.345 0.972 2.51 942.0 116.6 134.5 57.8 684.6 158.1 1,010 0.150 0.464 0.409 1.224 1.362 2.25 2,323 280.7 313.2 154.1 1,840 405.7 2,040 0.228 0.405 0.363 0.826 2.392 3.72 2,600 520.0 650.0 325.0 3,250 500.0 650.0 8.66 20.70 28.70 52.30 364.40 516.9 Table 2. Dynamic and leakage power consumptions. Dynamic power consumption (uW) Leakage power consumption (uW) FinFET 7nm FinFET 7nm NCSU CMOS 14nm CMOS 14nm 45nm High 𝑉𝑉𝑡𝑡ℎ Normal 𝑉𝑉𝑡𝑡ℎ High 𝑉𝑉𝑡𝑡ℎ Normal 𝑉𝑉𝑡𝑡ℎ 0.30V 0.45V 0.30V 0.45V 0.55V 0.80V 1.10V 0.30V 0.45V 0.30V 0.45V 0.55V 0.80V 0.054 1.593 1.20 8.39 1.75 21.29 223.9 0.010 0.013 0.17 0.27 0.42 2.04 0.13 3.96 1.12 7.89 1.12 11.45 403.2 0.021 0.029 0.35 0.55 0.61 2.52 0.24 8.00 2.39 16.68 2.38 27.70 990.8 0.028 0.038 0.47 0.74 0.85 2.90 0.14 4.56 1.34 9.38 2.94 36.82 508.1 0.024 0.031 0.41 0.63 1.25 5.96 0.20 6.13 2.42 17.64 1.61 16.47 836.9 0.032 0.045 0.62 0.93 0.89 3.74 0.25 7.65 2.31 16.03 2.25 25.01 1,076 0.058 0.079 1.01 1.56 1.73 6.20 0.16 5.45 1.34 9.20 1.28 13.56 489.2 0.014 0.019 0.20 0.29 0.41 1.18 0.53 16.18 5.19 35.63 4.51 50.30 2,045 0.070 0.095 1.17 1.82 1.5 5.96 0.21 5.88 2.33 15.92 2.96 47.23 357.2 0.018 0.024 0.29 0.46 0.74 3.36 0.13 3.94 2.53 20.39 1.08 11.18 441.3 0.029 0.040 0.51 0.78 0.91 3.08 0.07 1.40 0.65 4.56 0.58 5.88 620.1 0.032 0.043 0.51 0.80 0.72 3.30 4.08 86.6 21.28 131.2 21.09 353.7 7,483 2.45 3.4 42.61 66.2 67.5 197
circuits. By incorporating relaxed timing constraints, Design Compiler finds the mapping and cells from the cell library that give the minimized power consumption. We compare the timing, power, and energy results of same benchmark circuits synthesized by 14nm CMOS (𝑉𝑉𝑡𝑡ℎ = 0.52𝑉𝑉) and 45nm CMOS (𝑉𝑉𝑡𝑡ℎ ≈ 0.35𝑉𝑉) standard cell libraries. The 14nm CMOS standard cell libraries are built by using the same procedure. Two supply voltages, 0.55V (near-threshold) for low power usage and 0.8V (super-threshold) for boosting performance usage, are supported for 14nm CMOS. The standard cell library freely distributed by North Carolina State University [26] is used for the 45nm CMOS technology. For combinational benchmark circuits, we report circuit delays that are obtained by static timing analysis performed by Synopsys Design Compiler. We run a gate-level simulation for each benchmark circuit by providing random dynamic input vectors, i.e., primary input signals have 20% chance to toggle every clock period. According to our experience, 1000 input vectors are enough to obtain a converged power results with an error less than 1%. For sequential benchmark circuits, we run similar gate-level simulations with the clock period set to be the summation of the longest static path delay and setup time of flip-flops. We report energy per operation as the average total energy consumption, including dynamic and leakage, in one clock period. Dynamic and leakage power consumptions for each benchmark circuits are reported after dividing energy consumption values by the clock period. Figure 4 and Figure 5 show the energy and the energy-delay product (EDP) results of a 20-stage inverter chain synthesized by using the 7nm FinFET devices with a normal threshold voltage, i.e., 𝑉𝑉𝑡𝑡ℎ = 0.25 𝑉𝑉. One can see that the MEP of this technology is in the sub-threshold voltage regime ( 𝑉𝑉𝑀𝑀𝑀𝑀𝑀𝑀 < 𝑉𝑉𝑡𝑡ℎ ). The minimal energy-delay product point (MEDP) sits in the near-threshold voltage regime (𝑉𝑉𝑀𝑀𝑀𝑀𝑀𝑀𝑀𝑀 ≈ 0.3 𝑉𝑉). For the 7nm FinFET devices with a high threshold voltage i.e., 𝑉𝑉𝑡𝑡ℎ = 0.32 𝑉𝑉, Figure 6 shows that the MEP still stays in the sub-threshold voltage regime. However, the MEPD
NCSU 45nm 1.10V 329.5 430.9 1015.1 645.6 1,096.1 1,944.2 495.8 2954.9 129.6 450.4 1,274.8 16,837
NCSU 45nm 1.10V 1.78 3.29 4.42 4.27 6.22 10.12 1.65 6.98 2.79 4.61 4.78 691.1
voltage moves towards to the super-threshold voltage regime, i.e., 𝑉𝑉𝑀𝑀𝑀𝑀𝑀𝑀𝑀𝑀 ≈ 0.4 𝑉𝑉 in Figure 7. When using high 𝑉𝑉𝑡𝑡ℎ devices, the increase of circuit delay dominates the decrease of the energy consumption. Thus, the MEDP increases at low 𝑉𝑉𝑑𝑑𝑑𝑑 . Figure 8 and Figure 9 report the energy and delay results of a 16-bit adder and a 16-bit multiplier synthesized using different standard cell libraries. One can observe that 7nm FinFET technology nodes show significant advantages in both energy consumption and circuits speed, against the 14nm and 45nm CMOS technology nodes. Different delay and energy consumption results are obtained for 7nm FinFET libraries with different 𝑉𝑉𝑡𝑡ℎ ’s and 𝑉𝑉𝑑𝑑𝑑𝑑 ’s. In general, using higher 𝑉𝑉𝑑𝑑𝑑𝑑 improves the circuit speed but consumes more energy, while using higher 𝑉𝑉𝑡𝑡ℎ devices does the opposite thing. A Pareto-optimal curve between energy consumptions and delays is achieved by our presented 7nm FinFET libraries, i.e., no library can achieve lower energy consumption and faster circuit speed simultaneously than others. Figure 10 and Figure 11 show a break-down of power consumption of c432 and c3540 benchmarks synthesized using different standard cell libraries. Significant reductions in both static and leakage power consumptions are observed for 7nm FinFET technology nodes, compared to the 45nm technology nodes. Note that the reason we do not observe significant power reduction by comparing results obtained from 7nm normal 𝑉𝑉𝑡𝑡ℎ FinFET at 0.30 V and 14nm CMOS at 0.55 V is because the delay of former is much shorter than that of latter, i.e., circuits running faster generally consume more power. In addition, Figure 10 and Figure 11 show that reducing 𝑉𝑉𝑑𝑑𝑑𝑑 is very effective in reducing the dynamic power consumption, while using high 𝑉𝑉𝑡𝑡ℎ devices significantly reduces the leakage power consumption. Complete results are reported in Table 1. One can observe that the circuit speed achieves significant improvements in 7nm FinFET circuits, thanks to smaller gate and parasitic capacitance. When applying super-threshold supply voltages, 7nm FinFET circuits with normal 𝑉𝑉𝑡𝑡ℎ are 3X and 15X faster than 14nm and 45nm CMOS,
1549-7747 (c) 2015 IEEE. Personal use is permitted, but republication/redistribution requires IEEE permission. See http://www.ieee.org/publications_standards/publications/rights/index.html for more information.
This article has been accepted for publication in a future issue of this journal, but has not been fully edited. Content may change prior to final publication. Citation information: DOI 10.1109/TCSII.2015.2391632, IEEE Transactions on Circuits and Systems II: Express Briefs
13020
5
respectively. Even when operating in the near-threshold regime, 7X circuit speed improvements are observed for 7nm FinFET circuits with normal 𝑉𝑉𝑡𝑡ℎ , against 45nm CMOS circuits operating in the super-threshold regime, respectively. In addition, less amount of energy per operation is consumed at lower supply voltage and smaller feature size. We first compare the results in the super-threshold regime. 7nm FinFET circuits with high 𝑉𝑉𝑡𝑡ℎ have an average energy reduction of about 10X and 1,000X compared to 14nm and 45nm CMOS circuits, respectively. The energy reduction ratios of 7nm FinFET circuits with normal 𝑉𝑉𝑡𝑡ℎ are observed to be 5X and 600X against 14nm CMOS and 45nm CMOS circuits, respectively. When operating all circuits in the near-threshold regime, 7nm FinFET devices with high and normal 𝑉𝑉𝑡𝑡ℎ can improve the energy efficiency by 16X and 7X on average, against the 14nm bulk CMOS technology, respectively. Note that no standard cell library has been found for operating 45nm CMOS circuits in the near-threshold regime. However, we can observe an average of 3,000X energy reductions for 7nm high 𝑉𝑉𝑡𝑡ℎ FinFET circuits with similar circuit speed, and an average of 1,600X energy reductions for 7nm normal 𝑉𝑉𝑡𝑡ℎ FinFET circuits with higher circuit speed, compared to 45nm CMOS circuits operating in the super-threshold regime. Table 2 further breaks down the total energy consumption per operation into a dynamic part and a leakage part. Note that the power consumption values are reported to eliminate the effect of 𝑇𝑇𝑑𝑑 and ease the comparison. One can see that from Table 2, the dynamic power consumption reduces at low supply voltage and small feature sizes. This observation agrees with our theoretical understanding of dynamic power. In contrast, leakage power consumption increases at small feature sizes because it is easier to form leakage currents in short-channel and thin gate devices. Higher leakage power consumptions are observed for 14nm CMOS circuits compared to 45nm CMOS circuits operating in the super-threshold regime. Compared to 7nm FinFET devices with normal 𝑉𝑉𝑡𝑡ℎ , using high 𝑉𝑉𝑡𝑡ℎ devices achieves up to 20X reduction in leakage power consumptions. An important property of FinFET devices comes from their high 𝐼𝐼𝑜𝑜𝑜𝑜 /𝐼𝐼𝑜𝑜𝑜𝑜𝑜𝑜 ratio, which results in higher ratio between dynamic power consumption and leakage power consumption, compared with that of CMOS circuits. One can observe from Table 2 that the ratio between dynamic power consumption and leakage power consumption is 37 on average for 7nm FinFET circuits operating in the super-threshold regime. However, this ratio is 4 for 14nm bulk CMOS operating in the near-threshold regime (we compare to results obtained in the near-threshold regime because 𝑉𝑉𝑑𝑑𝑑𝑑 is closer). Considering that larger feature size devices are less leaky, the results in Table 2 justify the property of high 𝐼𝐼𝑜𝑜𝑜𝑜 /𝐼𝐼𝑜𝑜𝑜𝑜𝑜𝑜 ratio in FinFET devices.
REFERENCES [1]
[2]
[3] [4] [5]
[6] [7] [8]
[9] [10]
[11] [12] [13]
[14]
[15]
[16] [17]
[18]
[19]
VI. CONCLUSIONS
FinFET technology becomes a promising VLSI technology for recent future due to its extraordinary properties. We developed standard cell libraries for the advanced 7nm FinFET technology node. The standard cell libraries facilitated circuit synthesis, power and timing analysis to further extend Moore’s law into deeply-scaled processes. The libraries support multiple supply voltages and threshold voltages devices, which enables voltage and frequency scaling and multi-threshold technology. Circuit synthesis results predicted that, when operating in the super-threshold regime, 7nm FinFET circuits with normal 𝑉𝑉𝑡𝑡ℎ consume 5X and 600X less energy on average, while the 7nm FinFET circuits with high 𝑉𝑉𝑡𝑡ℎ consume 10X and 1000X, compared to 14nm and 45nm CMOS circuits, respectively. When operating in the near-threshold regime, 7nm FinFET devices with normal and high 𝑉𝑉𝑡𝑡ℎ can improve the energy efficiency by 7X and 16X on average, against the 14nm bulk CMOS technology, respectively. Acknowledgements: The authors would like to thank Woojoo Lee and Ji Li for helping with the generation of simulation data.
[20]
[21] [22]
[23] [24] [25] [26] [27]
R. Dreslinski, M. Wiekowski, D. Blaauw, D. Sylvester, and T. Mudge, “Near-threshold computing: reclaiming Moore’s law through energy efficient integrated circuits,” Proc. of IEEE, Vol. 98, pp 253-256, 2010. D. Markovic, C. Wang, L. Alarcon, T. Liu, and J. Rabaey, “ Ultralow-power design in near-threshold region,” Proc. of IEEE, Vol. 98, pp 237-252, 2010. A. Wang and A. Chandrakasan, “A 180 mV FFT processor using circuit techniques,” in ISSCC, 2004. B. Zhai, D. Blaauw, D. Sylvester, and K. Flautner, “Theoretical and practical limits of dynamic voltage scaling,” in DAC, 2004. B. H. Calhoun, A. Wang, and A. Chandrakasan, “Modeling and sizing for minimum energy operation in subthreshold circuits,” IEEE J. Solid-State Circuits, Vol. 40, pp 1778-1786, 2005. T.-J. King, “FinFETs for nanoscale CMOS digital integrated circuits,” in ICCAD 2005, pp. 207–210. N. K. Jha, and D. Chen, Nanoelectronic Circuit Design, Springer Press, 2011. N. Lindert et al., "Sub-60-nm quasi-planar FinFETs fabricated using a simplified process," IEEE on Electron Device Letters, vol.22, no.10, pp.487-489, Oct. 2001. E. J. Nowak et al., “Turning silicon on its edge,” IEEE Circuits and Devices Magazine, vol.20, no.1, pp.20-31, 2004. C. Wann, K. Noda, T. Tanaka, M. Yoshida, and C. Hu, "A comparative study of advanced MOSFET concepts," IEEE on Electron Devices, vol.43, no.10, pp.1742-1753, Oct 1996. L. Chang et al., "Reduction of direct-tunneling gate leakage current in double-gate and ultra-thin body MOSFETs," in IEDM, 2001. B. Yu et al., “FinFET scaling to 10 nm gate length”, in IEDM 2002. A.R. Brown, A. Asenov, J. R. Watling, "Intrinsic fluctuations in sub 10-nm double-gate MOSFETs introduced by discreteness of charge and matter," IEEE Transactions on Nanotechnology, vol.1, no.4, pp.195-200, Dec 2002. J. Lien and S. Shen, “TSMC likely to launch 16nm FinFET+ process at year-end 2014”, Mar., 2014. [Online]. Available: http://www.digitimes. com/news/a20140328PD213.html. S. Sinha, G. Yeric, V. Chandra, B. Cline, and Y. Cao, “Exploring Sub-20nm FinFET Design with Predictive Technology Models”, in DAC, 2012. M. Dunga et al., BSIM-CMG: A Compact Model for Multi-Gate Transistors. Springer US, 2008. S. K. Gupta, W. Cho, A. A. Goud, K. Yogendra, and K. Roy, "Design space exploration of FinFETs in sub-10nm technologies for energy-efficient near-threshold circuits," in DRC, 2013. S. Chen, Y. Wang, X. Lin, Q. Xie, and M. Pedram, "Performance prediction for multiple-threshold 7nm-FinFET-based circuits operating in multiple voltage regimes using a cross-layer simulation framework," in S3S Conference, Oct. 2014. Q. Xie, et al., “5nm FinFET Standard Cell Library Optimization and Circuit Synthesis in Near- and Super-Threshold Voltage Regimes” in ISVLSI, 2014. ITRS, "Process Integration, Devices, and Structures (PIDS) 2013 Edition," [Online]. Available: http://www.itrs.net/Links/2013ITRS/2013 Chapters/2013PIDS_Summary.pdf. Liberty Library Modeling, Synopsys Inc., [online] http://www.synopsys. com/community/interoperability/pages/libertylibmodel.aspx. Q. Xie, Y. Wang, S. Chen, and M. Pedram. "Variation-aware joint optimization of supply voltage and sleep transistor size for 10nm FinFET technology,” in ICCD, Oct. 2014. HSPICE User Guide: Simulation and Analysis, Synopsys Inc., 2008. Power Compiler User Guide, Synopsys Inc., 2011. LEON2 SPRAC processor, [online] http://vlsicad.eecs.umich.edu/BK/ Slots/cache/www.gaisler.com/products/leon2/leon.html. FreePDK45,[online]http://www.eda.ncsu.edu/wiki/FreePDK45:Contents Design Compiler, Synopsys, [online] http://www.synopsys.com/Tools/ Implementation/RTLSynthesis/DCGraphical/Pages/default.aspx.
1549-7747 (c) 2015 IEEE. Personal use is permitted, but republication/redistribution requires IEEE permission. See http://www.ieee.org/publications_standards/publications/rights/index.html for more information.