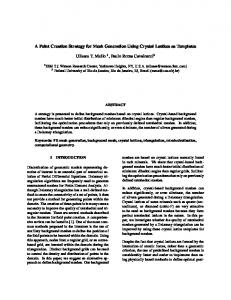
Figure 1: Splatting systems may show aliasing at close range (center). PMR draws triangles instead ... calls for a feature detection step. We do this by a Voronoi ...
PMR: Point to Mesh Rendering, A Feature-Based Approach Tamal K. Dey
James Hudson
The Ohio State University, Columbus, OH 43210
A BSTRACT Within the field of computer graphics and visualization, it is often necessary to visualize polygonal models with large number of polygons. Display quality is mandatory, but it is also desirable to have the ability to rapidly update the display in order to facilitate interactive use. Point based rendering methods have been shown effective for this task. Building on this paradigm we introduce the PMR system which uses a hierarchy both in points and triangles for rendering. This hierarchy is fundamentally different from the ones used in existing methods. It is based on the feature geometry in the object space rather than its projection in the screen space. This provides certain advantages over the existing methods. CR Categories: I.3.3 [Computer Graphics]: Picture Image Generation—Viewing algorithms; I.3.5 [Computer Graphics]: Computational Geometry and Object Modeling—Object hierarchies Keywords: rendering, feature, multi-resolution, level of details, Voronoi diagram
1
I NTRODUCTION
Interactive visualization of large polygonal meshes poses a problem to many of the present day graphic rendering systems. Indeed, the most common graphic libraries in use today do not have any builtin facilities for dealing with models that need larger RAM than the one available in the rendering computer. Of course, the problem is alleviated with larger memory, but the gain in hardware resources is fast overtaken by the demand on data size with advancing technology. This has prompted research in algorithmic techniques that can complement the available hardware and software for rendering large polygonal models. Known approaches. One way to reduce the demand on the rendering resource is by displaying only the visible parts and no more. The hierarchical Z-buffers [16], adaptive displays [14], and Hierarchical Occlusion Maps [29] fall into this category. It is also possible to coarsen or refine the model itself as it is being viewed. Progressive and view dependent meshes [19, 20], multiresolution meshes based on subdivisions [17], wavelets [4] and others [8, 13, 15, 26, 12] are examples of this approach. Most of the computation during rendering a mesh is devoted to rasterizing polygons. Consequently, efforts have focused on replacing them with easier primitives such as points that can be rendered as pixels. This has led to intense research on point cloud representation of models in recent years [1, 23, 25, 24, 30]. The notion of points as rendering primitive dates back as early as 1974 �
This research is partially supported by NSF under grants CCR-9988216 and DMS-0138456 (subcontract: Stanford University)
with the work of Catmull [3]. In 1985 Levoy and Whitted proposed points exclusively as the primitive of choice for display [22]. In [18] and [28], points are used as a primitive for ray tracing of images. The idea of view dependent hierarchy which is used in mesh rendering [20] is first incorporated in point based rendering by Rusinkiewicz and Levoy in QSplat [27] and later by Pfister et. al in Surfel [25]. Zwicker et. al introduce a screen space based splatting technique to render points with textures [30]. Kalaiah and Varshney selectively alters the size of the points to be displayed [21]. A problem with the point based rendering scheme is that when one moves very close to the surface, the sample points may be more than one screen pixel apart. This means that either a blocky image will be seen (in the case where no interpolation is done), or artifacts may be present if the interpolation is performed in screen space (an example of such a blocky image is shown in Figure 1). This problem is overcome with the hybrid techniques that use both points and triangles as rendering primitive as proposed in POP [5] and Hybrid Simplification [7]. POP uses a point hierarchy as in QSplat and uses triangles only at the lowest level. Hybrid Simplification on the other hand uses a triangle hierarchy based on edge collapsing and replaces them with points adaptively based on an error metric. We introduce a hybrid technique called PMR which is similar to POP and Hybrid Simplification in that it also uses points and triangles adaptively, but is fundamentally different in generating the hierarchy. First, PMR builds a hierarchy of points and triangles and thus, unlike POP, takes advantage of the multiple resolution of triangles as well as points. Second, the hierarchy is computed solely based upon a scale independent metric as opposed to a scale dependent error metric as in Hybrid Simplification. This is achieved by making the hierarchy dependent on intrinsic features of the model rather than its specific scaled embedding. Third, unlike POP and Hybrid Simplification, the hierarchy in PMR is built on an input point cloud without requiring that a surface mesh be input. While, if needed, one can always compute a surface mesh from a point cloud, it is sometimes prohibitive to compute such a mesh from a large data. Taking away this onus from the user, PMR provides more flexibility. A side benefit of this approach is that the hierarchy becomes lighter weight. It does not need a huge graph structure as in the Hybrid Simplification, a coarse octree structure is sufficient to hold the hierarchy instead. Our approach. Our rendering system PMR, like POP and Hybrid Simplification, utilizes both points and triangles for display. However, there are some new features which are different from previously introduced rendering systems. In particular, our algorithm makes use of feature-dependent decimation rather than screenspace projections in order to determine which points are “more important” for a visually pleasing display of the model. Indeed, if a large number of points are located near each other in an area of low curvature, it may be possible to position the viewer such that the distance between the points is more than one pixel. However, since the area is flat, there is no advantage to showing all the detail at once; a small subset of the points connected with polygons would be adequate to represent that particular area faithfully. PMR in fact does deal with this situation: it appropriately reduces the number of
Figure 1: Splatting systems may show aliasing at close range (center). PMR draws triangles instead of pixels at close range (right) and respects the features of the model. points and polygons required due to its feature-based technique. A brief overview of the method is as follows. The input point cloud is organized into an octree; this serves as a spatial decomposition of the data. As an additional benefit, the octree is used for accelerating the rendering later. An algorithm based upon the Voronoi diagram and its dual Delaunay triangulation is then used to preprocess the point set and to determine the relative importance of the points for display. This importance is computed by estimating the local feature size around a point from the point cloud itself. In addition, a polygon based approximation to the surface is also computed using information from the Delaunay triangulation. This process is repeated for several levels of decimation in order to produce a hierarchy of points and triangles; this allows the rendering time spent on each area of the image to be tailored to the specific detail requirements of that region. Finally, the pre-processed file is written to disk. The viewer application may then choose a level in the precomputed hierarchy according to the viewing distance. A simple user defined parameter can be used to control the relation between the hierarchy level and the viewer distance, thus achieving the speed/quality tradeoff. Within each hierarchy level, the choice of point vs. triangle is guided by a screen space metric. The key features of PMR can be summarized as follows.
Spatial decomposition. Our feature based hierarchy obviously calls for a feature detection step. We do this by a Voronoi based method described in [11]. Unfortunately, Voronoi diagram computations are costly. In particular, large data sets pose severe problems if the Voronoi diagram data structure demands more RAM memory than is available. Frequent thrashing in this case cripples the computation. We overcome this problem by dividing the data with an octree and then concentrating on each node individually for the Voronoi diagram and subsequent computations. This strategy has given remarkable success in Voronoi based surface reconstruction from large point clouds, see [10] for details. The depth of the octree subdivision depends on the number of points that we allow in the octree nodes at the lowest level (leaf nodes). Since these octree nodes will be used later in the rendering stage as well, it is advantageous that they not have too many or too few points within them. As the octree nodes become smaller, there are more of them to process, and overhead rises. Conversely, if the octree nodes are too few in number, some efficiency is lost in the rendering stage again. Experiments suggest that a maximum between 8000 and 12000 points per octree node provides a good balance.
(1) Good quality at all viewing distances.
p+
p+
vp
h
(2) Adaptive display based upon model complexity. (3) Adjustable speed/quality tradeoffs as the user desires. (4) The ability to use disk space during viewing which eases memory requirements.
p
S
vp
r
(5) No requirement of an input mesh. The rest of the paper is organized as follows. Section 2 describes the preprocessing step that creates the point and triangle hierarchy. Section 3 details the rendering algorithm that uses the created hierarchy stored into the disk. Section 4 shows our results and we conclude in Section 5.
(a)
(b)
(c)
��
2
P REPROCESSING
We preprocess the data to create a hierarchy of points and a triangular mesh out of them. The hierarchy is based on the geometry of the shape rather than on a screen space metric. The input point cloud is decimated wherever its density is more than needed to capture the features of the shape. A threshold parameter guides the level of this decimation resulting in a hierarchy of points. Notice that this method does not introduce any new point; it only filters the input selectively solely based on features.
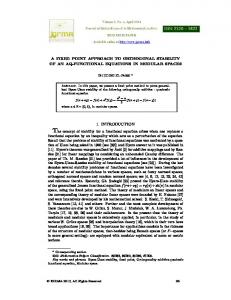
Figure 2: A long skinny Voronoi cell for a sample point � on a densely sampled surface � , (a)� the corresponding farthest Voronoi vertex ��� , estimated normal � �and the tangent polygon (shaded), (b) the height � and radius of , (c) the umbrella triangles.
Point hierarchy. It has been observed by Amenta and Bern [2] that the Voronoi cells for a point cloud that is dense with respect to local feature sizes are “long” and “skinny.” We capture
� this aspect by computing the height and radius of a Voronoi cell for a point
Figure 3: The octree for the H AND data set (far left). The hierarchy of points respects the features, from most to least detailed (center and right).
Figure 4: The hierarchy of triangles, from most to least detailed.
. The height is the distance between and the farthest Voronoi vertex in ��� ; shown as � in Figure 2(b). It is known that the vector � � from to this farthest Voronoi vertex estimates the normal at on the sampled surface. Therefore, the plane passing through having � � as its normal estimates the tangent plane at . This tangent plane intersects ��� within a convex polygon, which we call the tangent polygon for . See Figure 2 for an illustration. The radius of � � is the distance of to the furthest point in the tangent polygon; shown as � in Figure 2(b). Intuitively, the height of a Voronoi cell measures the distance of a sample point from the medial axis of the shape enclosed by the surface. This distance is small where the surface bends sharply (high curvature) or has other parts of the surface near by. This means that the height measures the local feature size. The radius, on the other hand, measures the distance between sample points that are neighbors on the surface. Thus, the ratio � ����� � � ����� gives an estimate of the sample density with respect to the local �� feature size. The decimation step that is used to create the point hierarchy removes those points whose Voronoi cells have ������� � � ����� ratio smaller �� than a threshold value � because they must have several other points close to them and so they are redundant for the display of the surface at a lower resolution. Points in areas with high curvature or small features will be retained because their cells will not be long and skinny. An iterative point deletion with the above ratio condition generates a point cloud for one level in the hierarchy. Different levels of the hierarchy are created via adjusting the value of the threshold � . In particular, the decimation should be relatively low in the more detailed levels of the hierarchy so that there will be sufficient detail for close views. In addition, since sparser data sets are able to be displayed more rapidly, the most decimated levels of the hierarchy may be comparatively sparse, since they will not be shown unless the corresponding part of the object is further away. For our experiments, we typically used a range of values from � =0.1 to � =1.0, with a spacing of 0.1 to 0.2 between successive val-
ues. The Voronoi diagram is continuously updated throughout the preprocessing. Obviously, computation of the height and radius requires that all surface neighbors of each point be present while computing the Voronoi diagram for each octree node � . Although this is the case for most points, the points near the boundary of � do not have their neighbors. To remedy this, we include points from all adjacent nodes while computing the Voronoi diagram of the points in � (that is, any leaf node that shares an edge, face, or vertex with the node). Those points which are outside � are processed just as any other point with the exception that their information is not written to disk at this time (the data for any point is written only when the leaf node containing it is the current one being processed). Figure 3 shows the point hierarchy for the H AND data set. Triangle hierarchy. Each point cloud in the point hierarchy is also equipped with a set of triangles that approximate the surface for display at higher resolutions. Let �!�" �$#�"�%�%�"&�$' be the hierarchy of point clouds created for a node � . Let �(� be the Voronoi cell of a point in the Voronoi diagram of a point cloud � in this hierarchy along with the points at the same hierarchy level from neighboring leaf nodes. The tangent polygon of computed with this Voronoi diagram intersects certain Voronoi edges in �(� . We take the dual Delaunay triangles of these edges which create an umbrella for at the hierarchy level ) ; see Figure 2(c). For sufficiently dense point samples, the umbrella triangles lie flat with respect to the surface – an observation that follows from the results in [9]. The umbrella triangles for represent the interpolated surface locally around . All such umbrella triangles at level ) create the ) th level of the triangle hierarchy. Figure 4 shows the hierarchy of triangles produced by this method for the H AND data set. Records. In addition to the point and triangle hierarchy, we also compute some other information within each leaf node. For each
hierarchy level, we determine the umbrella radius for a point � , which is the maximum distance of � to any other vertex in its set of umbrella triangles. Later, this umbrella radius is used to select whether to render a given sample point as a single pixel or as a collection of umbrella triangles. In addition, the average value of all the umbrella radii at each hierarchy level is also computed and stored. This is used later to determine the level of hierarchy which should be selected for display. It should be noted that a triangle which is present in one sample point’s umbrella will very likely be present within the umbrellas of the other two vertices of that triangle. To accelerate rendering, then, it is useful to associate a flag with each triangle so that in subsequent rendering it is only drawn once. The entire octree is written into the disk with the following information. (1) Point list : the points in a leaf node are placed consecutively in this list. (2) Normals : the estimated normals at each point from the Voronoi diagram of the undecimated point set at each leaf node. (3) Octree structure : the tree data structure representing the octree. (4) Hierarchy : Each level of the hierarchy in a leaf node has (a) A list of umbrella triangles for each vertex (b) umbrella radii for each vertex and the average umbrella radius over all points. All preprocessing steps can be done offline, thus saving time during rendering. Moreover, if the disk file containing the octree information is mapped into memory, the octree does not need to take the full amount of RAM that would otherwise be necessary. If the viewing system does not have enough memory to hold all the data at once, portions can be selectively paged to and from the disk file.
3
V IEWING
After the preprocessed file is written to disk, it may now be viewed in an accelerated manner. We take advantage of the system call mmap() under Linux; this references a disk file as if it is actually an area of RAM. The operating system’s disk caching facilities then handle the buffering of recently used data in memory and provide for fast access to frequently used information. If the disk file is larger than the available memory space, data can be selectively loaded from disk or purged from memory as needed under the control of the operating system. One may observe that there is no need to build any octree data structure at this time since the stored file already has the data blocked into nodes and the octree is thus stored there. The octree decomposition of the point cloud also could allow us to selectively cull away portions of the model which lie outside the view frustum. This is the same idea as used in QSplat; the rationale is that no effort should be spent on invisible nodes. Once a node is chosen for display, we first need to select an appropriate level of hierarchy for it. Next, we need to determine whether to render a particular point as a single pixel or as an umbrella of triangles. In fact, both of these questions are answered via a mapping between the world and the screen space. World to screen space. It is necessary to determine the size of a pixel (referred to as pixel size) in relation to the “world space” in which the object’s point coordinates are defined. However, a single pixel covers an ever-increasing amount of such space as its distance
�
�
�
Figure 5: The pixel size grows as distance from the viewer increases. from the eye point increases – or, equivalently, as its Z-buffer value grows larger (see figure 5). Therefore, it is necessary to map the distance of the model from the viewer to the pixel size. Since it would be too expensive to perform such an estimation for every point in the model, we again make use of our octree data structure. Specifically, when a leaf node is processed, we examine its eight corner vertices. One of these vertices will be closest to the eye point. Next, we take another world space point which is also at the same distance from the eye but is one world space unit away from the corner point. Both points are projected to screen space. The distance between them in screen space is then computed. The reciprocal of this distance gives an estimate of the size of a pixel at a given distance from the eye. This size, then, is taken as the pixel size anywhere within that octree node. Note that this is a conservative estimate: as one moves further from the eye within that node, the amount of world space covered increases, so we are underestimating the pixel’s coverage. As we will see later, this amounts to overestimating the amount of detail needed for a given area of the image; however, it does ensure that no hole appears in the rendering at the expense of possibly performing a small amount of extra work. Figure 7 shows the hierarchies chosen based on the pixel size. Selecting hierarchy. Recall that each node has several levels of a point hierarchy contained within itself. To select a hierarchy level, we choose the level which has an average umbrella radius that is close to being the same as the estimated pixel size for that node. The idea is that this will allow the maximum number of sample points to be rendered as pixels. It has been observed that point-based rendering is much faster than polygon-based rendering, so we attempt to favor this as much as possible when it can be done without compromising quality. In order to allow the user to trade off quality for speed, we provide a selectable value that indicates the screen-space tolerance for error. This is done by selecting a level whose average umbrella radius is a user-defined constant factor multiplied by the estimated pixel size. Table 2 and Figure 9 exemplify this quality/speed tradeoff. Point vs. umbrella. To determine whether to render a point as a point or an umbrella, we again compare the twice the umbrella radius with the estimated pixel size for the given leaf node. The value is doubled to ensure that there is no possibility of a hole appearing, as it might if the umbrella were nearly circular and the radius was close to the estimated pixel size. If the pixel size is larger than twice the umbrella radius, it must be the case that the pixel completely covers the point in question. Moreover, it also covers the entire umbrella of that point as well. In that case, it would be a waste of resources to render anything more than a single point since all details are “hidden” within that single pixel. Thus, in this case, a single point is rendered. Otherwise, the full umbrella is drawn since the detail covers more than one pixel. Drawing the entire umbrella also ensures that no holes appear within the surface. Recall that the pixel size was underestimated previously, so any inaccuracies will tend to lead to more umbrellas being drawn; this also prevents the appearance of holes. Figure 6 shows that more points are rendered as the object recedes further from the eye. However,
0.11 FPS; 4554966 triangles; 0 points (full detail mesh; close range)
0.77 FPS; 669820 triangles; 48267 points (PMR; close range)
Figure 6: DAVID H EAD at different viewing distances; FPS
since the hierarchy level used also changes, the number of points does not increase too much; instead, the system switches to using a sparser hierarchy level and draws triangles instead. Thus, both the total number of points drawn and the total number of triangles decreases. Algorithm. The display procedure calls the Render procedure and passes it an argument of the octree’s root node. This procedure in turn makes use of another procedure called Render-Node:
1.65 FPS; 215034 triangles; 204050 points (PMR; even further away)
frames/second. Points are shown in red; triangles are shown in blue.
Object D RAGON H APPY B LADE DAVID H EAD S T M ATTHEW
Vertices 437645 542557 882954 2000646 3382855
Time 03:53 04:36 09:02 06:36 26:38
Hierarchy size (MB) 97 150 238 512 479
Table 1: Preprocessing statistics. Times are given in hours:minutes.
RENDER - NODE (Leaf
1 2 3 4 5 6 7 8 9 10 11
Node N) estimate the pixel size for N select the level of hierarchy for each point present at this level decide how to draw: point or umbrella if point draw as pixel else for each triangle in point’s umbrella if triangle not yet rendered render triangle mark as rendered
0.65 FPS; 656223 triangles; 377452 points (PMR; at a distance)
(OctreeNode N) if N is a leaf node call Render-Node(N) else for each child of N call Render(child)
RENDER
1 2 3 4 5
4
R ESULTS
We experimented with PMR on several large data sets available from Georgia Tech and Stanford web sites [33, 34]. The system used for these tests contained an Intel Pentium 4 processor running at 1.7 GHz. The system was configured with 2GB of RAM and a Matrox Millenium G450 graphics card. The Voronoi diagrams for the hierarchies were generated with the help of the CGAL library [32]. This hierarchy computation uses point deletions in 3D Voronoi diagrams which is not yet efficiently implemented in CGAL. As a result, though off-line, the preprocessing for generating the hieararchy took considerable time; see Table 1. Figure 6 shows the rendering speed with DAVID H EAD at different viewing distances. As the model recedes further, more points
are rendered and more decimated level of the hierarchy is chosen. This results in higher frame rates. Figure 7 shows the hierarchy that is used for the display. The triangles and points within each octree leaf node are colored according to the level of hierarchy that was selected for that leaf node. Notice that those areas closest to the viewer tend have the most detailed representation; those further away are more likely to have less detail since it is not needed for a good display. However, this not true in all cases. For example, the top of DAVID H EAD in Figure 7 is colored blue though the region is closer to the viewer. The reason for this fact is that the sample is extremely dense in this area and PMR can produce acceptable quality while using the most decimated level in the hierarchy, despite the fact that the area is close to the viewer. Figure 8 shows the result of PMR compared to the full-detail representations. The quality differences between them are not very apparent even at close range, which highlights the quality preservation of PMR. As was mentioned previously, there is a user-definable tolerance factor available for determining the amount of detail to display. The higher this factor, the faster is rendering with lower quality. Table 2 illustrates the rendering speed dependency on this factor. Recall that we varied the decimation threshold � from 0.1 to 1.0 in steps of 0.1 or 0.2 to generate the point hierarchy. When � is large (close to 1.0), features of the model are distorted or lost. However, this loss is not visibly significant when those parts of the model are further away. In order to make sure that the sparse hierarchy levels are availed only when the viewing distance is quite large, we introduce a modification to the tolerance factor computation. No alteration in the tolerance factor occurs until a pixel size is at least two. After this, we reduce the factor linearly until the pixel size is at least four, at which point the factor will have a value of one. The net effect of this modification is to slow the transition as the decimation level becomes progressively more sparse. Consequently, the very sparse levels are not used until their lower resolution is not visible. All timing figures cited in this paper make use of this modification.
D RAGON
DAVID H EAD
0.54 FPS (full detail)
3.85 FPS (PMR)
0.25 FPS (full detail)
0.71 FPS (PMR)
0.43 FPS (full detail)
3.44 FPS (PMR)
B LADE
H APPY
Figure 7: The hierarchies. Red denotes the most detailed area, followed successively by orange, yellow, green, and blue as more decimated levels are used. Figure 9 illustrates the dependency of the quality on the tolerance factor at different viewing distances. The left column is produced with a factor of one, while the right column is produced with a factor of five. In the top three images, the eye is placed at a distance from the scene; notice that less detailed hierarchy levels are used and factor 3 and 5 both use the most decimated hierarchy level. In the middle images, the eye has been moved closer. For this reason, the program switches to more detailed hierarchy levels for factor 1, but chooses less detailed level for factor 3 and 5. Finally, the area highlighted is viewed at a very close distance in the bottom row where detailed levels are used for all factors.
5
C ONCLUSIONS
We have introduced PMR, a hybrid rendering scheme that uses both points and triangles adaptively for display. The hierarchy is precomputed with the feature geometry in the object space and is selected with a screen space during display. An input surface is not required, and the separation of tasks into preprocessing and viewing stages allows for a fruitful division of labor and a higher frame rate while rendering. Experiments on several large data show PMR’s effectiveness in maintaining quality, speed and providing a speed/quality tradeoff. A future research direction would be to investigate if and how the method of PMR can be applied to volume rendering. The idea of “dividing cubes” projecting to a less than a pixel [6] is an evidence
Figure 8: Comparison of full-detail meshes and the hierarchical renderings at close range for D RAGON, B LADE, and H APPY. FPS denotes the frames rendered per second.
that such rendering scheme may be useful. Acknowledgement: We thank Marc Levoy for letting us use mod-
els from the Digital Michaelangelo Project.
[24] M. Pauly and M. Gross. Spectral processing of point-sampled geometry. Proc. SIGGRAPH 2001, (2001), 379–386.
R EFERENCES
[25] H. Pfister, M. Zwicker, J. van Baar, and M. Gross. Surfels: Surface elements as rendering primitives. Proc. SIGGRAPH 2000, (2000), 335– 342.
[1] M. Alexa, J. Behr, D. Cohen-Or, S. Fleishman, D. Levin and C. T. Silva. Point set surfaces. Proc. Visualization 2001, (2001), 21–28. [2] N. Amenta, M. Bern and M. Kamvysselis. A new Voronoi-based surface reconstruction algorithm. Proc. SIGGRAPH 98, (1998), 415-421. [3] E. Catmull. A subdivision algorithm for computer display of curved surfaces. PhD thesis, University of Utah, 1974. [4] A. Certain, J. Popovi´c, T. DeRose, T. Duchamp, D. Salesin and W. Stuetzle. Interactive multiresolution surface viewing. Proc. SIGGRAPH 96, (1996), 91–98. [5] B. Chen and M. X. Nguyen. POP: A hybrid point and polygon rendering system for large data. Proc. Visualization 2001, (2001), 45–52. [6] H. E. Cline, W. E. Lorensen, S. Ludke, C. R. Crawford and B. C. Teeter. Two algorithms for the three-dimensional reconstruction of tomograms. Medical Physics, vol. 15, (1988), 320–327. [7] J. D. Cohen, D. G. Aliaga and W. Zhang. Hybrid Simplification: combining multi-resolution polygon and point rendering. Proc. Visualization 2001, (2001), 37–44. [8] J. Cohen, A. Varshney, D. Manocha, G. Turk, H. Weber, P. Agarwal, F. Brooks and W. Wright. Simplification envelopes. Proc. SIGGRAPH 96, (1996), 119–128. [9] T. K. Dey and J. Giesen. Detecting undersampling in surface reconstruction. Proc. 17th Ann. Sympos. Comput. Geom., (2001), 257–263. [10] T. K. Dey, J. Giesen and J. Hudson. A Delaunay based shape reconstruction from large data. Proc. IEEE Sympos. in Parallel and Large Data Visualization and Graphics, (2001), 19–27. [11] T. K. Dey, J. Giesen and J. Hudson. Decimating samples for mesh simplification. Proc. 13th Canadian Conf. Comput. Geom., (2001), 85–88. [12] J. El-Sana and A. Varshney. Controlled simplification of genus for polygonal models. Proc. Visualization 97, (1997), 403– 412. [13] L. de Floriani, P. Magillo and E. Puppo. Multiresolution representation and reconstruction of triangulated surfaces. In Advances in Visual Form Analysis, C. Arcelli, L. Cordella, G. Sanniti di Baja (Editors), World Scientific, Singapore, (1997), 140–149. [14] T. Funkhouser and C. Sequin. Adaptive display algorithm for interactive frame rates during visualization of complex virtual environments. Proc. SIGGRAPH 93 (1993), 247–254. [15] M. Garland and P. S. Heckbert. Surface simplification using quadric error metrics. Proc. SIGGRAPH 97, (1997), 209–216. [16] N. Greene, M. Kass, and G. Miller. Hierarchical Z-Buffer visibility. Proc. SIGGRAPH 93, (1993), 231–238. [17] I. Guskov, W. Sweldens and P. Schr¨oder. Multiresolution signal processing for meshes. Proc. SIGGRAPH 99, (1999), 325–334. [18] J. Grossman and W. Dally. Point sample rendering. 9th Eurographics Workshop on Rendering, (1998), 181–192. [19] H. Hoppe. Progressive meshes. Proc. SIGGRAPH 96, (1996), 99-108. [20] H. Hoppe. View-dependent refinement of progressive meshes. Proc. SIGGRAPH 97, (1997), 189–198. [21] A. Kalaiah and A. Varshney. Differential point rendering. Rendering Techniques 2001, (2001). S.G. Gortler and K. Myszkowski, ed. Springer-Verlag, August 2001. [22] Marc Levoy and Turner Whitted. Technical Report 85-022: University of North Carolina at Chapel Hill Computer Science Department, January 1985. [23] N. Max and K. Ohsaki. Rendering trees from precomputed Z-buffer view. Proc. Eurographics Workshop on Rendering, June 1995.
[26] J. Rossignac and P. Borrel. Multi-resolution 3D approximations for rendering. Modeling in Comput. Graphics, (1993), 455–465. [27] S. Rusinkiewicz and M. Levoy. QSplat: A multiresolution point rendering system for large meshes. Proc. SIGGRAPH 2000, (2000), 343– 352. [28] G. Schaufler and H. W. Jensen. Ray tracing point sampled geometry. Proc. Eurographics Rendering Workshop (1998). [29] H. Zhang, D. Manocha, T. Hudson, and K. Hoff. Visibility culling using hierarchical occlusion maps. Proc. SIGGRAPH 97, (1997), 77– 88. [30] M. Zwicker, H. Pfister, J. van Baar and M. Gross. Surface splatting. Proc. SIGGRAPH 2001, (2001), 371–378. [31] Cocone software for surface reconstruction. Available from http://www.cis.ohio-state.edu/ tamaldey/cocone.html [32] CGAL consortium. CGAL: Computational Geometry Algorithms Library. Available from http://www.cgal.org [33] QSplat models from Stanford University. Available http://graphics.stanford.edu/software/qsplat/models/
from
[34] Georgia Tech Large Model Archive. http://www.cc.gatech.edu/projects/large models/
from
Available
[35] Qsplat software. Available from http://graphics.stanford.edu/software/qsplat/
Object D RAGON H APPY B LADE DAVID H EAD S T M ATTHEW
Number of Vertices 437645 542557 882954 2000646 3382855
FPS Full Mesh 0.54 0.43 0.25 0.11 0.072
FPS Hierarchy, Factor=1 0.57 0.54 0.27 0.32 0.64
FPS Hierarchy, Factor=3 1.69 2.29 0.71 0.61 0.66
FPS Hierarchy, Factor=5 3.85 3.44 0.71 0.78 0.67
Table 2: Frame rates with different factors.
0.64 FPS
0.67 FPS
0.67 FPS
0.29 FPS
0.59 FPS
0.59 FPS
0.16 FPS
0.74 FPS
0.96 FPS
Figure 9: St. Matthew data: Factor=1 (left), factor=3 (middle), and factor=5 (right). As in Figure 7, color denotes the hierarchy level. Top: The eye is furthest from the figure. Middle: As the eye draws nearer, more detailed hierarchy levels are used. Bottom: The most detailed hierarchy levels are used when the eye is very close to the figure. FPS denotes the frames rendered per second.