Qi Dou. 1. , Liansheng Wang. 3. , Jing Qin. 4. , Pheng-Ann Heng. 1. 1. Dept. of Computer Science and Engineering, The Chinese University of Hong Kong, Hong ...
2018 IEEE Winter Conference on Applications of Computer Vision
ScanNet: A Fast and Dense Scanning Framework for Metastastic Breast Cancer Detection from Whole-Slide Image Huangjing Lin1∗, Hao Chen1,2,∗ , Qi Dou1 , Liansheng Wang3 , Jing Qin4 , Pheng-Ann Heng1 1 Dept. of Computer Science and Engineering, The Chinese University of Hong Kong, Hong Kong, China. 2 Imsight Medical Technology Inc., China. 3 Dept. of Computer Science and Technology, Xiamen University, Xiamen, China. 4 School of Nursing, The Hong Kong Polytechnic University, Hong Kong, China. {hjlin, hchen}@cse.cuhk.edu.hk
Abstract
metastases, especially in the sentinel lymph nodes under arm, is a routine procedure for cancer staging performed by pathologists. According to the pathologic tumour, node and metastasis (TNM) breast cancer staging system [11], positive metastasis would lead to a higher staging of the patient, and afterwards necessary treatments would be accordingly arranged.
Lymph node metastasis is one of the most significant diagnostic indicators in breast cancer, which is traditionally observed under the microscope by pathologists. In recent years, computerized histology diagnosis has become one of the most rapidly expanding directions in the field of medical image computing, which aims to alleviate pathologists’ workload and simultaneously reduce misdiagnosis rate. However, automatic detection of lymph node metastases from whole slide images remains a challenging problem, due to the large-scale data with enormous resolutions and existence of hard mimics resulting in a large number of false positives. In this paper, we propose a novel framework by leveraging fully convolutional networks for efficient inference to meet the speed requirement for clinical practice, while reconstructing dense predictions under different offsets for ensuring accurate detection on both microand macro-metastases. Incorporating with the strategies of asynchronous sample prefetching and hard negative mining, the network can be effectively trained. Extensive experiments on the benchmark dataset of 2016 Camelyon Grand Challenge corroborated the efficacy of our method. Compared with the state-of-the-art methods, our method achieved superior performance with a faster speed on the tumor localization task and even surpassed human performance on the WSI classification task.
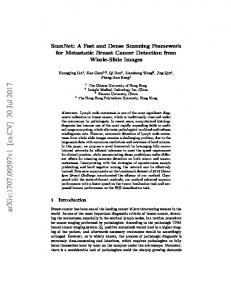
However, as is widely known, the process of pathologic diagnosis is extremely time-consuming and laborious, which requires pathologists to fully focus themselves hour by hour on the samples under the microscope. This process is highly relied on the experience of pathologists and has limited reproducibility. Moreover, there is a considerable lack of pathologists amid the sharply growing demands of diagnosis with the cancer morbidity increasing [16]. The pathologists have to diagnose hundreds of biopsy slides everyday, thus it is quite difficult, if not impossible, for a thorough inspection of whole slide and the risk of mis-diagnosis might increase if only regions of interest are analyzed. Over the last decade, computerized histology analysis has been one of most rapidly expanding fields in medical image computing. The computer aided diagnosis methods can not only alleviate pathologists’ workload, but also contribute to reducing the misdiagnosis rate. With the advance of high-throughput scanning technology, whole-slide image (WSI) analysis is becoming essential in digital pathology. The WSIs are generally stored in a multi-resolution pyramid structure, with multiple down-sampled versions of original image [13]. The original image with the largest resolution is referred as level-0, and other versions from down to up are called as level-1to level-n, as shown in Figure 1 (a).
1. Introduction 1.1. Background
Metastasis detection in sentinel lymph node from WSIs plays a key role in breast cancer staging. However, it is quite difficult with following challenges: 1) the large variations of biological structures and textures in both metastatic regions and background (Figure 2(a)); 2) the hard mimics from nor-
Breast cancer has been one of the leading cancer killers threatening women in the world [14]. As one of the most important diagnostic criteria of breast cancer, detecting the ∗ Authors
contributed equally
978-1-5386-4886-5/18/$31.00 ©2018 IEEE DOI 10.1109/WACV.2018.00065
539
ied on regions of interest (ROI), e.g., image size 500 × 500, pre-selected by pathologists from WSIs. In the earlier years, the most of methods are designed based on hand-crafted features. For nuclei detection and segmentation, a basic function in breast cancer diagnosis, researchers proposed a series of level set methods equipped with many of hand-crafted features, such as Hough transform [9], gradient [19] and concavity [12], etc., which are exquisitely applied and designed with prior knowledge of boundary, region or shape. Afterwards, several traditional hand-crafted feature based machine learning frameworks, like Bayesian classifier [17], Support Vector Machine [26], are proposed to detect or segment nuclei. These kinds of hand-crafted methods were also widely applied in other digital histopathological applications, such as level set for tubule segmentation in breast cancer [28, 2] and Support Vector Machine for gland detection in prostate cancer [24], etc. However, the representation capabilities of hand-crafted features are very limited to fit such complex or large various patterns. Recently, with the advent of powerful computation, deep learning methods have attained significant achievements in a wide range of fields. Many methods have been proposed for medical image recognition tasks, such as anatomical structure localization [7] from 2D ultrasound images and 3D volume segmentation from CT volumes [10, 20]. In the field of digital histopathology, Xu et al. [29] exploited stacked sparse autoencoders (SSAE) with unsupervised pretraining for nuclei detection from breast cancer histopathology images. A sibling fully convolutional network with prior objectness was presented in [31] and achieved excellent performance on the nuclei detection and fine-grained classification. Deep neural networks have been employed in mitosis detection from breast cancer histopathology images [8, 5] and achieved good performance in two grand challenges [21, 25]. Chen et al. [6] presented a deep contour-aware network for gland as well as nuclei instance segmentation from histopathological images, which outperformed other methods by a large margin in two challenges recently [23]. However, these methods were studied in the pre-selected regions of interest, which are not suitable for real clinical practice.
�����
������ � ���
����������� ��
�
������ �
��������
� �
� �
Figure 1. The WSI structure and multi-level mapping strategy. (a) The multi-resolution pyramid structure of whole-slide image. (b) multi-level mapping strategy for acceleration in pre-processing. ��� ���� �
������
������
��� ���� �
���� ��������������
���� ��������������
����
����
����
� ��
Figure 2. Illustration of the challenges for computerized histology image. (a) Variations of biological structures and textures. (b) Hard mimics from normal tissues in background. (c) Appearance variations due to the acquisition process. (d) Size difference between micro- and macro-metastases.
mal tissues which carry similar morphological appearance with metastatic regions, shown in Figure 2(b); 3) as illustrated in Figure 2(c), the image appearance is prone to be affected by the image acquisition process, e.g., sampling, staining and digitalizing; 4) the significant size variance between micro- and macro-metastases, see Figure 2(d). Last but not least, the size of WSI is extremely huge, approximating to 200, 000×100, 000 pixels. How to efficiently process such a giga-pixel image further poses challenges for automatic detection methods.
1.2. Related work The early studies of histology image analysis can date back to 90s [1, 15]. During these decades, with the dramatic advance in computer power and image scanning techniques, many works have been proposed for histology image recognition applications, which can be categorized as following two parts. 1.2.1
1.2.2
Whole-slide Image Analysis
To our best knowledge, there were limited works processing histology images in the whole-slide level until the challenge on cancer metastasis detection in lymph node (Camelyon16)1 held in conjunction with 2016 ISBI recently. In this challenge, Wang et al. [27] employed an ensemble of two GoogLeNets and achieved the best performance on
Region of Interest Analysis
Due to lack of whole-slide scanning techniques and computational power at the beginning, most of previous work stud-
1 2016 ISBI Camelyon challenge: grand-challenge.org/
540
https://camelyon16.
metastasis detection. However, their framework used patchbased classifications, which would significantly increase the computation cost at the finest resolution (i.e., level-0), and hence is suboptimal in real clinical practice. Recently, Xu et al. [30] proposed a sparse kernel technique to accelerate the pixel-wise predictions, which could alleviate the efficiency problem to some extent. However, pixel-wise predictions would cost much more time and are not necessary in our underlying problem.
�� � ������
1.3. Contributions
� ������ ���� ���� �� ��� �� ����
���!��� ������� ���!��� ������ �������
����!��� �������
���� ��� ��� ������ ���� � ���� ���� � ��� ������ ���� � ���� �����
����� �����
����� �����
" #�
"�#�
" #�
" #� ���� ������������������ ���� ����������������� �� ������ ���� �� ������ ���
The contributions of our work can be summarized as follows: • We propose a novel framework, referred as ScanNet, by leveraging fully convolutional networks (FCN) for efficient inference to meet the speed requirement for clinical practice, which can be up to a dozens of times faster than other patch-based methods.
��
�����
�����������
���������� �������������"����#�
�����
���������� ������������"���#�
Figure 3. The illustration of our method. Top: the framework of our method. Bottom: reconstruction for dense predictions.
• In order to further improve the performance, a dense reconstructing mechanism is explored for ensuring accurate detection on both micro- and macro-metastases. Incorporating with the strategies of asynchronous sample prefetching and hard negative mining, our proposed network can be effectively trained.
divide-and-conquer strategy enables the possibility of automatically processing such a giga-pixel level image with limited GPU memory. To be specific, division is performed in the pre-processing, with ROIs pre-selected and conquered respectively by the ScanNet later. Afterwards, the individual probability tiles derived from the ROIs are stitched together to generate the whole prediction map as illustrated in Figure 3 (bottom). The ScanNet inherently falls into the cohort of FCN structure, which is equivalent to a patch-wise CNN with input size Lf of patch and sliding stride Sf . Here, we call Lf and Sf as the inner input size and inner stride of ScanNet (as dimensions are square, we denote the side length for brevity). With one patch corresponding to one prediction value, a patch slides n times over the WSI along one dimension will generate n + 1 prediction values, i.e., a ROI sized Lr = Lf + n ∗ Sf produces a probability tile sized Lp = n + 1. To ensure the neighbouring probability tiles with different offsets can be seamlessly stitched without gaps and overlaps, the ROIs are fetched with sliding stride Sr = Sf ∗ Lp , see Figure 3 (b) to (c). In summary, the rules should be satisfied as follows: � Lr = Lf + (Lp − 1) ∗ Sf (1) Sr = Sf ∗ Lp
• Extensive experiments on the benchmark dataset of Camelyon16 corroborated the efficacy of our method. Compared with the state-of-the-art methods, our method achieved superior performance with a faster speed on the tumor localization task and even surpassed human performance on the WSI classification task.
2. Methods Figure 3 (top) illustrates the pipeline of our proposed fast and dense scanning framework, referred as ScanNet, for metastatic breast cancer detection from WSIs. We first employ a simple yet efficient method to remove the noninformative regions of input WSI. Then we feed preprocessed images into the modified FCN equipped with dense reconstruction mechanism for efficient and dense predictions. Finally, we utilize simple morphology operations to refine the results.
2.1. Divide and Conquer
2.2. Fast Metastasis Detection from WSI via ScanNet
Before going into details, we first elaborate the strategy of divide and conquer from a global perspective, i.e., how to divide such an extremely large WSI into ROIs before inputting them into the ScanNet. Afterwards, we focus on the details about how to conquer the ROI from a local perspective, including network design and dense reconstruction mechanism. Due to the incredible size of WSI, the
Pre-Processing. It is observed that more than 70% area of a typical WSI is covered by non-informative background, which is futile for cancer assessment. In order to remove these regions for saving computational cost, we employ the simple OTSU algorithm [18] to determine the adaptive
541
threshold and filter out most of the white background. Afterwards, ROIs contained informative regions are pre-selected based on OTSU mask. In addition, to accelerate this operation, we conduct OTSU algorithm using a multi-level mapping strategy based on the merit of pyramid structure, as demonstrated in Figure 1 (b). That is we filter the downsampled (e.g., level-5) image first and then map the filtered image back into the original (level-0) image, which achieved dozen times of acceleration in the pre-processing step. Fast Prediction via ScanNet. In a local perspective, we propose to harness a modified FCN (i.e., ScanNet) for fast prediction in large WSIs by taking its advantage of taking arbitrary sized images as input. Different from standard FCNs that are commonly used for segmentation tasks [6], our ScanNet has no upsampling path which is a must for segmentation but not necessary for detection tasks. Furthermore, the upsampling path would greatly slow down the detection process considering the large size of WSIs. Using the FCN without upsampling path, our method can efficiently and accurately output a probability tile with a much smaller size than the input image. We further leverage a reconstruction algorithm, which will be elaborated in the next subsection, to generate a denser one by assembling these small tiles.
Layer Input Conv1 Conv1 Pool1 Conv2 Conv2 Pool2 Conv3 Conv3 Conv3 Pool3 Conv4 Conv4 Conv4 Pool4 Conv5 Conv5 Conv5 Pool5 Conv6 Conv7 Conv8
Table 1. The Architecture of ScanNet.
1 2 1 2 1 2 3 1 2 3 1 2 3
Feature maps (Train) 244×244×3 242×242×64 240×240×64 120×120×64 118×118×128 116×116×128 58×58×128 56×56×256 54×54×256 52×52×256 26×26×256 24×24×512 22×22×512 20×20×512 10×10×512 8×8×512 6×6×512 4×4×512 2×2×512 1024 1024 2
Feature maps (Predict) 2868×2868×3 2866×2866×64 2864×2864×64 1432×1432×64 1430×1430×128 1428×1428×128 714×714×128 712×712×256 710×710×256 708×708×256 354×354×256 352×352×512 350×350×512 348×348×512 174×174×512 172×172×512 170×170×512 168×168×512 84×84×512 83×83×1024 83×83×1024 83×83×2
Kernel size 3×3 3×3 2×2 3×3 3×3 2×2 3×3 3×3 3×3 2×2 3×3 3×3 3×3 2×2 3×3 3×3 3×3 2×2 2×2 1×1 1×1
Stride 1×1 1×1 2×2 1×1 1×1 2×2 1×1 1×1 1×1 2×2 1×1 1×1 1×1 2×2 1×1 1×1 1×1 2×2 1×1 1×1 1×1
ple prefetching mechanism by using multiple producer processes of CPU to prepare the training samples while one consumer process for GPU to consume the training data. This strategy can keep GPU running all the time and boost at least 10 times acceleration in the training stage. Extensive Data Augmentation. Data augmentation is important for alleviating the overfitting issue. Benefiting from the merit of on-the-fly fetching, we can augment the samples quite flexibly, including translation, rotation, scaling, flipping and color jittering. Hard Negative Mining. While there exist lots of negative training samples from the WSIs, most of them can be easily distinguished from the true metastases. In order to enhance the discrimination capability of our ScanNet, we add the false positive samples, i.e., hard negative mining (HNM) examples, from the previously trained classifier back to the training data. This strategy makes the training process more effectively by focusing on hard cases, which can help to significantly boost the recognition performance.
We implement the proposed ScanNet based on a modified VGG-16 [22] network by replacing the last three fully connected layers with fully convolutional layers 1024 × 1024 × 2 (i.e., kernel size 1 × 1). In order to avoid the boundary effect of FCN predictions, the padding operations are removed from our architecture, as shown in the training phase of Table 1. Based on this modification, our ScanNet can enjoy the transferred features learned from a large set of natural images [6], which demonstrated consistent improvements over that without transfer learning. In the training phase, we employ patch samples with size as 244 randomly cropped from WSIs to train the ScanNet. In the predicting phase as shown in Table 1, by leveraging the merit of the fully convolutional architecture, our ScanNet can take an ROI with a large size up to Lr = 2868 (determined by the maximal capacity of GPU memory) as input and output a probability tile with size Lp = 83, as denoted in Eq. (1). By such a way, our ScanNet can process a WSI more than hundreds of times faster by removing the redundant convolution computations than patch-based classification methods with the same stride. Effective Training Strategies. To enhance the learning process of proposed network, we employ following effective training strategies: Asynchronous Sample Prefetching. During the training phase, the heavy I/O bottleneck always exists, i.e., the GPU is often idle while waiting for fetching batched training data. To resolve this issue, we adopt an asynchronous sam-
2.3. Dense Reconstruction for Accurate Detection To further improve the detection performance, we proposed a dense reconstruction mechanism for generating dense predictions, which is free from the inner stride constraint of FCN. The inner stride of FCN structure is restricted to the number of its pooling layers, e.g., ScanNet modified from VGG-16 with 5 pooling layers is equivalent to patch-wise CNN network with stride 25 = 32. Hence, the deeper network with the more pooling layers, the sparser probability map is generated. This makes it difficult to balance the tradeoff between the deep structure and dense predictions. We observed that shifting an ROI by certain offsets, we can catch the views missed in the interval of the FCN inner stride, shown in Figure 4. Motivated by this, we propose to integrate these missed views to reconstruct a denser and more precise one. This procedure is quite different from the interpolation mechanism, as demonstrated 542
Table 2. The details of Camelyon16 dataset
� �
Sources Radboud UMC Utrecht UMC Total
� ����
��!"�
��$#�
Train Normal Train 100 70 60 40 160 110
Test Normal Train 80
50
80
50
to (c). The fetched stride of ROIs, denoted as Sr , should satisfy rules in Eq. (1) as the following rewritten constraint: Sr = Sd ∗ Ld , where Ld is the side length of the DPTs. Thus, we can simply stitch the DPTs non-overlapped as usual without any changes in the previous design of the size Lr and stride Sr of ROIs. The positional relationship (height H for example and the width W can be formulated in the similar way) between the stitched probability map and the original WSI can be determined by following:
��!��
����� �� ��������������� ����� ����� �� ���� ������� ���� ��! � �
����������������������������������������� ����
Figure 4. The reconstruction of dense prediction by offset probability tiles (OPTs). The black rectangles are two neighbour patches belonging to a certain ROI. By offsetting the patch (red rectangle) accordingly, we can catch the missing view in the interval of FCN stride. The red value is the patch prediction after offset, which is different from the blue value generated by interpolation.
HI = HP ∗ Sd + Lf /2
(4)
where HI is the index of original WSI space, HP is the index of the stitched probability map, and Lf is the inner input size of the ScanNet. Finally, we post-processed the image by morphology opening operations to remove the small outliers. For the localization task, each connected component in the binarized probability map (threshold was set as 0.5 emperically in our experiments) was considered as a detection, with score equal to the maximum probability within the region. For the WSI classification task, the prediction was simply computed as the maximal score within the slide without any sophisticated post-processing procedures.
in Figure 4. The inputs of dense probability tiles (DPTs) for reconstruction are the probability tiles generated from an ROI given certain offsets, referred as offset probability tiles (OPTs). The OPTs pij are generated by a well trained ScanNet F given a certain ROI image Ir and its offset vectors → − O ij , as illustrated in Figure 3 (bottom). We define the ratio between the size of DPTs and the size of OPTs as dense coefficient α and the OPTs can be formulated as: � → − pij = F(Ir , O ij ) (2) → − O ij = (i ∗ Sd , j ∗ Sd ), i, j�[0, 1, ..., α − 1] → − where O ij is determined by the inner stride Sd of DPTs after reconstruction and inner stride Sf of OPTs before reconstruction, where Sd = Sf /α and Sf = 25 , i.e., 5 pooling layers with a stride 2 in each layer in our ScanNet. Then we can calculate the DPTs by interweaving the OPTs alternatively. Suppose that (h� , w� ) are the coordinates of a position in a DPT p, the probability of p(h� , w� ) can be calculated as: ⎧ � � ⎪ ⎨ p(h , w ) = pij (h, w) � (3) i = h mod α, j = w� mod α ⎪ ⎩ � � h = �h /α� , w = �w /α� .
3. Experiments and Results 3.1. Dataset We evaluated our method on the benchmark dataset of ISBI 2016 Camelyon16 [3]. The challenge consists of two tasks: tumor region localization and WSI classification. The data of Camelyon16 challenge contains a total of 400 whole-slide images of sentinel lymph node from two independent datasets collected in Radboud University Medical Centre (Radboud UMC) and the University Medical Centre Utrecht (Utrecht UMC). The details of datasets are illustrated in Table 2. The training data totally contained 160 normal WSIs and 110 tumor WSIs with pixel-level annotations provided by experienced pathologists. The testing data with 130 WSIs were employed for performance evaluation.
For instance, the Sf = 32 is the inner stride of ScanNet before reconstruction. If dense coefficient α = 2 (i.e., Sd = 16), we should generate four OPTs (p00 , p01 , p10 , p11 ) from the Ir based on four offset vectors ((0, 0), (0, 16), (16, 0), (16, 16)). After obtaining the set of DPTs with reconstruction, we stitch them together to generate the final probability map, as illustrated in Figure 3 (b)
3.2. Implementation Details Our framework was implemented utilizing TensorFlow library on the workstation equipped with one 12 GB 543
Table 3. Quantitative comparison with other methods
����
Methods
����
Figure 5. Typical examples of metastasis detection results from our proposed method. Top: ground truth annotations from pathologists indicated by the yellow lines. Bottom: Our detection results overlaid on the original images with different colors.
Geforce GTX TITAN X GPU. We trained our ScanNet in two stages, i.e., general sample learning and hard negative sample learning. Batch size was set as 75 at each iteration to make the most of GPU memory. In the first learning stage, without hard negative samples, the ScanNet was initialized with VGG-16 model pre-trained from ImageNet. In the second learning stage, we started to finetune our model from time to time by enlarging and re-training on the hard negative samples iteratively.
FROC score
AUC score
Human performance ScanNet-16(ours) HMS and MIT HMS, Gordan Center, MGH Radboud Uni. (DIAG) EXB Research co. Middle East Tech. Uni. University of Toronto DeepCare Inc NLP LOGIX co. USA
0.7325 0.8533 0.8074 0.7600 0.5748 0.5111 0.3889 0.3822 0.2439 0.3859
0.9660 0.9875 0.9935 0.9763 0.7786 0.9156 0.8642 0.8149 0.8833 0.8298
ScanNet-32(w/o HNM) ScanNet-32
0.7030 0.8133
0.9415 0.9669
3.5. Quantitative Evaluation and Comparison In order to probe the efficacy of our method, we first evaluate our ScanNet under different configurations. We set the α as 1 and 2 to produce the dense predictions in our ScanNet and call them “ScanNet-32” and “ScanNet-16”, respectively. Note that generally larger α means denser predictions can be generated from the network. It is observed in Table 3 that the results of ScanNet-16 is much better than that of ScanNet-32, demonstrating denser framework can give a better predictions on the metastasis, especially micro and ITC cases. We further evaluate the performance of ScanNet-32 with and without hard negative mining strategy and the results are listed in the last two rows of Table 3. The performance of ScanNet-32 utilizing the hard negative mining strategy significantly outperforms its counterpart without the strategy on all metrics. This demonstrates the efficacy of hard negative mining strategy to tackle the severe class imbalance problem with enormous negative samples which commonly happens in the field of medical image analysis.
3.3. Evaluation Metrics The challenge consists of two tasks, i.e., tumor region localization and WSI classification. The first task is evaluated based on Free Response Operating Characteristic (FROC) curve [4]. The FROC score is defined as the average sensitivity at 6 predefined false positive rates: 1/4, 1/2, 1, 2, 4 and 8 false positives per scan. The second task is evaluated using the AUC score, i.e., area under the Receiver Operating Characteristic (ROC) curve [32].
3.4. Qualitative Evaluation We illustrate typical examples of metastasis detection results from our method in Figure 5, from which we can observe the high consistency between our heat map and annotations from experienced pathologists. The first and second column in Figure 5 are the typical macro metastases with diameter larger than 2mm. We observe that our heat maps are highly consistent with the annotations of pathologists. The third and fourth column in Figure 5 contain the typical micro metastases and isolated tumour cells (ITCs) with diameter smaller than 2mm or 0.2mm respectively. We observe that our heat maps are also highly sensitive to such micro cases and ITCs with sparse spreading. These qualitative results indicate that our method can robustly and accurately process the metastases in different sizes, especially performing well in challenging cases of micro and ITC metastases.
We also compared our method with several state-of-theart methods as shown in Table 3, and Figure 6 presents the FROC and ROC curves from different methods. In the tumor localization task, our method achieved the best performance among all the methods, with the highest FROC score of 0.8533 outperforming the runner-up team [27] by a significant margin of 4.6%. It is worth noting that our performance surpassing the human performance of 0.7325 from the pathologists more than 12%. For the WSI classification task, our AUC score was 0.9875 with simple postprocessing on tumor localization probability map, also surpassing human performance of 0.9660 from the pathologists, and quite competitive with the leading method of 0.9935 [27]. 544
Table 4. Efficiency comparison with others (unit: minute) Network (team)
stride 32
stride 16
ScanNet (ours) GoogleNet (HMS and MIT) ResNet-34 (EXB Research co.) AlexNet (NLP LOGIX co. ) VGG16 (patch-wised)
0.018 0.668 0.724 0.334 0.975
0.073 2.673 2.896 1.337 3.899
minutes, respectively. In comparison with the huge computational cost in patch-wise based methods, our method makes it possible for automatic WSI analysis in real clinical practice.
����
4. Conclusions In this paper, we have presented a novel framework by leveraging fully convolutional networks for efficient inference, while reconstructing dense predictions for ensuring accurate detection on both micro- and macro-metastases. Incorporating with the strategies including asynchronous sample prefetching and hard negative mining, the network can be effectively trained. Extensive experiments on the benchmark dataset of 2016 Camelyon Grand Challenge corroborated that our method achieved superior performance with a faster speed on the tumor localization task and even surpassed human performance on the WSI classification task. Future investigations include evaluating our method on large-scale histology WSIs and promoting its application in clinical practice.
���� Figure 6. Evaluation Results. (a): FROC curves of tumor localization task of different methods. (b): ROC curves of WSI classification task of different methods.
Acknowledgments The work described in this paper was supported by a grant from the Hong Kong Innovation and Technology Commission (Project No. ITS/041/16).
3.6. Time performance
References
In order to evaluate the computation cost, we also compared the time performance of our method with the topranking methods with single GPU. The efficiency is evaluated by measuring the time cost on an approximately 2800 × 2800 sized ROI with scanning stride 32 and 16 (corresponding to dense coefficient α = 1 or 2 of ScanNet). Compared with the patch-wised VGG16, the ScanNet only takes 0.018 minutes to process the ROI with stride 32, about 50 times faster than its patch-wised baseline. Based on the specifications from different teams, we reimplemented the methods and compared them under the same configuration (prediction at level-0 with the same strides and hardware settings). It is demonstrated that our ScanNet is dozens of times faster than the patch-wise based on frameworks including GoogleNet by HMS and MIT team, ResNet-34 by EXB Research co. team, and AlexNet by NLP LOGIX co. team, which generally take about 0.668, 0.724, and 0.334
[1] P. Bartels, D. Thompson, M. Bibbo, and J. Weber. Bayesian belief networks in quantitative histopathology. Analytical and quantitative cytology and histology/the International Academy of Cytology [and] American Society of Cytology, 14(6):459–473, 1992. [2] A. Basavanhally, E. Yu, J. Xu, S. Ganesan, M. Feldman, J. Tomaszewski, and A. Madabhushi. Incorporating domain knowledge for tubule detection in breast histopathology using ocallaghan neighborhoods. In SPIE Medical Imaging, volume 7963, page 796310. International Society for Optics and Photonics, 2011. [3] B. E. Bejnordi, M. Veta, P. J. van Diest, B. van Ginneken, N. Karssemeijer, G. Litjens, J. A. van der Laak, M. Hermsen, Q. F. Manson, M. Balkenhol, et al. Diagnostic assessment of deep learning algorithms for detection of lymph node metastases in women with breast cancer. Jama, 318(22):2199– 2210, 2017. 545
[4] D. P. Chakraborty. Maximum likelihood analysis of freeresponse receiver operating characteristic (froc) data. Medical physics, 16(4):561–568, 1989. [5] H. Chen, Q. Dou, X. Wang, J. Qin, and P. A. Heng. Mitosis detection in breast cancer histology images via deep cascaded networks. In Thirtieth AAAI Conference on Artificial Intelligence, 2016. [6] H. Chen, X. Qi, L. Yu, Q. Dou, J. Qin, and P.-A. Heng. Dcan: Deep contour-aware networks for object instance segmentation from histology images. Medical Image Analysis, 36:135–146, 2017. [7] H. Chen, Y. Zheng, J.-H. Park, P.-A. Heng, and S. K. Zhou. Iterative multi-domain regularized deep learning for anatomical structure detection and segmentation from ultrasound images. In International Conference on Medical Image Computing and Computer-Assisted Intervention, pages 487–495. Springer, 2016. [8] D. C. Cires¸an, A. Giusti, L. M. Gambardella, and J. Schmidhuber. Mitosis detection in breast cancer histology images with deep neural networks. In MICCAI, pages 411–418. Springer, 2013. [9] E. Cosatto, M. Miller, H. P. Graf, and J. S. Meyer. Grading nuclear pleomorphism on histological micrographs. In Pattern Recognition, 2008. ICPR 2008. 19th International Conference on, pages 1–4. IEEE, 2008. [10] Q. Dou, L. Yu, H. Chen, Y. Jin, X. Yang, J. Qin, and P. A. Heng. 3d deeply supervised network for automated segmentation of volumetric medical images. Medical Image Analysis, 41:40, 2017. [11] S. B. Edge and C. C. Compton. The american joint committee on cancer: the 7th edition of the ajcc cancer staging manual and the future of tnm. Annals of surgical oncology, 17(6):1471–1474, 2010. [12] H. Fatakdawala, J. Xu, A. Basavanhally, G. Bhanot, S. Ganesan, M. Feldman, J. E. Tomaszewski, and A. Madabhushi. Expectation–maximization-driven geodesic active contour with overlap resolution (emagacor): Application to lymphocyte segmentation on breast cancer histopathology. IEEE Transactions on Biomedical Engineering, 57(7):1676–1689, 2010. [13] A. Goode, B. Gilbert, J. Harkes, D. Jukic, and M. Satyanarayanan. Openslide: A vendor-neutral software foundation for digital pathology. Journal of pathology informatics, 4, 2013. [14] M. N. Gurcan, L. E. Boucheron, A. Can, A. Madabhushi, N. M. Rajpoot, and B. Yener. Histopathological image analysis: a review. Biomedical Engineering, IEEE Reviews in, 2:147–171, 2009. [15] P. Hamilton, N. Anderson, P. Bartels, and D. Thompson. Expert system support using bayesian belief networks in the diagnosis of fine needle aspiration biopsy specimens of the breast. Journal of clinical pathology, 47(4):329–336, 1994. [16] G. Humphreys and A. Ghent. World laments loss of pathology service. Bulletin of the World Health Organization, 88(8):564–565, 2010. [17] C. Jung, C. Kim, S. W. Chae, and S. Oh. Unsupervised segmentation of overlapped nuclei using bayesian classi-
[18] [19]
[20]
[21]
[22]
[23]
[24]
[25]
[26]
[27]
[28]
[29]
[30] [31]
[32]
546
fication. IEEE Transactions on Biomedical Engineering, 57(12):2825–2832, 2010. N. Otsu. A threshold selection method from gray-level histograms. Automatica, 11(285-296):23–27, 1975. X. Qi, F. Xing, D. J. Foran, and L. Yang. Robust segmentation of overlapping cells in histopathology specimens using parallel seed detection and repulsive level set. IEEE Transactions on Biomedical Engineering, 59(3):754–765, 2012. O. Ronneberger, P. Fischer, and T. Brox. U-net: Convolutional networks for biomedical image segmentation. In MICCAI, pages 234–241. Springer, 2015. L. Roux, D. Racoceanu, N. Lom´enie, M. Kulikova, H. Irshad, J. Klossa, F. Capron, C. Genestie, G. Le Naour, and M. N. Gurcan. Mitosis detection in breast cancer histological images an icpr 2012 contest. Journal of pathology informatics, 4, 2013. K. Simonyan and A. Zisserman. Very deep convolutional networks for large-scale image recognition. arXiv preprint arXiv:1409.1556, 2014. K. Sirinukunwattana, J. P. Pluim, H. Chen, X. Qi, P.-A. Heng, Y. B. Guo, L. Y. Wang, B. J. Matuszewski, E. Bruni, U. Sanchez, et al. Gland segmentation in colon histology images: The glas challenge contest. Medical image analysis, 35:489–502, 2017. A. Tabesh, M. Teverovskiy, H.-Y. Pang, V. P. Kumar, D. Verbel, A. Kotsianti, and O. Saidi. Multifeature prostate cancer diagnosis and gleason grading of histological images. Medical Imaging, IEEE Transactions on, 26(10):1366–1378, 2007. M. Veta, P. J. Van Diest, S. M. Willems, H. Wang, A. Madabhushi, A. Cruz-Roa, F. Gonzalez, A. B. Larsen, J. S. Vestergaard, A. B. Dahl, et al. Assessment of algorithms for mitosis detection in breast cancer histopathology images. Medical image analysis, 20(1):237–248, 2015. J. Vink, M. Van Leeuwen, C. Van Deurzen, and G. De Haan. Efficient nucleus detector in histopathology images. Journal of microscopy, 249(2):124–135, 2013. D. Wang, A. Khosla, R. Gargeya, H. Irshad, and A. H. Beck. Deep learning for identifying metastatic breast cancer. arXiv preprint arXiv:1606.05718, 2016. J. Xu, A. Janowczyk, S. Chandran, and A. Madabhushi. A weighted mean shift, normalized cuts initialized color gradient based geodesic active contour model: applications to histopathology image segmentation. In Medical Imaging: Image Processing, page 76230Y, 2010. J. Xu, L. Xiang, Q. Liu, H. Gilmore, J. Wu, J. Tang, and A. Madabhushi. Stacked sparse autoencoder (SSAE) for nuclei detection on breast cancer histopathology images. 2015. Z. Xu and J. Huang. Detecting 10,000 cells in one second. In MICCAI, pages 676–684. Springer, 2016. Y. Zhou, Q. Dou, H. Chen, J. Qin, and P.-A. Heng. Sfcnopi: Detection and fine-grained classification of nuclei using sibling fcn with objectness prior interaction. arXiv preprint arXiv:1712.08297, 2017. M. H. Zweig and G. Campbell. Receiver-operating characteristic (roc) plots: a fundamental evaluation tool in clinical medicine. Clinical chemistry, 39(4):561–577, 1993.