International Journal of Digital Information and Wireless Communications (IJDIWC) 2(1): 75-81 The Society of Digital Information and Wireless Communications, 2012 (ISSN 2225-658X)
SOURCE SEPARATION FROM SINGLE CHANNEL BIOMEDICAL SIGNAL BY COMBINATION OF BLIND SOURCE SEPARATION AND EMPIRICAL MODE DECOMPOSITION N. Abdolmaleki1 and M. Pooyan2 1
Department of Electrical Engineering, Islamic Azad University, Qazvin, Iran 2 Deprtment of Electrical Engineering, Shahed University, Tehran, Iran
[email protected] [email protected] Abstract-These days, Blind Source Separation (BSS) techniques are the most common and beneficial method, in signal processing. In the field of multichannel recording, over the past years, many techniques of BSS are introduced which can work accurately, in contrast to the multichannel recording, in the single channel measurement, only a few methods are existed. One of the much popular algorithms of BSS is Independent Component Analysis (ICA) which applies to separate the independent components from multi channel measurements. In this paper, we proposed two new algorithms to separate the mixed sources in single channel recording. We named our methods: Automated EE-ICA and EE-ICA with post processing; these methods are based on composing the Empirical Mode Decomposition (EMD) and ICA in a new manner. EMD is a technique for splitting up the single channel signal into its components. We will investigate the performance of our methods in the field of biomedical signals. Keywords: Empirical Mode Decomposition, Blind Source Separation, Independent Component Analysis, Single channel signal analysis.
1 INTRODUCTION Generally speaking, in single-channel signal processing, only one Mixed signal is available, which is mixed of several sources, the number of methods are reported in this field, for example SingleChannel ICA (SCICA) that proposed in [8] and Wavelet-ICA [9]. ICA is a multichannel technique [1]. In the biomedical signal processing if the number of channels (mixed signals) are more than or equal to the sources, ICA algorithm and several techniques of BSS are suitable, but when the number of sources are higher than the number of channels, only a group
of algorithms called "undetermined ICA" can recover these sources. SCICA is the adaption of ICA to single channel signal analysis. This algorithm is sat up on two hypotheses: the sources are stationary and disjoint in the frequency domain. Actually, these assumptions are limitations of SCICA to apply it, because these hypotheses are not true in all of the applications. Wavelet-ICA combines Wavelet transform and ICA for singlechannel signal analysis. At first, wavelet transform is performed to segment the mixed signal at each step in the predetermined path by predefined linear time invariant filters and then the ICA method is applied for extracting the independent sources. In [2] another approach for splitting up a signal into different signals is introduced. This approach is EMD. EMD is an adaptive algorithm. It hasn’t the limitations of two already methods for splitting the signal. EMD is an adaptive instrument for decomposing a signal into its component that is called Intrinsic Mode Function (IMF). Combining EMD and ICA algorithms is one of the approaches for extracting the sources from single channel recording. In this course first EMD splits up the mixed signal into its components and then ICA applied to these components to extract the independent sources. EMD is similar to Wavelet, but it is a data-driven and adaptive algorithm, which decomposes a signal without a priori knowledge about it and this property, gives the possibility of adapting the decomposition to local variations of the oscillation, to sum up, EMD-ICA outperforms rather than W-ICA. EMD is high sensitive to noise; this is the shortage 75
International Journal of Digital Information and Wireless Communications (IJDIWC) 2(1): 75-81 The Society of Digital Information and Wireless Communications, 2012 (ISSN 2225-658X)
of this method. Therefore, in the case of implementation that the rate of noise is high, EMD can't work perfect especially when the signal of interest is oscillation type. A more powerful noise-assisted version of EMD is EEMD [3]. In this paper, we used EEMD and Fast ICA to extract the signals. The paper is set as follows. In the section 2 at first the based algorithms are described, then our suggested algorithms are elaborated, in section 3 we will investigate our methods performance and power in two simulations in MATLAB program. 2 ALGORITHMS AND METHODES 2.1 Empirical Mode Decomposition EMD is a powerful method which can decompose the nonlinear and nonstationary signal into its component, adaptively. As mentioned in introduction, these components are called IMFs. IMFs must be valid under these conditions: 1) the number of maximum and minimum of IMF and its zerocrossing must be the same or only differ one point at most in the whole data set 2) the mean of upper and under envelope which respectively defined by the maximum and minimum must be equal to zero. As said, EMD is high sensitive to noise and this is main disadvantage of this algorithm. In the high noisy application and also specially in the case that, the mixed signal is a mixture of low frequency signal and intermittent high frequency oscillations riding on it, one of the issues rampant, is Mode mixing. Mode mixing problem had noticed in [4] at first.This problem and some presented solution of it is described in [3, 4, 5] EEMD is a noise-assisted data analysis method [3]. In this method, the rate of Mode mixing problem is so less than EMD. When the rate of noise is very high, this algorithm is more forceful than EMD. In the first step of EEMD algorithm, an independent, identically distributed and zeromean white noise by SD (Standard
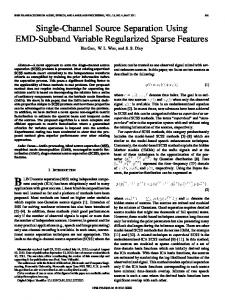
Deviation) equal to Np (Noise parameter) times of the SD of the original signal is added to it, in the next step, EMD is applied to drive a set of IMFs, then these steps are repeated for a number of trails to conclude the ensemble of IMF sets and finally it should be averaged over the ensemble to receive a set of average. 2.2 Independent Component Analysis The mixing process of the sources in BSS algorithms is categorized into two major groups: convolutive mixing model and instantaneous mixing model. ICA is inhabited in the instantaneous mixing model domain. Combination of source signals in the instantaneous model had a linear equation X=AS, in this model X is the mixed signals matrix, A is mixing matrix and S is the sources which is named independent components (IC's). In this paper, we apply FastICA algorithm [1], this algorithm is established on nonGaussianity of the sources. 2.3 Automated EE-ICA Figure1 shows all steps of Automated EEICA algorithm, in a block diagram format. Algorithm performs as follow: in first step, EEMD algorithm splits up the single channel mixed signal into its IMF set, then in a automatic procedure based on the amplitude-frequency spectrum, the noisy IMFs are omitted, after that, FastICA is performed on all the remained IMFs, for extracting the ICs. After this step, similar to noisy IMF cancelation step, the noisy
Figure1. Automated EE-ICA algorithm's block diagram
ICs are deleted, consequently remained ICs multiply to their corresponding rows of mixing matrix A, and the new IMFs sum together to extract the signal of interest. 76
International Journal of Digital Information and Wireless Communications (IJDIWC) 2(1): 75-81 The Society of Digital Information and Wireless Communications, 2012 (ISSN 2225-658X)
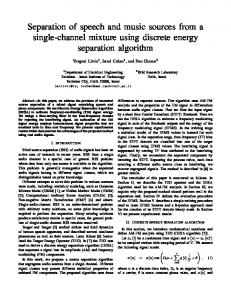
2.4 EE-ICA with post processing Another approach is suggested in this paper is EE-ICA with post processing. In this method, at first, we perform EEMD on mixed signal to obtain the IMF sets, then in a automatic way, all of the IMFs go forward to the next step, which is: performing FastICA on IMF sets and extracting the ICs, after that, one of the ICs which its amplitude-frequency spectrum is much similar to the signal of interest is picked up and at last, the selected IC is filtered for post processing. In figure2 we show this algorithm's block diagram.
and noise ratio, NSR is defined by equation (3) NSR=
(
( ))
( ( ))
(3)
In this equation S(t) is the signal of interest and N(t) is the noise signal which mixed by S(t) and λ is the ratio of noise that alters the NSR value. NSR and Np are 1 and 2 respectively. In both simulations, at first, we compare the EMD and EEMD algorithm's performance in single channel signal's splitting up.
Figure2. EE-ICA with post processing algorithm's block diagram
3 SIMULATIONS In the simulation the noise parameter is equal to 2 in EEMD algorithm. In the | | FastICA we select ( ) = × , ≠ 2 for distribution of the sources. We select the record No.103 of the MITBIH database for ECG signal, EMG Healthy database for EMG signal, and EEG Motor Movement-Imagery Dataset for EEG signal, from Physionet web site. Figure3 shows our source signals those used in this paper. We use RRMSE to state our methods performance accuracy in this paper, Relative Root Mean Square Error (RRMSE) defines by equation (1). In this equation S (t) is estimated signal. RRMSE =
RMS(S(t) − S (t)) × 100 (1) RMS(S(t))
RMS is Root Mean Square, the RMS value for a sequence x is defined as follows: RMS{x} =
1 N
x[n] (2)
N is the number of samples of x[n]. In addition, we use NSR to express the signal
Figure3. Sources signals those used in this paper, from top to down: EEG, simulated epilepsy activity, ECG and EMG signals, respectively.
3.1 Source separation with Automated EE-ICA In the first simulation we mixed an EEG signal with a sinusoidal wave by 160 Hz sampling frequency, sinusoidal wave is representative of epileptic activity, in this simulation our interested signal for extracting is the stationary oscillatory type sinusoidal signal. To contrast the performance of EMD and EEMD and also to prove the power of EEMD in the case of high noisy application, we show Figure4, that illustrates the EMD algorithm's IMFs. As mentioned, the more NSR, the more sensitivity of EMD to noise, and consequently mode mixing appears. Obviously, mode mixing exists in the most
77
International Journal of Digital Information and Wireless Communications (IJDIWC) 2(1): 75-81 The Society of Digital Information and Wireless Communications, 2012 (ISSN 2225-658X)
of IMFs especially in IMF4. Figure5 shows the EEMD decompositions of the mixed signal and their amplitudefrequency spectrums. Unquestionably, in contrast to the EMD's IMFs, in EEMD, mode mixing is really decreased, for example in IMF4, mode mixing is almost removed.
provided that, its maximum value of amplitude is more than 50% of maximum value of originally sinusoidal wave's amplitude and the frequency of it not less or more than 50% of maximum amplitude's frequency value of original signal. If the IC doesn't right in these conditions, will be deleted. In this simulation, only, IC1 and IC4 are valid. After selecting the ICs by inversing ICA and EEMD, the signal is recovered.
Figure4. EMD decomposition of the signal mixed of EEG and epilepsy activity (sinusoidal) in NSR=1. Figure6. The extracted ICs and their spectrum by EE-ICA in first simulation for NSR=1.
Figure5. EEMD decomposition of the signal mixed of EEG and epilepsy activity (sinusoidal) and their spectrum in NSR=1.
To remove the noisy IMFs, because of our oscillatory wave's frequency is equal to 4, the number of IMFs those their frequency range is higher than 20Hz are omitted, and then FastICA is performed on the remained IMFs. Figure6 illustrates the extracted ICs and their amplitudefrequency spectrum. In IC selection two factors are used, the maximum value of amplitude and its frequency's value. By an appropriate choice of the threshold value for these factors, ICs are selected. For example in this simulation we select the IC
In the second simulation we composed two real life signals: ECG with EMG signal, by 360 Hz sampling frequency to extract a spike type (ECG) signal. The EMG signal is noise, and we want to extract the spike type signal, ECG. Figure7 and 8 illustrate EMD and EEMD decompositions of the mixed signal and for second simulation. Because of EMD's sensitivity to noise, the spikes of ECG signal which is original property of this signal, is almost eliminated; but in EEMD decomposition these spikes are existed in IMF3, IMF 4, IMF 5 and IMF 6, significantly. Figure9 shows amplitude-frequency spectrums of EEMD's IMF set. Figure10 shows the interested ECG signal and its spectrum, the frequency range of ECG is between 0-50 Hz, therefore in this step the number of IMFs, those their frequency range are more, are deleted; and remained IMFs (4-10) go to FastICA. Figure11 illustrates the separated sources and their
78
International Journal of Digital Information and Wireless Communications (IJDIWC) 2(1): 75-81 The Society of Digital Information and Wireless Communications, 2012 (ISSN 2225-658X)
The Np parameter is too essential in EEMD. We investigate our method's
Figure7. EMD decomposition of the signal mixed of ECG and EMG signals in NSR=1. Figure11. The extracted ICs and their spectrum by Automatic EE-ICA in second simulation for NSR=1.
Figure8. EEMD decomposition of the signal mixed of ECG and EMG signals in NSR=1.
NSR
RRMSE , if Np=0.2
RMSE , if Np=2
0.05
4.8958
12.315
0.5
18.3256
18.848
1
32.59
31.579
1.5 2
33.1799
40.7664
53.7631
45.41126
Table1. RRMSE values of the extracted signal (output) of the Automated EE-ICA algorithm in different levels of added noise for first simulation. NSR
Figure9. The spectrums of the EEMD signals in NSR=1.
RRMSE , Nnp=0.2
RRMSE , Np=2
0.05
14.8951
13.3339
0.5
43.9791
35.1739
1
59.9529
58.24
1.5
84.6399
73.3290
2
91.3255
80.8701
Table2. RRMSE values of the extracted signal (output) of the EE-ICA algorithm in different levels of added noise for second simulation.
Figure10. The interested ECG signal and its spectrum
spectrums. All of the sources remain, because their frequency ranges are in 0-50 Hz. In selecting the IC or IMF, in this signal, which has a frequency rang instead of one frequency; our choices are based on frequency range.
performance for two values of Np, 0.2 and 2 the results are expressed in Table1 and Table 2 for first and second simulation consecutively in RRMSE format. as mentioned in [3] and shown in the tables, when signal is low frequency with low values of Np, and when the signal is high frequency with large values of Np, the error will be reduced, and in some cases those the noise ratio is high by large amount of Np, EEMD has good answer.
79
International Journal of Digital Information and Wireless Communications (IJDIWC) 2(1): 75-81 The Society of Digital Information and Wireless Communications, 2012 (ISSN 2225-658X)
Figures 12, 13, 14 and 15 show the extracted signal of the Automated EE-ICA algorithm in Np=0.2, 2, and NSR=0.05, 0.5, 1, 1.5, 2 for first and second simulation, respectively.
Figure15. The extracted signal (output) of the Automated EE-ICA algorithm for second simulation in Np=2 and for NSR=0.05, 0.5, 1, 1.5 and 2 from up to down, respectively. Figure12. The extracted signal (output) of the Automated EE-ICA algorithm for first simulation in Np=0.2 and for NSR=0.05,0.5,1,1.5 and 2 from up to down, respectively
Figure13. The extracted signal (output) of the Automated EE-ICA algorithm for first simulation in Np=2 and for NSR=0.05, 0.5, 1, 1.5 and 2 from up to down, respectively.
Figure16. The extracted ICs by EE-ICA with post processing in first simulation for NSR=1.
Figure17. IC 4 and its spectrum
Figure14. The extracted signal (output) of the Automated EE-ICA algorithm for second simulation in Np=0.2 and for NSR=0.05, 0.5, 1, 1.5 and 2 from up to down, respectively.
3.2 Source separation with EE- ICA with post processing EE-ICA with post processing is our another
algorithm. The weakness of this algorithm is its performance in the case of high
Figure18. Bandpass filter for EE-ICA with post processing.
Figure19. The extracted source of first simulation by for EE-ICA with post processing algorithm
frequency signals especially when the noise ratio is high but when the signal of interest to extract is low frequency even if 80
International Journal of Digital Information and Wireless Communications (IJDIWC) 2(1): 75-81 The Society of Digital Information and Wireless Communications, 2012 (ISSN 2225-658X)
the noise ratio is high this algorithm works appropriately. Here we simulate sinusoidal signal with EEG background. Figure 17 illustrates the extracted sources those obtained by applying EEMD and FastICA on the mixed signal by NSR=1, as shown in figure18 the IC4 is selected for filtering step. Figure19 shows the passband filter that used for post processing, filter's band wide is 2-20 Hz, after applying filter on IC4, the source of interest is extracted with RRMSE=31.6636. Figure20 shows the signal.
[3]
[4]
[5]
[6]
4 CONCLUSION In this paper, we suggested two new algorithms to separate the sources from single channel measurements, based on EMD and ICA, and investigated our algorithm's performance in two simulations. The combination of EMD and ICA is used before (see, e.g, [6] and [7]). In [7] the authors combined EMD and Infomax ICA to separate the mixed signal, and in [7] EEMD and FastICA are combined to extract the single channel signal. Our Automated EE-ICA method is established on combination of EEMD and FastICA algorithms to extract the single channel signal, in automatic path based on the spectrum of the component, and has two step of noisy component cancelation, one step is performed after applying EEMD on Mixed signal and another, is performed after applying FastICA on IMFs. In our EE-ICA with post processing method, without noise cancelation step and in a fully automatic way, by filtering for post processing, the sources are extracted. Our methods are automatic and run in MATLAB program.
[7] [8]
[9]
series analysis Proc. Royal Soc. London, vol. 454A, pp. 903--993, (1998). Wu, Z., Huang, N. E.: Ensemble empirical mode decomposition: A noise-assisted data analysis method, Adv. Adaptive Data Anal., vol. 1, pp. 1--41, (2009). N. E. Huang, Z. Shen and R. S. Long, A new view of nonlinear water waves — the Hilbert spectrum, Ann. Rev. Fluid Mech. 417--457, (1999). Yunchao, G. Ge, Guangtao, G., Zhengyan, Sh., Enfang, S.:Analysis and solution to the Mode Mixing Phenomenon in EMD. Image and Signal Processing, Vol. 5, pp. 223 -- 227, (2008). Mijovic, B., Vos M.D., Gligorijevic, I., Taelman, J., Huffel, S.V.: Source Separation From Single-Channel Recordings by Combining Empirical-Mode Decomposition and Independent Component Analysis, IEEE Transactions on biomedical engineering, vol. 57, pp.2188-2196, September(2010). Hongyan, X., Jinyong, H.: A noise elimination method for ECG signals, IEEE (2009). Davies1, M. E., James, C. J.: Source separation using single channel ICA, Signal Process., vol. 87, pp. 1819--1832,( 2007). Lin, J., Zhang, A.,: Fault feature separation using wavelet-ICA filter, NDT & E Int., vol. 38, pp. 421--427, (2005).
REFERENCES [1] Hyvarinen, A., Oja, E.: Independent Component Analysis: Algorithms and Applications. Neural Networks 13, 411—430 (2000) [2] Huang, N. E.,Wu M. L., Long, S. R., Shen, S. S., Qu, W. D., Gloersen, P., Fan, K. L.: The empirical mode decomposition and the hilbert spectrum for nonlinear and non-stationary time 81