association rule mining method on massive sales transaction data. In this paper, ... A data matrix required by association analysis becomes very large when.
Time Series Clustering: A Superior Alternative for Market Basket Analysis Swee Chuan Tan, Jess Pei San Lau SIM University, School of Business 535A Clementi Road, Singapore {jamestansc, pslau002}@unisim.edu.sg
Abstract. Market Basket Analysis often involves applying the de facto association rule mining method on massive sales transaction data. In this paper, we argue that association rule mining is not always the most suitable method for analysing big market-basket data. This is because the data matrix to be used for association rule mining is usually large and sparse, resulting in sluggish generation of many trivial rules with little insight. To address this problem, we summarise a real-world sales transaction data set into time series format. We then use time series clustering to discover commonly purchased items that are useful for pricing or formulating cross-selling strategies. We show that this approach uses a data set that is substantially smaller than the data to be used for association analysis. In addition, it reveals significant patterns and insights that are otherwise hard to uncover when using association analysis.
1 Introduction Association analysis is sometimes known as affinity analysis or more specifically, association rule mining [1]. It is a method commonly used for Market Basket Analysis. In retail, Market Basket Analysis helps the retailer to find commonly purchased products so as to identify cross-selling opportunities, optimise store layout, and manage inventory [4, 8]. While association rule mining is currently the standard method for Market Basket Analysis, we argue that it is not always the most suitable method for analysing big market-basket data. When there is a large volume of sales transactions with high number of products, the data matrix to be used for association rule mining usually ends up large and sparse, resulting in longer time to process data as well as generation of trivial rules with little insight. One possible solution to the above problems is to apply clustering on sales transaction data formatted as time series. Clustering of time series sales data may be a superior alternative (to association analysis) for Market Basket Analysis because of the following reasons: A data matrix required by association analysis becomes very large when there are many sales transactions and products. The data matrix also
becomes sparse when each transaction involves the sales of only a few products. On the other hand, time series clustering of sales transactions requires data to be summarised as time series, which can result in a substantially smaller data set that requires less time to process. Time series clustering can be used to identify products that are commonly purchased across a certain time period. Such patterns are otherwise hard to discover using association rule mining, which analyses transactions without temporal consideration.
So, why should clustering work? Our intuition is that the sales quantities of any two commonly purchased products should be positively correlated. When the sales quantities of these two products are observed over different time points, the time series of the sales quantities should be similar in their upwards and downwards temporal patterns. When clustering is applied, these two time series should be assigned to the same cluster. Conceptually, each cluster contains a set of items analogous to an itemset in association rule mining. In this paper, we present a practical case of applying Market Basket Analysis on a real-world sales transaction data set using time series clustering, rather than using association rule mining. We find that time series clustering requires a very small data set that is a fraction of the size of data matrix required by association analysis. Yet, the clustering process helps to discover many sets of complementary parts, where each set of parts are used to make the same product. Such information is useful for cross-selling and pricing. Furthermore, the time series patterns can also be analysed to provide useful information for inventory control. The rest of this paper is organised as follow. Section 2 reviews related work. Section 3 discusses a real-world case where Market Basket Analysis can be performed using time series clustering of sales data. Section 4 presents the results and discusses the insights gained. Finally, Section 5 concludes this paper and discusses implications of our work on future research directions.
2 Related Work Most existing applications of Market Basket Analysis involve applying association rule mining on sales transaction records. The most popular story (or fable) about such applications is the unexpected discovery that diapers being commonly purchased with beer in the retail sector [8]. In the following, we review some existing applications and issues about applying association rule mining for Market Basket Analysis. Three Example Applications of Market Basket Analysis: The first application is on analysing library circulation data [7]. The idea is to detect subject-classification categories that co-occur in loan records of books. The second application is in the domain of Bioinformatics where association rule patterns are discovered from gene
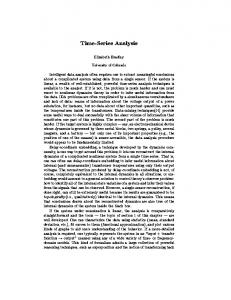
expression data [6]. The third example is on extending the application of Market Basket Analysis form a single-store to a multiple-store environment [5]; while this extension from single to multiple stores helps identifying new insights, the number of transactions to be processed also increases considerably. This will increase data processing time when association rule mining algorithm is applied. In the following, we discuss some related issues. Issues in using Association Rule Mining for Market Basket Analysis: The first issue is the generation of too many redundant rules. While there have been attempts in the data mining community to address this problem (e.g., see [2], [11]), research is still ongoing. The second issue concerns the “interestingness” of rules. Association rule mining tends to generate many trivial rules that are already known to the user. These rules often distract users from identifying rules that are really interesting and useful. The task of finding interesting association rules is an important topic in data mining research and has received a lot of attention [13]. The third issue is the long computation time required to discover large item-set patterns. To overcome this problem, some attempts have been made to develop more efficient algorithms (e.g., see [9]) or using sampling technique [3, 12] to reduce the amount of data to be processed. As mentioned earlier, this work considers the application of cluster analysis instead of association rule mining to perform Market Basket Analysis. In the following, we review some topics related to time series clustering. Cluster analysis: While association analysis aims at identifying groups of attributes (i.e., products, as in the context of Market Basket Analysis), cluster analysis focuses on identifying groups of similar records (i.e., sales transactions). One of the most commonly used clustering methods is K-Means clustering [10]. K-Means is a simple partitional clustering algorithm that clusters observations into K groups, where K is a user-specified input parameter for the number of clusters. KMeans assigns each observation to its nearest cluster. When the value of K is not known in advance, it is necessary to generate different clustering solutions using different values of K. The clustering solution that best describes the actual clustering pattern in the data can be found using cluster quality measures. One of the commonly used measures is the Silhouette coefficient. This is a good indicator of cluster quality because it gives an objective measure of the cohesion and separation of clusters in the clustering solution. Most sales data sets are represented as a table recording sales transactions sequenced by time. To apply cluster analysis on such data, the format has to be converted into time series format. A time series is a sequence of observations ordered by time points [16]. Figure 1 shows a good example of time series, which is a sequence of monthly sales quantity of a part (D23) ordered by a company. When clustering time series, the method can be applied directly on the raw time series data vectors; but if the data spans across many time points, then global features
(such as skewness, kurtosis, seasonality, etc) be extracted for clustering in order to achieve scalability [16].
Sales Quantity
In the next section, we present a real-world case where Market Basket Analysis was performed using time series clustering of sales data.
100 90 80 70 60 50 40 30 20 10 0
Company B-- Part D23
1
3
5
7
9 11 13 15 17 19 21 23 25 27 29 31 33 35 Month
Figure 1: An example of time series showing the sales quantity of Part D23 being purchased by Company B over 36 monthly time points.
3 A Real-world Case of Market Basket Analysis using Clustering Z Company1 is a global supplier of raw parts to many manufacturing companies. According to the annual financial report by the Headquarter of Z Company, the outlook is not rosy due to fierce competition. The company sees the urgent need to be more rigorous in managing its productions, stock control and distributions. In response to the situation, one of the business objectives is to better understand customer needs. While customer questionnaire survey may be used to achieve this goal, the approach is expensive, time consuming, and requires careful execution to get reliable and useful results. One alternative is to mine the existing data to discover useful customer information. Towards this end, this project aims to analyse the sales transaction data to discover customer purchasing behaviours. Data Preparation: Z Company has about 56 thousand sales records of more than 700 products over the past three years. The sales transaction data set also contains more than ten transaction-related variables. For the purpose of time series clustering, we only require the Customer Number, Item Part Number, Sales Date and Quantity Ordered of each transaction as the data set for analysis.
1
The actual identity of this company cannot be disclosed due to confidentiality reasons.
During the data preparation stage, a small number of invalid records (mainly canceled orders) were identified and removed before further analysis. The data was sorted by Customer Number and then Item Part Number and Sales Date. The records are then aggregated by month and the total quantity ordered in each month was then computed. This resulted in a table with Customer Number, Item Part Number, Month Identifier (an integer than ranges from 1 to 36), and Monthly Sales Quantity. This table is then reformatted to have each Month Identifier being represented as a column capturing the sales quantity of the month. The resulting table ends up with about two thousand records over a period of 36 monthly time-points. Each record captures 36 monthly sales quantities of a part sold to a particular customer over the three-year period. Figure 2 gives an example of the data conversion from sales transaction format to time series format. Since the data spans over only 36 time points, the data size is small and we can apply clustering directly on the time series data. Customer Num Item Part Num Month ID Sales Qty Company B D23 1 73 Company B D23 2 59 Company B D23 … … Company B D23 36 67 Company B D24 1 15 Company B D24 2 22 Company B D24 … … Company B D24 36 23 … … … …
Customer Num Item Part Num Company B D23 Company B D24 … …
1 73 15 …
Month ID 2 … 59 … 22 … … …
36 67 23 …
Figure 2: Data conversion from sales transaction table format to time series format. One characteristic of the original sales data is that the ordered quantity of the same part may vary greatly. For example, Customer A may purchase 5000 pieces of one part, while Customer B may purchase only 500 pieces of the same part. When performing cluster analysis on such data, we want the algorithm to cluster time series records with similar temporal patterns without being concerned with the actual quantities being purchased. This is particularly important for clustering algorithms that make use of distance function to compute similarity between any two time series. In this project, we normalize each time series data record to a standard range, which results in assigning an equal weight to every time series when performing clustering.
4 Results and Discussions We use K-Means clustering algorithm to generate a series of clustering solutions with different number of clusters, namely K = 35, K = 40, K = 45 and K = 50. The solution with 45 clusters gives a good score based on Silhouette coefficient; so this clustering solution is being selected for further analysis. In the 45 clusters generated, we found many interesting sets of complementary parts that are used to make different types of products. These sets of complementary
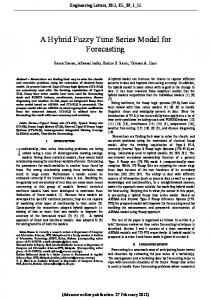
parts are previously not known to us, and the new information allows sales staff to derive useful strategies for pricing, sales and marketing. Since most of patterns found are similar, we present a typical example pattern to highlight the key characteristics. Deriving from one of the clusters, Figure 3 shows a high correlation between the sales of Part D-12 and Part D-14 supplied to D Company. This company is an existing customer of Z Company and the company specialises in making components used in production of white goods. Further clarification with D Company confirms that these two parts are used to manufacture the same product. Hence, Parts D-12 and D-14 are complementary parts. This finding is useful in two ways. Firstly, basic economics principle tells us that the demands of complementary products are positively correlated [4]. This implies that price reduction of Part D-12 may lead to an increase of its demand, as well as the demand of Part D-14. Hence, this piece of information can help Z Company in deriving appropriate pricing strategy of commonly purchased parts discovered in the clustering exercise. Secondly, the information may be useful for stock control because Figure 3 shows that when one part has zero demand, it tends to lead the other part to have zero demand as well. For example, when there is no sales transaction of part D-14 at timepoints 4, 16, and 28, there is also no sales transaction of D-12 at time-points 5, 17 and 29 respectively. This suggests that Z Company should be prudent in stocking up D-12 for D Company in the upcoming month when there is no sales transaction of D-14 in the current month. Note that this type of insight is not easy to discover when applying association rule mining.
Sales Quantity
1 D12
0.8
D14
0.6 0.4 0.2 0 1
3
5
7
9
11 13 15 17 19 21 23 25 27 29 31 33 35
Monthly Time Point
Figure 3: The sales quantities of Parts D-12 and D-14 are highly correlated in demand.
5 Concluding Remarks This paper shows that time series clustering of sales data can help reveal interesting information about customers, which contributes towards competing on customer intelligence. For example, the discovery of complementary products can lead to new cross-selling opportunities and help more careful inventory control. The information can also be used to improve pricing. This study also suggests that applying time series clustering on sales data could complement and reduce the cost of traditional customer surveys. We have shown that mining customer sales data has helped Z Company to obtain useful information (e.g., discovery of previously unknown complementary products) that is otherwise hard to obtain using questionnaire surveys. One interesting point to note is the conversion of the original sales data to the time series format. The conversion leads to a significant reduction in the size of data to be mined. If the original sales data were to be plainly analysed using association rule mining, it would have been a 56000-by-700 data matrix (which is based 56000 transactions and 700 products); but when converted to time series, the data matrix size is reduced to about 2000 by 36. The total number of data cells needed is reduced by 544 times (i.e., 56000*700/(2000*36))! This reduction in data size has helped our analysis tremendously. Moreover, the problem of having sparse matrix is also resolved as a result of this conversion. Our work shows that certain market basket data can be analysed more easily using time series clustering instead of association analysis. Since Market Basket Analysis has wide applicability in many domains, we believe some problems previously solved using association analysis can now be better tackled using time series clustering. Furthermore, more advanced clustering methods (e.g., [14, 15]) can be used to enhance the analysis.
References 1. Agrawal, R., Srikant, R.: Fast algorithms for mining association rules. Proceedings of the International Conference on Very Large Data Bases. pp. 487–499. (1994) 2. Baralis, E., Cagliero, L., Cerquitelli, T., Garza, P.: Generalized association rule mining with constraints. Information Sciences. Vol. (194). pp. 68-84. (2012) 3. Basel, A.M., Amer F.A., and Mohammed Z. Z.: A new sampling technique for association rule mining. Journal of Information Science. Vol. 35. pp. 358–376. (2009) 4. Blattberg, R.C., Kim, B-D., Neslin, S.A.: Database Marketing, Analyzing and Managing Customers. Series: International Series in Quantitative Marketing. Vol. 18. (2008)
5. Chen, Y.L., Tang, K., Shen, R.J., Hu, Y.H.: Market basket analysis in a multiple store environment, Decision Support Systems. Vol. 40(2). pp. 339–354. (2005) 6. Creighton, C., Hanash S.: Mining gene expression databases for association rules. Bioinformatics. Vol. 19 (1), pp.79–86. (2003) 7. Cunningham, S.J., Frank, E.: Market basket analysis of library circulation data. Proceedings of 6th International Conference on Neural Information Processing. pp.825–830. (1999) 8. Gutierrez, N.: Demystifying Market Basket Analysis. DM Review Special Report. (2006) 9. Luís C.: A scalable algorithm for the market basket analysis. Journal of Retailing and Consumer Services. Vol. 14(6). pp. 400–407. (2007) 10. MacQueen, J. B.: Some Methods for classification and Analysis of Multivariate Observations. Proceedings of 5th Berkeley Symposium on Mathematical Statistics and Probability 1. University of California Press. pp. 281–297. (1967) 11. Mafruz, Z.A., David, T., Kate, S.: Redundant association rules reduction techniques. International Journal Business Intelligent Data Mining. Vol. 2 (1). pp. 29–63. (2007) 12. Matteo, A. R., Eli, A.U.: Efficient Discovery of Association Rules and Frequent Itemsets through Sampling with Tight Performance Guarantees. Proceedings of European Conference on Machine Learning and Principles and Practice of Knowledge Discovery in Databases (ECML PKDD) 2012. pp. 25–41. (2012) 13. Stéphane, L., Olivier, T., Elie, P.: Association rule interestingness: measure and statistical validation. Quality measures in data mining. Springer. (2006) 14. Tan, S.C.: Simplifying and improving swarm-based clustering. In Proceedings of IEEE Congress on Evolutionary Computation. pp. 1–8. (2012) 15. Tan, S.C., Ting, K.M., Teng, S.W.: A general stochastic clustering method for automatic cluster discovery. Pattern Recognition. Vol. 44 (10). pp. 2786–2799. (2011) 16. Xiaozhe, W., Kate A.S., Rob, H., Damminda, A.:A Scalable Method for Time Series Clustering. Technical Report. Monash University. (2004)