Using Control Charts for Detecting and Understanding Performance Regressions in Large Software Thanh H. D. Nguyen Software Analysis and Intelligence Lab (SAIL) School of Computing, Queen’s University, Kingston, Ontario, Canada
[email protected]
Abstract—Load testing is a very important step in testing of large-scale software systems. For example, studies found that users are likely to abandon an online transaction if the web application fails to response within eight seconds. Performance load tests ensure that performance counters such as response time stays in the acceptable range after each change to the code. Analyzing load tests results to detect performance regression is very time consuming due to the large amount of performance counters. In this thesis, we propose approaches that use control charts, a statistical process control technique, to assist performance engineers in identifying test runs with performance regressions, pinpointing the components which cause the regressions, and determining the causes of regressions in load tests. Using our approaches, engineers will save time in analyzing the results of load tests. Keywords-load testing; root cause analysis; statistical process control; control charts
I. I NTRODUCTION Performance is an importance aspect of large software systems which would have to process thousands of transactions to thousands of users concurrently. Unfortunately, a large number of field problems are performance related [1]. For example, web users usually lost patience after eight seconds [2]. They most likely leave the site after a ten seconds wait. Such a situation has serious implication on the vitality of a business. Load testing, which is a type of performance test, ensures that the performance is satisfactory to the users and that there is no performance regression. Performance regression means that a new version performs worse that the previous version of the software. A performance regression indicates that the changes to the software degraded its performance. For example, a change in the database schema might increase the response time of a query by 10%. This 10% can push the overall response time of the system over the ten seconds threshold. Today, analyzing load tests is a time consuming and error-prone manual process [3], [4]. Each test run produces thousands of performance counters such as CPU utilization, memory usage, disk I/O, or network I/O. In my thesis, I want to develop an approach that can automatically identify performance regressions in load test
runs, pinpointing the components which cause the regressions, and determining the root causes of regressions in load tests. My approaches are based on a statistical process control technique called control charts. Control charts are commonly used in manufacturing process to identify problems with output products. Software systems are very similar to manufacturing processes. I want to apply control charts to analyze load tests’ results. This thesis aims to provide two important contributions to performance engineering: • Detection of performance regression: Manually determining if, where, and what performance regression problems occur during a load test is very time consuming. This thesis aims to develop automatic or semiautomatic approaches that can speed up the process. • Explanation of the nature of such regression: The same model used to detect problems can also be used to explain the nature of performance regression. Such an explanatory model can help engineers resolve the regression. II. L OAD T ESTING The goal of load testing is to ensure that performance of a software system stays in an acceptable level and is not worse than the previous version of the software. For example, the response time of a web server must be less than ten second. The response time of the latest version is eight seconds. If the new version’s response time is eleven then it is unacceptable. If the new version response time is nine seconds, it is still acceptable but there is a performance regression that must be explained. In a performance test run, engineers put the software under a field-like load. During the run, performance counters, such as response time, throughput, CPU utilization, memory utilization, or IO access per second, and execution logs are recorded. After the run finishes, engineers need to analyze the test results. They compare the counters of the new test run, called target run, to the counters of past test runs, called baseline runs, which are known to be satisfactory. If there is a significant change in the counters, a performance regression is detected and additional root cause analysis is performed to understand and possibly resolve the regression.
Execution logs are also examined for errors. However, this thesis is only focus on performance counters. III. C HALLENGE IN L OAD T EST A NALYSIS After a test run, which can take anywhere from a few hours to several days, engineers need to analyze the performance counters to answer the three questions. They typically compare counters of the new test run (target run) with the good past runs (baseline runs). This section describes each of these questions as a problem which I plan to address in the thesis. A. Problem 1: Is there a performance regression? A performance regression means that the software performs worse than before. For example, if the response time is higher, then there maybe a performance regression. Comparing the counters is not a trivial problem in large and complex software systems. For example, it is impossible to replicate the same load across the test runs. So comparing the mean response time would not be accurate. Input: Resource and customer-facing counters of the target run and the equivalent counters of the baseline runs. Output: Probability that performance regression occurred in the target run. B. Problem 2: Where does performance regression occur? Large software systems consist of several types of component. For example, the Apache Tomcat [5] application server has six different components (server, service, engine, host, connector, and context). Each of these components may have many instances. Assuming that performance regression is detected, engineers have to pinpoint the instance of a component where the regression occurs. This is a very challenging task because there are many counters for each instance of a component. The total number of performance counters can be thousands. In practice, engineers usually have to manual compare each counters of the target run to the corresponding counters of the baseline runs. This is a very time consuming process. Input: Resource counters of the past baseline test runs and the equivalent counters of the new target run. Output: Probability for each component which represents the chance that the performance regression occurs in that particular component. C. Problem 3: What causes the regression? After determining from where the regression comes from, the engineers will need to determine what caused that regression. There are common types of performance problems. For example, a high-frequency database query takes longer because of a change in the indexes. Another example is that a log print-out was left in the code so the component produces more log lines which requires much more I/O. Understanding the kind of problem usually requires static
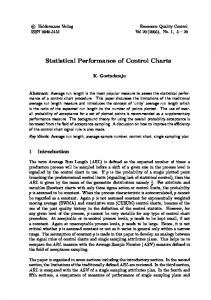
analysis of source code. Such analysis would require time and may be out of the expertise of the test engineers. Input: Resource counters of the past baseline test runs and the equivalent counters of the new target test. Output: Probability for each known cause which is likely the root-cause of the performance regression in the target test. IV. T HE P ROPOSED S OLUTION : AUTOMATIC D ETECTION AND E XPLANATION OF P ERFORMANCE R EGRESSION USING C ONTROL C HARTS In this thesis, I propose automatic approaches using control charts to the problems outlined in the previous section. A. Control charts. Control charts were first introduced by Shewhart [6] at Bell Labs, formerly known as Western Electric, in the early 1920s. The goal of control charts is to automatically determine if a deviation in a process is due to common causes, e.g., input fluctuation, or due to special causes, e.g., defects. Control charts were originally used to monitor deviation on telephone switches. Control charts have since become a common tool to detect problems in manufacturing processes where raw materials are inputs and the completed products are outputs. Figure 1(a) and 1(b) show two example control charts. The x-axis is time, e.g., minutes. The y-axis is the process output data. For this example, we are monitoring the response time of a web server. The two solid lines are the Upper Control Limits (UCL) and Lower Control Limit (LCL). The dashed line in the middle is the Centre Line (CL). Figure 1(a) is an example where the response time is within its control limits. This should be the normal operation of the web server. Figure 1(b), on the other hand, is an example where a process output is out-of-control. In this case, operators should be alerted for further investigation. A control chart is typically built using two datasets: a baseline dataset and a target dataset. In our case, the baseline dataset is the counter readings from the baseline runs. The target dataset is the counter readings from target run. The baseline dataset is used to create the control limits, i.e., LCL, CL, and UCL. In the example of Figure 1(a) and 1(b), the baseline set would be the response time of baseline test runs. The CL is the median of all samples in the baseline dataset at particular time. The LCL is the lower limit of the normal behaviour range. The UCL is the upper limit. The LCL and the UCL can be defined in several ways. A common choice is three standard deviations from the CL. The target dataset is used to score against the control limits of the baseline dataset. In Figure 1(a) and 1(b), the target data are the crosses. Those would be the response time of the new target test. The result of an analysis using control chart is the violation ratio. The violation ratio is the percentage of the
x
x x x x x
x
x x x x x x x xx x x xx x
x x x x x xxx xx x x x x x x x x x x x x x x xxx x xxx x
Time
x
Baseline LCL,UCL Baseline CL x Target
x x x x x x x x xx x x x xx xx x x x x x x x x x x x xx x x x x x x x x xx x xx x xx xx xx x x x
Time
(a) Normal operation Figure 1.
Response time
Response time
x
Baseline LCL,UCL Baseline CL x Target
(b) Out-of-control
Example of control chart which detect deviation in process output.
target dataset that is outside the control limits. The violation ratio represents the degree to which the current operation is out-of-control. In Figure 1(a) and 1(b), the violation ratio is percentage the crosses that are outside the LCL and UCL lines. B. Load Test Analysis Using Violation Ratios Figure 2 shows the conceptual diagram of our proposed approach. For each counter, e.g., CPU utilization, in the target test, we will collect the same counter from the baseline tests. We use the baseline counter readings to determine the control limits. Then we will score the violation ratio for that counter. The violation ratios of all the counters of the target test are the inputs of our load test analysis approach. To solve the first problem, our approach will use suitable methods to compare the target counters with the baseline counters in order to detect performance regression. For example, if the violation ratio of the response time counter is greater than 30%, then there is performance regression. To solve the second and third problem, our approach will use machine learners, such as decision trees, linear models, or support vector machines, on the counters’ violation ratio to determine where and what problem occurs. The training set of the learner would be a repository of known problems. For example, if the database index changes, the CPU and memory utilization of the database component will have high violation ratios. The testing set of the learner would be the violation ratios of target test. The learners will match the violation ratios in the target run with each of the known problems and output a probability which indicates where and what regression problem occurred in the run. V. R ELATED WORK The approaches in this thesis needs to leverage knowledge from two software and system engineering fields: Load test analysis, system monitor, and root cause analysis. Load test analysis. Performance engineering studies techniques that can be used to determine problems during a performance load test. For example, Foo et al. [4], [7] detected the change in behaviour among the performance counters using association rules. If the differences are higher
than a threshold, the run is marked as problematic. Malik [8] used a factor analysis technique called principle component analysis to transform all the counters into a small set of more distinct vectors. Then they compare the pairwise correlations between the vectors in the target run with those of the baseline run. These techniques are state of the art in load test analysis. However, control charts are more intuitive than associate rules and principal components. Initial feedback from practitioners has shown that the approach and the analysis results are easier to comprehend and explain. System monitor. In system research, there are techniques to detect problems of production software systems. For example, Cohen et al. [9] used a learner called TreeAugmented Bayesian Networks to identify combinations of related metrics that are highly correlated with faults. Jiang et al. [10] used Normalized Mutual Information to cluster correlated metrics. Then they used Wilcoxon Rank-Sum test on the metrics to identify faulty components. Cherkasova et al. [11] developed regression-based transaction models from the counters to identify software runtime problems. Although runtime problems are not necessarily performance related, I hope to apply the learner proposed in these studies to find solutions for problems two and three. Root cause analysis. Root cause analysis studies techniques that can be used to determine root causes of software, hardware, or network failures. For example, Julisch [12] used clustering algorithm to determine root causes of intrusion alarms. They were able to reduce 90% of alarms to a few dozen causes. Yan et al. [13] used cause and effect rules on and ISP network to build a decision tree which can determine the root causes of network problems. Leszak et al. [14] studied the root cause of software defects using historical modification requests. They were able to group defects into meaningful causes that can be avoid in future development. Agarwal and Madduri [15] studied the root causes of performance in software system. They were able to accurately identify the changes that cause the performance failures. Problems two and three are essentially a root-cause analysis problems. So I also hope to leverage the findings of
Target test Counters
Performance Counter
Run new target test
G G
G
G
G
G
G
G
Repository of load test results
Baseline test 1 counters
Baseline test 2 counters
Figure 2.
1
2
3
4
5
6
G
Baseline LCL Baseline CL Baseline UCL Target 7
Regression Analysis
8
Repository of known problems
Time periods
Control limits
Regression?
Where?
What?
A conceptual diagram of our approach to performance regression analysis using control charts.
these studies to find suitable solutions. VI. P ROGRESS AND E VALUATION A PPROACH Progress has been made on the first problem. We proposed an approach [16] which uses control chart on customerfacing counters to detect performance regression in test runs. To evaluate our approach, we used a large enterprise software system and the open-source Dell DVD store1 . We introduced performance regressions into both systems and performed controlled test runs. We then checked if our approach could distinguish these problematic runs with normal runs of the unmodified software. The approach was able to distinguish between normal and problematic runs with high accuracy. For future studies, we are planning to evaluate our solution to problem one with test runs that contains real field problems. We are also setting up more control runs to explore solutions to the other two problems. VII. C ONCLUSION This thesis aims to derive control-chart based approach for load testing analysis. The feedback we received so far from the enterprise system’s engineers for our first approach [16] have been positive. The engineers especially like the simplicity of the control charts. The analysis results are easy to explain to their peers. Thus, we believe our approach has high potential to be adopted in industry. R EFERENCES [1] E. J. Weyuker and F. I. Vokolos, “Experience with performance testing of software systems: issues, an approach, and case study,” IEEE Transactions on Software Engineering (TSE), vol. 26, no. 12, pp. 1147–1156, 2000. [2] J. Palmer, “Designing for web site usability,” Computer, vol. 35, no. 7, pp. 102–103, 2002. [3] Z. M. Jiang, A. E. Hassan, G. Hamann, and P. Flora, “Automatic identification of load testing problems,” in International Conference on Software Maintenance (ICSM), 2008, pp. 307– 316. [4] K. C. Foo, J. Zhen Ming, B. Adams, A. E. Hassan, Z. Ying, and P. Flora, “Mining performance regression testing repositories for automated performance analysis,” in International Conference on Quality Software (QSIC), 2010, pp. 32–41. [5] The Apache Software Foundation, “Tomcat,” 2010, ver. 5.5. 1 http://linux.dell.com/dvdstore
Counters violation ratios
[6] W. Shewhart, Economic control of quality of manufactured product. Van Nostrand, NY: American Society for Quality Control, 1931. [7] K. C. Foo, “Automated discovery of performance regressions in enterprise applications,” Master’s thesis, School of Computing, Queen’s University, 2011. [8] H. Malik, “A methodology to support load test analysis,” in International Conference on Software Engineering (ICSE). Cape Town, South Africa: ACM, 2010, pp. 421–424. [9] I. Cohen, M. Goldszmidt, T. Kelly, J. Symons, and J. S. Chase, “Correlating instrumentation data to system states: a building block for automated diagnosis and control,” in Symposium on Opearting Systems Design Implementation. San Francisco, CA: USENIX Association, 2004, pp. 231– 244. [10] M. Jiang, M. A. Munawar, T. Reidemeister, and P. A. S. Ward, “Automatic fault detection and diagnosis in complex software systems by information-theoretic monitoring,” in International Conference on Dependable Systems Networks (DSN), 2009, pp. 285–294. [11] L. Cherkasova, K. Ozonat, M. Ningfang, J. Symons, and E. Smirni, “Anomaly? application change? or workload change? towards automated detection of application performance anomaly and change,” in International Conference on Dependable Systems and Networks (DSN), 2008, pp. 452– 461. [12] K. Julisch, “Clustering intrusion detection alarms to support root cause analysis,” ACM Trans. Inf. Syst. Secur., vol. 6, no. 4, pp. 443–471, 2003. [13] H. Yan, L. Breslau, Z. Ge, D. Massey, D. Pei, and J. Yates, “G-rca: a generic root cause analysis platform for service quality management in large ip networks,” in International COnference (CoNEXT). Philadelphia, Pennsylvania: ACM, 2010, pp. 1–12. [14] M. Leszak, D. E. Perry, and D. Stoll, “A case study in root cause defect analysis,” in International Conference on Software Engineering, 2000, pp. 428–437. [15] M. K. Agarwal and V. R. Madduri, “Correlating failures with asynchronous changes for root cause analysis in enterprise environments,” in Dependable Systems and Networks (DSN), 2010, pp. 517–526. [16] T. H. D. Nguyen, B. Adams, Z. Jiang, A. E. Hassan, M. Nasser, and P. Flora, “Automated verification of load tests using control charts,” in Asia-Pacific Software Engineering Conference, 2011.