1Department of Electrical and Computer Engineering, National University of Singapore, Singapore 117576 ..... Intel Core 2 Duo based notebook computer. Fig.
Vascular Flow Rendering for Interactive Simulation of Contrast and Drugs Injection Binh P. Nguyen 1, C. K. Chui2, S. H. Ong1, Stephen Chang3 1
Department of Electrical and Computer Engineering, National University of Singapore, Singapore 117576 2 Department of Mechanical Engineering, National University of Singapore, Singapore 117576 3 Department of Surgery, National University Hospital, Singapore 119074 {phubinh, mpecck, eleongsh, surv7}@nus.edu.sg
Abstract—In chemoembolization, chemotherapy drugs and thrombotic agents are directly injected into the liver tumor through a catheter navigated to the artery that supplies the tumor. In order to help surgeons to train their hand-eye coordination skills to reduce the risk of injecting the thrombotic agents incorrectly and deprive normal tissue of its blood supply, this paper proposes a method for rendering the flow particles in simulation of chemotherapy drugs injection. Firstly, a three dimensional (3-D) region growing technique is used to extract vessels from clinical CT images. These vessels are skeletonized using a 3-D thinning algorithm, and their geometries are reconstructed using cubic b-splines. Quadrilaterals which are aligned along the viewing direction are rendered to visualize the movement of particles through the flow modeled using HagenPoiseuille Flow. Our visualization method achieves a computational efficient and good visual approximation of the flow of particles inside the vessels under fluoroscopic imaging. Keywords—Visualization, physical-based modeling, blood flow, tumor, chemoembolization, human-computer interface.
I. INTRODUCTION Chemoembolization is an important therapeutic method to treat cancer, most often of the liver. It is a combination of local delivery of chemotherapy and a procedure called embolization. Studies have shown that approximately 70 percent of the patients who go through chemoembolization will see improvement in the liver. They may live longer depending on the type of liver cancer [1]. In chemoembolization, catheter is used as conduit to inject anti-cancer drugs directly into a cancerous tumor and place thrombotic agents inside the vessels that supply blood to the tumor. While the liver continues to receive blood from the portal vein, oxygenated blood is no longer supplied to the tumor since the artery is blocked. This also traps the anti-cancer drugs in the tumor, allowing the drugs to stay within the tumor for a longer period of time. Real-time X-ray fluoroscopy is used in chemoembolization to monitor the passage of catheter through the artery, as well as the injection of drugs into the tumor. Several groups have been working on interactive simulation systems on catheter navigation for training and surgical planning [2], [3]. The injection of chemotherapy drugs is just as important compared to the manipulation of catheter since it is a complex image guided This work is supported by research grants from National University of Singapore (R-265-000-270-112 and R-265-000-270-133).
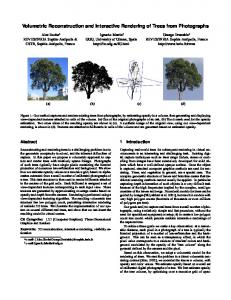
procedure that requires a high degree of hand-eye coordination skills on the physician. In addition, there is always a risk that the thrombotic agents can lodge in the wrong place and deprive normal tissue of its blood supply. This paper focuses on physics-based visualization of the flow of particles for interactive simulation of chemotherapy drugs injection. The proposed computationally efficient method can achieve good visual approximation of the flow of particles inside the blood vessels under fluoroscopic imaging. We also describe the reconstruction of hepatic vessels from medical images. II. MATERIALS AND METHODS In the simulation for drugs injection, we assume that the catheter has already been inserted and navigated to the artery that feeds the tumor. The vascular segments in the hepatic vascular system are modeled using 3-D region growing algorithm, 3-D skeletonization method and cubic b-spline interpolation. The movement of particles through the flow is modeled using Hagen-Poiseuille flow and visualized by drawing quadrilaterals along the centre lines of the vessels and perpendicular to the viewing direction. A. Vascular Reconstruction We hypothesize that a hepatic vessel can be represented by one or more finite element beam elements. Such an element has a circular cross section and can be visualized as a generalized cylinder. This is a valid assumption of the hepatic vessels since they are typically small vessels. When filled with blood, they generally have a circular cross section. In order to obtain a geometric model of hepatic vascular, a 3-D region growing algorithm is first applied to extract the raw regions of interest from a 3-D volume constructed based on CT images of patient’s liver organ (Fig. 1). Next, a 3-D thinning algorithm is used to generate the hepatic vasculature skeleton from the raw regions. The number of voxels in the skeleton is reduced in a post-processing step, the vessel skeleton thus become a unitwidth curve. After that, each branch in the vessel trees is approximated by a cubic b-spline. Finally, a set of control points forming the splines and the branching structure of the trees will be used in modeling the hepatic vasculature. Details of the method are presented below.
1) 3-D Region Growing Before processing, the user defines the intensity range for valid seeds and the allowed intensity for voxels in resultant regions. The 3-D region growing algorithm involves the following steps: 1) Find the first unvisited seed which is in the allowed intensity range. Assign the next available region number to this voxel and push it into a waiting queue. 2) Pop a voxel ( x, y, z ) from the queue then examine all unvisited neighbors of ( x, y, z ) . Assign the current region number to the neighbor ( x, y , z ) and push ( x, y , z ) into a queue if and only if: both ( x, y, z ) and ( x, y , z ) are valid seeds, or ( x , y , z ) is in the allowed intensity range and the intensity difference between it and ( x, y, z ) is small enough. Repeat this step until the queue is empty.
(a)
3) Return to step (1) if more seeds in the volume still need to be examined. 4) Remove all extracted regions which have the total number of voxels and/or the total number of seeds less than the pre-specified numbers. 2) Thinning and Skeletonization
(b)
An efficient 3-D thinning algorithm [4] is applied to all the remaining regions from 3D region growing to extract their skeletons. This algorithm preserves the topology of each region and guarantees that the skeleton will be close to the medial axis of the region (Fig. 1(c)). However, like most of other 3-D thinning algorithms, this algorithm cannot be guaranteed to generate unit-width curve skeletons in some cases. In order to improve the accuracy of subsequent processing steps, a postprocessing procedure is applied to reduce the number of voxels in the skeleton, thus causing it to be unit-width curve. We define the degree of a voxel as the number of object voxels in its 26 neighbors. We also define a crowded joint voxel as a voxel that has degree > 2 and at least one of its neighbors has degree > 2. A crowded region is a region formed by 26-connected crowded joint voxels. The post-processing step begins with finding all the crowded regions. Next, all object voxels having degree ≤ 2 and 26-adjacent to each crowded region are located and marked as entry voxels. Then an object voxel in a crowded region which is closest to the region centroid is determined and marked as a target voxel. In each crowded region, the Dijkstra algorithm is applied to find the shortest path between each entry voxels and the target voxel. Finally, all crowded voxels that are not on any of the shortest paths are removed. As the result, the skeleton becomes one unit wide because all the crowded regions are eliminated. 3) Generalized Cylinder Vessel Modeling A tree-like branching structure is dynamically established by a recursive traverse procedure through all unit-width vessel skeletons. In order to reduce the computational load and for
(c) Fig. 1. Hepatic vessels reconstruction: (a) The maximum-intensity projection images for all slides. (b) The raw regions of interest. (c) The skeleton of the vessel tree.
ease of representing the skeleton in the form of a vessel, a finite number of control points and a knot sequence are assigned to each branch of the skeleton. Subsequently, the new branch is obtained by finding a cubic b-spline curve passing through all those control points [5]. Each b-spline can be sampled by specifying a number of points between two successive control points. Therefore, each branch is represented by the set of lines connecting the sample points in the corresponding b-spline. These lines will be the central lines of the generalized cylinders representing the vessel branch. The radius of each cylinder can be derived from the raw region of interest and the corresponding skeleton of each vessel branch obtained after previous step. A circle in the plane of the cross-section is continuously grown until it reaches a relevant local maximum of the allowed intensity, thus giving estimated radius along the central lines. The use of control points in this process is computationally faster compared to conventional methods and
hence more suitable for interactive simulation, particularly augmented reality applications. B. Flow Model In fluid dynamics, the Hagen–Poiseuille equation is a physical law that describes slow viscous incompressible flow through a constant circular cross-section. Neglecting effect of gravity, the differential equation of fluid flow is given by:
du
dr
r dp
Fig. 2. A line segment can be rotated 3600 about the x-axis to generate a conical pipe.
2 dx R2
Assuming the viscosity is constant and the flow is steady, we can derive the following formula [6]:
P
P
8L Q 4 R
The standard Hagen–Poiseuille equation (2) applies for a tube section with constant radius. However, it can be modified to apply to a conical tube with a linearly varying radius. Obviously, a conical tube with radii R1 and R2 at its ends can be obtained by rotating a line segment 360 about the x-axis (Fig. 2). Hence, it can be considered as being made up of numerous thin sections. Each of the sections can be approximated as a constant radius tube section where the Hagen-Poiseuille relations apply. As a result, we can derive the pressure difference between the two ends as follows: L
8Q P 4 dx R 0
The equation of the line segment can be represented as a function R(x) :
R
R2 R1 x R1 L
Hence, we can derive the following formula for P :
P
8LQ 1 1 1 1 3 R1 R2 3 R12 R2 2 R13 R2
For a tube subjected to a flow rate Q and pressure drop P , the conductance to flow is
Q P
C
Assuming that L and are similar for all subsidiary branches at points of branching, the minimum conductance of a filled subsidiary branch is essentially proportional to the fourth 4 power of its minimum radius, Rmin . For a partially filled subsidiary branch, Rmin is given by the minimum radius of cross sections where the fluid has flowed past. This will be updated as branch filling continues. This dynamic update of network conductance to alter the flow distribution is clearly more realistical as the network is filled progressively. Hence, at a branching point with N subsidiary branches and a total input flow rate of Q0 , the flow rate through a subsidiary branch i , with corresponding Rmin Ri , is given by
Qi
Ri 4 N
From (4), we have: L dx dR R2 R1
1 8QL 1 1 3 3 3R2 R1 R1 R2
In the above equations, is the dynamic fluid viscosity, u (r ) is the axial velocity at radial distance r from the tube centre line, x is a distance in direction of the flow, Q denotes the volumetric flow rate, L is the length of the tube, R is the radius of the tube, and P is the pressure drop across the tube.
4
R1
8QL dR 2 R1
R R
Rj
Q0
4
j 1
Substituting (5) into (3) and changing the limits of integration accordingly,
The above branching distribution relation also ensures continuity is maintained because
t
t+1
t+2
t+3
Fig. 3. Visualization of drugs injection into a vessel during 4 consecutive time frames with difference viewing angles.
N
Q0 Qi
i 1
Similarity, the distribution of injected volume V0 through a subsidiary branch i is given by
Vi
Ri
4
V0
N
R
4 j
j 1
After vascular reconstruction step, the two radii of each tube and its length are known. Therefore, with the input values of injected volume V0 and flow rate Q0 , based on these above equations, we can calculate the partial length of each segment that is filled by fluid at each time step for rendering purposes. C. Rendering Method There is a variety of methods for three-dimensional flow visualization, for example the “Virtual Tubelets” [7]. This method is based on cylindrical billboards. They are basically quadrilaterals, which are aligned to face the viewer, and which are drawn or textured appropriately to create tubes. The head of the list of quadrilaterals is positioned at the current position of the corresponding particle with its tails passing through the particle’s recent positions. Preliminary investigation on visualization of flow particles in chemoembolization reported in [8] was also based upon cylindrical billboards. An ellipse was briefly considered in place of quadrilateral. However, the quadrilateral has advantages over ellipse in terms of rendering speed. In order to simulate the fluoroscopy, we rendered the flow as overlaying and semi-transparent quadrilaterals representing the particles' trails. The quadrilaterals might be drawn in decreasing grayness from the head to the last quadrilateral to depict the washing out effect during injection. This method is efficient in terms of speed since for each tube segment, there are only one or two quadrilaterals drawn instead of numerous polygons.
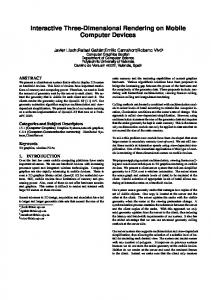
III. RESULTS We implemented the reconstruction method of hepatic vessels, and physics-based visualization of particles flow on an Intel Core 2 Duo based notebook computer. Fig. 3 is a snap shot of the rendered flow in various discrete time steps. Fig. 4 shows a region of fluoroscopy image of a hepatic artery and the corresponding simulation image generated. The vessel in this test consists of 384 conical tube segments created from 75 control points. The number of tube segments can be changed by changing the point density, i.e. the number of interpolated points between 2 consecutive control points, leading to the trade-off between image quality and speed. The average rendering time including the calculation when the viewing angle is changed approximately is 47 ms, meaning a frame rate of 21 frames per second. It takes approximately 3 s for modeling the vascular tree from a volume dataset of 256x256x120 voxels. The timings are measured on a 2.5 GHz Intel Core 2 Duo notebook. This un-optimized simulation program uses only Graphics Device Interface (GDI) functions to render the image. Although the frame rate in this test can be considered as an interactive frame rate, it may be significantly improved by shifting computational load to the GPU on an accelerated graphics card. Modern programmable graphics hardware has mechanisms to execute a small assembly program for every vertex which is sent to the graphics system. Hence, several procedures, e.g. computing the orientation of the billboards, can be moved from the CPU to the GPU for increasing the responsiveness of the visualization system. IV. D ISCUSSION AND CONCLUSIONS We have proposed a physics-based method for rendering the flow particles in the simulation of chemotherapy drugs injection. A 3-D region growing technique is used to extract hepatic vessels from clinical CT images. These vessels are skeletonized using a 3-D thinning algorithm. An additional post processing step is introduced to ensure that the resultant skeleton is of unit pixel width. The vascular geometries are reconstructed using cubic b-splines. The cubic b-splines method enhances the smoothness of the rendered vessels and is more computational efficient compared to conventional methods. Although generalized cylinders are used to represent the vessels, the flow is rendered using quadrilaterals.
applicable to simulation of chemotherapy drug injection as well as contrast dye injection for angiography. The quadrilaterals may eventually be replaced with ellipses. Although the quadrilaterals can be rendered faster than that of ellipses, the later may be a realistic representation. This realism will be important when we have a close up view of the flow of particles within the tumor. The flow model has to be improved to more accurately represent the flow within the tumor. The representation of a hepatic vessel using one or more finite element beam elements is important. It provides a mean to simulate the deformation of the small vessels due to the injection of the particles. The liver organ which is just below the heart is also subjected to periodic deformation from regular heart beats.
(a)
Realistic rendering of the tissues including tumor surrounding the vessels is not within the scope of discussion in this paper. We are currently developing a hybrid rendering method that combines the geometrical rendering of particles flow with volume rendering of tissues. REFERENCES [1]
[2]
[3]
[4]
(b) Fig. 4. Fluoroscopic imaging of a hepatic vessel: (a) A part of the image in reality. (b) Corresponding generated image based on the proposed method.
The quadrilaterals which are aligned along the viewing direction are rendered to visualize the movement of particles through the flow modeled using Hagen-Poiseuille Flow. The physics-based flow model is unique and is important for an accurate simulation of drug flow. While a prior work [9] assumes that the vascular resistance is invariant in time and the vessel’s radius in one segment generally is a constant, the Hagen-Poiseuille equation in our paper is modified to apply to a conical tube with a linearly varying radius. This approach has capability to create simple but realistic motions of blood flow. Our visualization method is computationally efficient and has achieved good visual approximation of the flow of particles inside the vessels under fluoroscopic imaging. This method is
[5] [6] [7]
[8]
[9]
The radiology information resource for patients (RadiologyInfo). (2008, November 18). Chemoembolization [Online]. Avaiable: http://www.radiologyinfo.org/en/info.cfm?PG=chemoembol C. K. Chui, Z. Li, J. H. Anderson, K. Murphy, A. Venbrux, X. Ma, Z. Wang, P. Gailloud, Y. Cai, Y. Wang, and W. L. Nowinski, “Training and pretreatment planning of interventional neuroradiology procedures initial clinical validation,” in Studies in Health Technology and Informatics. vol. 85, J. D. Westwood et al., Ed. Amsterdam: IOS Press, 2002, pp. 96-102. T. Alderliesten, M. K. Konings, and W. J. Niessen, “Simulation of minimally invasive vascular interventions for training purposes,” Computer Aided Surgery, vol. 9, no. 1, pp. 3-15, 2004. K. Palágyi, and A. Kuba, “A parallel 3D 12-subiteration thinning algorithm,” Graphical Models and Image Processing. vol. 61, no. 4, pp. 199-221, July 1999. G. Farin, Curves and Surfaces for Computer Aided Geometric Design: A Practical Guide, 4th ed. Academic Press, 1996, ch. 9. S. P. Sutera, and R. Skalak, “The history of Poiseuille's law,” Annual Review of Fluid Mechanics. vol. 25, pp. 1-19, 1993. M. Schirski, T. Kuhlen, M. Hopp, P. Adomeit, S. Pischinger, and C. Bischof, “Efficient visualization of large amounts of particle trajectories in virtual environments using virtual tubelets,” in Proc. ACM SIGGRAPH International Conference on Virtual Reality continuum and Its Applications in Industry, 2004, pp. 141-147. C. K. Chui, Y. Cai, Z. Wang, X. Ye, J. H. Anderson, S. H. Teoh, and I. Sakuma, “Flow Visualization for Interactive Simulation of Drugs Injection during Chemoembolization,” in Studies in Health Technology and Informatics. vol. 119, J. D. Westwood et al., Ed. Amsterdam: IOS Press, 2006, pp. 99-101. X. Wu, J. Allard, and S. Cotin, “Real-time modeling of vascular flow for angiography simulation,” in Proc. Medical Image Computing and Computer-Assisted Intervention – MICCAI, 2007, pp. 557-565.