Computer-Aided Design (
)
–
Contents lists available at ScienceDirect
Computer-Aided Design journal homepage: www.elsevier.com/locate/cad
ECISER: Efficient Clip-art Image SEgmentation by Re-rasterization✩ Ming Yang a , Hongyang Chao b,∗ a
School of Information Science and Technology, Sun Yat-sen University, 510275, China
b
School of Software, Sun Yat-sen University, 510275, China
highlights
graphical
abstract
• We propose ECISER, a method for clip-art image segmentation.
• It achieves dramatic computational speedups over the state-of-the-art approaches. • It preserves almost the same quality of results. • The basic idea is to connect image segmentation with aliased rasterization. • We also present a clip-art image segmentation database with ground truth labeling.
article
info
Keywords: Image segmentation Re-rasterization Color line model
abstract Clip-art image segmentation is widely used as an essential step to solve many vision problems such as colorization and vectorization. Many of these applications not only demand accurate segmentation results, but also have little tolerance for time cost, which leads to the main challenge of this kind of segmentation. However, most existing segmentation techniques are found not sufficient for this purpose due to either their high computation cost or low accuracy. To address such issues, we propose a novel segmentation approach, ECISER, which is well-suited in this context. The basic idea of ECISER is to take advantage of the particular nature of cartoon images and connect image segmentation with aliased rasterization. Based on such relationship, a clip-art image can be quickly segmented into regions by rerasterization of the original image and several other computationally efficient techniques developed in this paper. Experimental results show that our method achieves dramatic computational speedups over the current state-of-the-art approaches, while preserving almost the same quality of results. © 2014 Elsevier Ltd. All rights reserved.
1. Introduction
✩ This paper has been recommended for acceptance by Dr. Vadim Shapiro.
∗
Corresponding author. E-mail addresses:
[email protected] (M. Yang),
[email protected],
[email protected] (H. Chao). http://dx.doi.org/10.1016/j.cad.2014.08.011 0010-4485/© 2014 Elsevier Ltd. All rights reserved.
Image segmentation is the process of partitioning an image into a set of non-overlapped regions. In the present work, we consider the case where the image to be segmented is a clip-art image. Such an image is typically piece-wise smooth, and consists of a few color regions without fine textures (see Fig. 1(d)). Moreover, a clip-art
2
M. Yang, H. Chao / Computer-Aided Design (
a
)
b
–
c 250
1.0
Blue
200 150 100 50
G
re e
n
0.8 0.6 0.4 0.2 0.0 1.0 0.8 0.6 1.0 0.8 0.4 0.6 0.2 0.4 0.2 0.0 Red 0.0
d
0
e
0
50
100 150 200 250
0
50
100 150 200 250
f 250
1.0
Blue
200 150 100 50
G
re e
n
0.8 0.6 0.4 0.2 0.0 1.0 0.8 0.6 1.0 0.8 0.4 0.6 0.2 0.4 Red 0.2 0.0 0.0
0
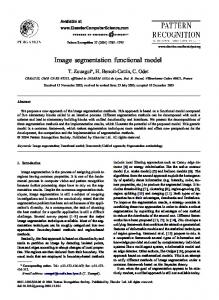
Fig. 1. Color statistics of natural image and clip-art image. (a) A natural image. (b) RGB distribution of colors in the natural image. (c) RB histogram (RGB histograms projected upon the RB axis) of the natural image. (d) A clip-art image. (e) RGB distribution of colors in the clip-art image. (f) RB histogram of the clip-art image. (For interpretation of the references to color in this figure legend, the reader is referred to the web version of this article.)
image is often generated by an anti-aliased rasterization process. As a result, the color of the edge pixels could be blended by the colors of two or three pixels nearby. These are specific characteristics of clip-art images, which could be important cues for segmentation. Segmenting clip-art images often serves as an important step in many applications. From the segmentation map, it is possible to identify regions of interest and objects in the scene, which is beneficial to subsequent clip-art image processing such as vectorization [1,2], colorization [3,4], cartoon character retrieval [5,6], computer-assisted painting of cels [7,8], and cartoon animation compression [9,10]. Notably a vector form may be sometimes better for representing a clip-art scene, but in many of the above applications, further vectorizing the image may complicate the problem but provide little advantage. To say the least, vectorizing a clipart image still need a segmentation step, because most effective vectorization approaches just segment an image into regions before the subsequent steps can be done. Unlike general image segmentation, there tend to be stricter requirements for clip-art image segmentation. On the one hand, high precision is often required when segmenting a clip-art image. The specificity of the clip-art contents makes the false segments more noticeable in simple clip-art scenes than in natural images. Even a small mistake made by segmentation could result in poor visual quality. Take the segmentation result in Fig. 10(d) for example, the small over-segmented strokes are striking in the simple and clean segmentation map. Indeed, these artifacts also constitute a serious problem for a subsequent process such as image vectorization. On the other hand, efficiency of the segmentation is also important, as the above applications are sometimes running on a mobile device, or expected to be an interactive work-flow with short waiting time. For example, one may want to import a raster clip-art image into a document/canvas as a vector element for high-quality display or further editing. If image segmentation (a time-consuming step of raster-to-vector conversion) can be instantly done, then the user does not have to wait for a few seconds or even minutes before any subsequent process, and hence the work flow becomes much smoother and more productive. Consequently, high accuracy and efficiency are generally both required in many applications, which is intrinsically difficult to be accomplished simultaneously. We are going to provide a solution for this problem in this paper.
There indeed exist several segmentation approaches specific to clip-art images [1,3,2]. Detailed review could be found in the next section. To the best of our knowledge, the current state-of-theart method for high quality clip-art image segmentation is VectorMagic [1], especially for those images where the color of each region is uniform. The key to their success is an anti-aliased generative model that effectively captures the characteristics of a large proportion of clip-art images. However, these methods are still not sufficient for our purpose. They often operate on a few seconds or even minutes basis to balance accuracy and overhead computation, which is not fast enough for interactive purposes. Some other approaches (e.g. [11]) are fast, but these fall into general image segmentation category. Such methods merely take characteristics of clip-art images into account, and tend to suffer from unsatisfactory accuracy when segmenting a clip-art image. Therefore, none of the existing methods are suitable for our purpose. To develop a fast and accurate algorithm, one natural way is to speed up the method based on an anti-aliased generative model since the most accurate algorithm relies on such a model. However, it is not an easy task. The reason is that the anti-aliased generative model is typically used in a Bayesian framework and inevitably lead to an optimization of a cost function that is computationally expensive [1]. Unless a major revision to such a model is made, it is difficult to significantly reduce the computational cost. Therefore, to solve our problem, the key issue might be devising a novel method without costly optimization algorithm while grasping the essence of the anti-aliased generative model. This is also the main challenge in the present work. In this paper, we aim to address the above challenge, and propose a fast yet accurate method, ECISER (Efficient Clip-art Image SEgmentation by Re-rasterization), for segmenting a clip-art image. It takes advantage of the particular nature of clip-art images, and segments the image by re-rasterization. Our method is typically more than 10 times faster than the state of the art approach (i.e., Vector-Magic), while the segmentation quality of both methods is almost the same. The main contributions of this paper are the following: 1. To the best of our knowledge, we are the first one to reveal the relationship between clip-art image segmentation and aliased rasterization, and convert the image segmentation
M. Yang, H. Chao / Computer-Aided Design (
into the problem of re-rasterization. Even further, we propose an effective and efficient way to solve the latter problem. It is worth mentioning that the proposed method for re-rasterization might be also used for super-resolution other than segmentation. 2. Based on the re-rasterization, a complete practical segmentation algorithm, ECISER, is developed towards achieving fast and accurate segmentation. Like current state-of-art approaches for clip-art image segmentation, it could effectively avoid results containing small over-segmented regions along object boundaries while preserving other details. But the computation cost of the proposed algorithm is significantly reduced, which enables more applications such as interactive cartoon animation processing and mobile clip-art image editing. 3. As a byproduct of the first contribution, we propose a simple yet effective approach for obtaining ground truth labeling of clip-art image segmentation. More specifically, the labels are fully automatically derived from the vector images. This method works well for clip-art segmentation labeling because clip-art image segmentation is closely related to aliased rasterization. Based on such a method, we also present a database of clip-art images segmented by pixel labels. This database is to be made available to the public1 in the hope that we can place the problem of clip-art image segmentation on firm, quantitative ground. The remainder of the paper is organized as follows. In Section 2, we introduce some related work. Section 3 gives a rethinking of clip-art image segmentation, and converts the original segmentation problem into a problem of re-rasterization. Section 4 describes the approach for re-rasterization without anti-aliasing. Based on this method, Section 5 develops the proposed segmentation algorithm, ECISER. To evaluate ECISER, Section 6 presents the way to construct a database of segmented clip-art images, followed by experimental results with comparison to state-of-the-art methods in Section 7. Finally, we draw conclusions and give further discussion in Section 8. 2. Related work Image segmentation is one of the most challenging problems in computer vision, even if for clip-art images. Many researchers have done a lot of work in this area for years. We first analyze why those widely used segmentation techniques are unsuitable for our purpose, and then, we will show the reason why we finally developed a novel segmentation algorithm. In general, existing segmentation techniques could be divided into three categories: (1) feature-space based techniques; (2) image-domain based techniques; and (3) physics based techniques. In the following, we will analyze methods in these categories in terms of accuracy and efficiency. Feature-space based techniques. Segmentation approaches in this category are typically based on histogram thresholding [12,13] or cluster analysis [14,15]. They work well in a certain feature space. Thus the regions resulting from these methods are expected to be homogeneous with respect to the characteristics represented in these spaces. However, there is no guarantee at all that these regions also show spatial compactness, which is also an important desirable property in clip-art image segmentation applications beside homogeneity. As a result, the main problem of these methods is connected with over-segmentation for clipart image. Lots of work has been done on region merging, which performs suppression of this artifact (see e.g. [16]). However most
1 See http://ECISER.tk.
)
–
3
of the successful methods take advantage of user intervention. Unsupervised region merging algorithms are usually difficult to implement and introduce unacceptable time complexity. Image-domain based techniques. Split-and-merge techniques (e.g. [17]), region growing techniques (e.g. [18]), and edge based techniques (e.g. [19,20]) fall into this category. In contrast to feature-space based methods, image-domain based segmentation approaches cluster pixels exclusively on the basis of their spatial relationships. The resultant segmentation map is likely to be with regions spatially well connected but with no guarantee that these regions are also homogeneous in a certain feature space. Therefore, classical algorithms in this category also suffer from low accuracy of clip-art image segmentation. Recently, an edge based method, Trapped-Ball [2], and another image-domain based method, Vector-Magic [1], take advantage of the characteristics of clip-art images, and make significant progress in terms of result quality. Trapped-Ball is superior to Vector-Magic in dealing with regions with complex colors rather than uniform ones. Another recently proposed method [21] also performs pixel grouping in a cartoon-like image. However, it is designed for aliased images and hence probably fails when the input image is anti-aliased, which is often the case for clip-art images. In this paper, we mainly focus on segmenting regions with uniform color in an anti-aliased clipart image. To the best of our knowledge, Vector-Magic generally produces the most precise segmentation of this kind of image. Because it can effectively model the anti-aliased rasterization process of clip-art vector images, and hence exploit more information to resolve ambiguities arising from segmentation. However, this approach involves a computationally expensive optimization, which makes the algorithm inefficient. Therefore it is still not suitable for our purpose. Physics-based techniques. Techniques in this category typically analyze how light interacts with colored materials and introduce models of this physical interaction in the segmentation algorithms (e.g. [22]). The aim of these methods is to overcome segmentation errors arising from highlights and shadows of the objects, which are rare when segmenting a clip-art image. Another interesting algorithm [23] combines depth and color information to improve image segmentation. However, depth information is obviously unavailable in our case. Therefore, the improvement made by these methods is limited for segmenting clip-art images, and hence we do not consider such physical models in our approach. In summary, all existing techniques in these three categories could not fully meet both fast and accurate requirements for clipart image segmentation. Moreover, our problem is not able to be solved by simply extending or combining these techniques. Consequently, we are going to dig in a different way and seek for a novel approach to segment a clip-art image in an efficient and effective manner. We will take advantage of both feature-based techniques and image-domain based techniques. Therefore color homogeneity and spatial compactness will be both considered in our approach. Details of the proposed method will be given in the following sections. 3. Rethinking clip-art image segmentation As stated in previous sections, traditional ways are not appropriate for fast and accurate clip-art image segmentation. This motivates us to rethink from a different aspect of image segmentation. In this way, we will somehow take advantage of the nature of clip-art images to reduce the computational cost, and to resolve ambiguities arising from segmentation. In this section, the specific characteristics of clip-art images will be analyzed first. Then the problem of clip-art image segmentation will be converted to a problem of re-rasterization based on such analysis.
4
M. Yang, H. Chao / Computer-Aided Design (
Fig. 2. Relationship between image segmentation and aliased-rasterization. (a) Input image. (b) Segmentation labels. (c) Vector version of input image (probably unavailable). (d) Aliased rasterization result of the vector image. (For interpretation of the references to color in this figure legend, the reader is referred to the web version of this article.)
3.1. Characteristics of clip-art images
)
–
image. Such artifacts often arise from blending edge pixels resulting from an anti-aliased rasterization process. Therefore, it is the anti-aliased edges that make precise segmentation much more difficult and ambiguous. In other words, if the edges are ‘‘crisp’’ like the one in Fig. 2(d), the segmentation process could be undoubtedly much easier (compare Fig. 2(b) with Fig. 2(d), the segmentation labels are closely related to the result of aliased rasterization). Based on the above analysis, we would seek a way to make the blurry edges to be jagged and pixel-aligned before partitioning the image into regions. Such crisp edges could be generated by an aliased rasterization process if the vector version of the clip-art (e.g., Fig. 2(c)) is available. The reason is that rasterization without anti-aliasing simply assigns to each pixel the color of the shape that the point at the center of the pixel lies in. This all-or-nothing approach means that even a pixel that is actually split into several shapes of different colors is only assigned the color of a single shape that happens to contain the point at the geometric center of the pixel. Although the resultant stair-stepping appearance (Fig. 2(d)) is undesired in most cases of image displaying, such an effect is exactly what we want in the context of recovering the aliased version of edges. Consequently, re-rasterizing the original vector image would be a potential solution to anti-aliased edge removal, and hence an alternative way to precisely segment a clip-art image. To the best of our knowledge, this would be a completely new perspective on clip-art image segmentation. However, the vector image of clip-art is generally unavailable. And image vectorization, as is well known, is even more difficult. Therefore the remaining problem is exploring a novel approach to perform aliased re-rasterization on a clip-art image that is already rasterized with anti-aliasing. Details will be given in Section 4.
A clip-art image is intrinsically different from a natural image. It often originates from an anti-aliased rasterization process for a vector image. As is well known, anti-aliased rasterization algorithms typically assign to a pixel a color that is the weighted average of all the shapes that make up that pixel. Here, each weight is the portion of the pixel’s area that belongs to each shape. Take the pixel P in Fig. 2 for example, the boundary between the green shape and the black shape slices through the pixel P such that 60% of P belongs to the green shape and 40% of P belongs to the black shape (Fig. 2(c)), then the rasterized pixel would be colored as 0.6 ∗ green + 0.4 ∗ black, which should turn out to be some shade of darker green (Fig. 2(a)). Consequently, a clip-art image has the following specific characteristics:
4. Re-rasterization without anti-aliasing
1. There are a relative small number of shape colors in a clip-art image, each of which is indeed the color of a shape in the corresponding vector image. For example, there are just four shape colors in the clip-art image shown in Fig. 1(d). Therefore four clusters are presented in Fig. 1(e), compared with numerous clusters in Fig. 1(b). 2. Each pixel is colored by convex combination of these shape colors. The combination weight of each shape color is proportional to the coverage of the shape. The clear lines as well as a few points inside the triangle in Fig. 1(f) indicate such a property.
1. How to find all shape colors of the raster input image? 2. Which of the shape colors should be assigned to a given pixel?
All these characteristics, in some sense, provide additional prior knowledge that could be leveraged to segment a clip-art image more precisely and efficiently. Therefore in the following, we would reformulate the problem of clip-art image segmentation and develop our approach based on these characteristics. 3.2. Segmentation by re-rasterization As stated in Section 2, over-segmentation is the common problem of most existing methods when segmenting a clip-art
The segmentation issue has been reformulated as a problem of re-rasterizing clip-art image without anti-aliasing in the previous section, we will discuss it and present a novel method to solve the problem in this section. As we all know, the vector form of the clip-art is unavailable in most cases, we need to accomplish such re-rasterization in a different way. Note that aliased rasterization is all about looking for an appropriate shape color for each pixel. Instead of traditionally inferring each pixel value from an informative vector image, it could be done in an alternative way: picking a shape color for each pixel based on the underlying information from the raster data. Thereby the remaining problems are:
We will show that these two issues are non-trivial, and give our solution in the following. 4.1. Shape color identification It is often the case that shape colors are not given as input. Hence we need to find all shape colors before determining which should be assigned in turn to a certain pixel. A natural way to identify such colors is based on color statistics. However, this could be ambiguous when the pixels with a specific blending (or noise) color are more than those with an ordinary shape color. For instance, if there is a small gray dot in a large rectangle with purple boundary (Fig. 3(a)), then the light purple pixels resulting from anti-aliasing would be even more than the gray pixels. In this context, any approaches based on simple color statistics (Fig. 3(b)) probably consider light purple rather than gray as a shape color.
M. Yang, H. Chao / Computer-Aided Design (
a
)
–
5
b 250 200 150 100 50 0
0
50
100
150
200
250
Fig. 3. Ambiguity arises when simple color statistics is used to identify colors of various types of shapes. (a) An image containing three different types of shapes. (b) RB histogram of the image. (For interpretation of the references to color in this figure legend, the reader is referred to the web version of this article.)
To avoid such blending colors or noises being considered as ordinary shape colors, spatial information should be cooperated to disambiguate the types of pixels. As is mentioned before, the pixel values of a clip-art image generally result from rasterization of some vector shapes. If the color of a shape is constant, then there would be probably a local image patch where all pixels are assigned with the color of that shape. Conversely, if there is a local patch where all pixels have the same color, then the color is very likely to be a shape color. Based on the above analysis, we propose a window-based method of shape color identification for a clip-art image. More specifically, we use a sliding window with a specific size (will be discussed later) to scan the entire image. If all pixels inside a window have exactly the same color c ∈ R3 , then c would be identified as a shape color of this image. After this process, there would be a number of N different identified shape colors. We denote the set of shape colors by C = {ci }Ni=1 for convenience in the subsequent discussion. This approach should work well in most cases if an appropriate window size is chosen. According to the mechanism of image rasterization, a blending region arising from anti-aliased rasterization is almost always thinner (typically 1–2 px width) than a meaningful shape. If the size of the window is neither too large to mistakenly capture the color of the blending region, nor too small to omit the color of an ordinary shape, then all shape colors would be identified and all identified colors are shape colors. Moreover, as the pixels inside a window that satisfies the above condition are typically internal pixels of a shape, the color of these pixels is extremely likely to be the exact color of the shape. Therefore, the shape colors can be not only found but also estimated precisely. Now we discuss the size of the sliding window mentioned above. For a reliable estimate of the shape color, a window must be large enough to have sufficient confident to determine if it is completely inside the shape. But on the other hand, a window must be small enough to identify the color of a tiny shape (e.g., gray dot in Fig. 3(a)). Thus as the window size is increased from small to large, the results range from complete but inaccurate shape colors to accurate but incomplete shape colors. To find the golden trade-off where shape colors are both accurate and complete, we conduct the following experiment. First, we collect a set of clip-art images with both raster form and vector form.2 Next, we use various sizes of sliding windows to perform
2 These images are collected in the early phase of this research project, and are used only for determining the best window size and confirming an observation described in Section 4.2. Remarkably, this dataset is much smaller than (and hence is quite different from) the one used for evaluating segmentation (presented in Section 6).
Fig. 4. Precision and recall for different window sizes.
shape color identification for each raster image, and evaluate the performance of each window size. We evaluate the performance in terms of precision and recall with different window size in order to select the right one. Note that the vector content of each clip-art provides all ground truth shape colors C T . Let CsE be all estimated shape colors resulting from the window size s. Then for each clip-art, we define the precision as precision =
|C T ∩ CsE | |CsE |
and the recall as recall =
|C T ∩ CsE | . |C T |
The resultant average precision and average recall for each window size are shown in Fig. 4. From the experimental results, we can conclude that 3 × 3 is the best size for the window because it would result in a sufficient high precision that a larger window would not make significant improvement, as well as a relative acceptable recall. Consequently, we will apply the fixed window size 3 × 3 in our segmentation approach. 4.2. Pixel re-colorization Given a set of shape colors found in Section 4.1, the next step of re-rasterization is assigning to each pixel an appropriate shape color. We will explain the detail of this process in the following. Ideally, the best shape color to be assigned to a given pixel should be the one that its corresponding shape takes the largest proportion of the pixel. However, we have no idea which shape colors take part in blending the pixel color, and what the blending weights are. This is different from general image rasterization, as the shape information in our case is unavailable. Thereby we need to infer such information from the only available data, i.e., the input image. In general, the color of each pixel in a clip-art image can be approximated by a convex combination of shape colors. Of course, the number of shape colors that actually partake in blending a pixel tend to be small. In other words, if there are many combinations that give rise to the same color, then the one with the least shape colors is preferred. To find such a combination, an intuitive way is to assume that all shape colors take part in blending the pixel, and hereby estimate the blending weights of the shape colors, subject to the constraint that the blending weight vector is sparse. It would result in a constrained sparse decomposition problem: Given the
6
M. Yang, H. Chao / Computer-Aided Design (
a
b
)
–
c
Fig. 5. Statistics of errors using different number of colors to blend a pixel in clip-art images. (a) Using a single color; (b) Using two colors; (c) Using three colors. (For interpretation of the references to color in this figure legend, the reader is referred to the web version of this article.)
a
b
Fig. 6. Pixel re-colorization. (a) Path for searching related shape colors. (b) Blending weight estimation.
color cP of a pixel in the input image, the best blending weights
w = {wi }Ni=1 would be 2 N 1 ∗ wi ci + λ∥w∥1 w = arg min cP − w 2 i=1 2
subject to N
wi = 1,
wi ∈ [0, 1], i = 1, . . . , N .
i =1
Here ci and wi denote a shape color and its blending weight, respectively. ∥w∥1 is the sparsity-inducing term, and λ is a slack variable that balances the trade-off between fitting the pixel color perfectly, and employing a sparse solution for blending coefficients. However, solving the above optimization problem for all pixels is computationally expensive. Therefore we need to estimate the weights in a fast manner to meet our requirements. We observe that in a typical clip-art image, most pixel colors are either shape colors, or blended by two or three colors. To confirm such observation, another experiment is conducted on the above clip-art image dataset: We try to recreate the color of each pixel by assigning any shape color (Fig. 5(a)), blending with any pair of shape colors (Fig. 5(b)), and blending with any triple of shape colors (Fig. 5(c)), respectively. Then we analyze the errors corresponding to the best individual shape color, the best pair, and the best triple. Results show that almost all pixels could be approximated by at most a triple of shape colors with negligible error. Based on the above observation, we only consider three special cases when estimating the blending weights: Case 1. The pixel color could be approximated by a single shape color. This is the case where the pixel lies in the internal region of a shape. Most pixels in a typical clip-art image fall into this category. To efficiently find the best shape color for the pixel, we build a k-d tree for all shape colors at the beginning. Then given a pixel color, we search for a nearest shape color using the k-d tree. It is
an O(log N ) operation [24], which is extremely fast even when the number of shape colors is large. Case 2. The pixel color could be approximated by blending with two shape colors. Most boundary pixels correspond to this case. To find the two shape colors, we first examine if any neighbor pixel color is close to a shape color using the above k-d tree. The searching path is illustrated in Fig. 6(a). When two different neighbor pixel colors are found satisfying the condition, the searching would be terminated immediately. Let the two shape colors be cA and cB respectively. Then the corresponding blending weights would be wA and 1 −wA , where
wA =
(cP − cA )T (cB − cA ) . ∥cB − cA ∥2
The approximation error would be
ϵ = ∥cP − cA ∥2 − wA2 ∥cB − cA ∥2 . An illustration of these two terms is given in Fig. 6(b). Case 3. The pixel color could be approximated by blending with three shape colors. This is a rare case, generally occurring at T-junction of boundaries. The three shape colors could be found in a way similar to Case 2. Let the three shape colors be cA , cB , and cC respectively. Then the corresponding blending weights would be wA , wB , and 1 −wA −wB , where c22 c13 − c23 c12
wA = wB =
c12 c21 − c11 c22 c23 c11 − c13 c21 c12 c21 − c11 c22
,
.
Here c11 = (cA − cC )T (cA − cC ), c12 = (cA − cC )T (cB − cC ), c13 = (cC − cP )T (cA − cC ),
M. Yang, H. Chao / Computer-Aided Design (
)
–
7
c21 = (cA − cC )T (cB − cC ), c22 = (cB − cC )T (cB − cC ), c23 = (cC − cP )T (cB − cC ). Obviously, all these three cases can be solved efficiently. Therefore, the proposed re-rasterization algorithm should be very fast. It is worth mentioning that although the above re-rasterization is designed for segmentation, it might be used in image superresolution as well. More specifically, with the estimated shape colors and blending information of each pixel, it would be easier to reliably infer the sub-pixel structures, and hence to provide effective super-resolution image reconstruction for clip-art images. 5. Segmentation based on re-rasterization In this section, we will present the details of our ECISER algorithm. Generally speaking, it involves two main steps: re-coloring for all pixels, and grouping similar pixels into regions. With the help of the re-rasterization proposed in Section 4, segmentation of clip-art images would be much easier. However, there are still two issues to be considered in practice: 1. Although carefully designed for speed, re-colorization still seems to dominate the time complexity of the whole pipeline. How to apply a strategy for re-colorization to further reduce the overall computational cost? 2. Given the re-rasterized image, how to efficiently group similar pixels into regions? We will discuss these two issues and give our solution in the following. 5.1. Efficient re-colorization Efficiency-oriented pipeline for re-colorization. As is analyzed in Section 4.2, there would be generally three possible cases of re-coloring a pixel. It is impractical to consider all these cases for every pixel. Moreover, the computational costs of three cases are indeed different. In this present work, we will seek to find a strategy that could reduce the overall computational cost here. More specifically, we would consider computationally less expensive operations first. By making those operations earlier, the space of possible cases is made smaller during the later phases in which expensive operations are considered. The phases are as follows Phase 1: Find all pixels that have an exactly same or very similar color to a shape color. Such pixels should be undoubtedly assigned with that shape color. Pixels in this category often make up a very large number of the pixels in a typical clip-art image, and recolorization of such pixels is very computationally inexpensive. Phase 2: Find the remaining pixels that could be approximated by blending with two shape colors. This is a little more expensive. However, by this point the total number of such pixels is substantially reduced, making it less expensive than it would be if the previous phase had not been used. Phase 3: Find the remaining pixels that could be approximated by blending with three shape colors. Re-coloring these pixels is fairly expensive. However, such pixels would be very few since almost all pixels had been processed in previous two phases. Cache mechanism for re-colorization. To further speed up re-colorization, we adopt a cache mechanism. More specifically, we store estimated blending weights for frequently queried color combination. Thereby if a cache hit, the algorithm immediately reads the results without additional computation; if a cache miss, the cache allocates a new entry. Moreover, we keep track of the last queried color combination so that we always try this combination first when re-coloring the next pixel. To evaluate the computational impact that such mechanism has on the proposed
Fig. 7. Histogram of speedup when using a cache mechanism in our algorithm.
algorithm, we segment the clip-art images in the database presented in Section 6 with and without cache mechanism respectively, and calculate the speedup, i.e., the ratio of the execution time without a cache mechanism and the one with a cache mechanism, for each case. From the histogram of such speedup (Fig. 7), we can see that the cache mechanism provides a 2–4× speedup for a large proportion of the test images. 5.2. Grouping similar pixels After re-colorization, pixels belonging to the same shape would appear almost the same in color. To robustly and efficiently group such pixels into a region, we adopt a graph-based method [11]. Let G = (V , E ) denote an undirected graph to represent the rerasterized image, in which the vertexes v ∈ V represent the pixels in the image. Each edge (vi , vj ) = e ∈ E has a weight w(vi , vj ) to indicate the dissimilarity between pixels. The grouping process is to partition V into regions {R}, in which each region R corresponds to a sub-graph G′ = (R, E ′ ) where E ′ ⊆ E. The internal difference of a region R is defined as the largest weight in the minimum spanning tree MST(R, E ′ ) of the sub-graph G′ = (R, E ′ ), i.e. Int(R) = maxe∈MST(R,E ′ ) w(e). Then, the minimal internal difference of R1 and R2 is also defined by appending a tolerance τ (R) for each region R: MInt(R1 , R2 ) = min(Int(R1 ) + τ (R1 ), Int(R2 ) + τ (R2 )), in which τ (R) = k/|R|, where |R| denotes the size of R and k is a parameter. The region distance between R1 and R2 is defined as the minimal edge weight between the two regions: D(R1 , R2 ) =
min
vi ∈R1 ,vj ∈R2 ,(vi ,vj )∈E
w(vi , vj ).
The algorithm begins from initializing each pixel as a region. Then two regions with the smallest region distance, represented by R∗1 and R∗2 , will be merged if D(R∗1 , R∗2 ) ≤ MInt(R∗1 , R∗2 ). If successful, repeat the merging process of the regions with the next smallest region distance. The algorithm will stop if two regions cannot be merged. Then, the remaining regions are the results of the segmentation. 6. Automatic labeling of ground truth segmentation dataset To conduct quantitative evaluation of clip-art image segmentation methods, we need a clip-art image dataset with ground truth segmentation. Manual annotation of a large number of images is too time-consuming, hence in this section we will seek for an automatic way to build up such database. There already exist several datasets for evaluating general image segmentation, such as BSDS300 [25], BSDS500 [20], SBD [26], MSRC [27], and VOC2012 [28]. However, most images contained in
8
M. Yang, H. Chao / Computer-Aided Design (
)
–
a
b
c
d
e
f
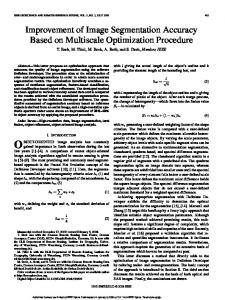
Fig. 8. Qualitative comparison. (a) Input (b) Trapped-Ball’s result (c) Vector-Magic’s result (d) Felz–Hutt’s result (e) Mean-Shift’s result (f) Our result. (For interpretation of the references to color in this figure legend, the reader is referred to the web version of this article.)
these dataset are natural images, which are intrinsically different from clip-art images. To quantitatively evaluating clip-art image segmentation, one could make another dataset by hand-labeling a set of ground-truth segmentations for clip-art images. However, this method has two disadvantages: (1) the ground-truth might be inaccurate, as the data are labeled based on human intuition; (2) labeling a large set of images is fairly laborious. To overcome the above disadvantages, we propose a fully automatic way for constructing clip-art image segmentation dataset for evaluation. It takes advantage of the particular characteristics of clip-art image segmentation: it is a well-defined problem if a vector format of the image is available. In other words, there would be a unique ground-truth segmentation of an image given the vector content of that image. This enlightens us to infer such segmentation from the vector image. More specifically, we first extract all shape boundaries from the vector image, and then label each pixel in the raster image according to these boundaries. There are two cases to be considered. First, if a pixel is completely contained within a vector shape, then the pixel should be given a label corresponding to that shape. Second, if a pixel is covered by two or more shapes, then the pixel should be assigned to whichever shape contains the center of the pixel. Such strategy is identical to some sort of aliased image rasterization. Based on the above consideration, we first convert the boundary of each shape present in the vector image into a polygon, then use [29] to test if the center of a pixel in the raster image lies inside or on the polygon. If it does, then the pixel would be assigned to a label corresponding to that shape. After all pixels are labeled in such a way, a ground truth segmentation for a clip-art image would be created. In the present work, we collect a set of clip-art images that are released into the public domain. Each clip-art has both raster format and vector format available, and would be labeled in the above way. As a result, we have compiled a dataset, currently containing more than 10 000 clip-art images along with ground truth segmentations against which the output of any clip-art image segmentation algorithm may be compared. 7. Experimental results To show the efficiency and effectiveness of the segmentation approach developed in this paper, we quantitatively and qualita-
tively compare ECISER against several other widely used segmentation approaches in terms of accuracy and efficiency. Methods to be compared. It is worth noting that we are not targeting at designing the best clip-art segmentation algorithm with highest accuracy; instead, we aim at speeding up the stateof-the-art algorithm from the algorithm perspective without (if any) much degradation of performance. We restrict our comparisons to four alternative segmentation algorithms: TrappedBall [2], Vector-Magic [1], Felz–Hutt [11] and Mean-Shift [30]. Trapped-Ball and Vector-Magic were chosen because they are the current state-of-the-art approaches for clip-art image segmentation. For comparisons with general image segmentation methods, we chose Felz–Hutt and Mean-Shift. Indeed there are many other general image segmentation algorithms, we only consider two representative methods because approaches in this category are generally not specific to clip-art segmentation and probably result in unsatisfactory segmentations for clip-art images. Dataset for testing. We compare these methods on the dataset presented in Section 6. Most of the images in the dataset are clipart images with uniformly colored regions. Note that a clip-art image might contain regions with gradient colors, which could be perfectly segmented by Trapped-Ball. However, we mainly focus on segmenting regions with uniform color in this paper, as a large proportion of clip-art images fall into this category and it still lacks a fast and accurate algorithm for such seemingly simple segmentation tasks. Parameter settings. ECISER is a fully automatic segmentation approach that takes no parameters. However, the methods to be compared to such as Trapped-Ball, Felz–Hutt and Mean-Shift require some parameters. We set the parameters of each of these methods once, and used the same parameters to process all test images. The parameters were chosen so that the resulting segmentations would compare most favorably with regard to our own results. 7.1. Qualitative comparisons To qualitatively compare ECISER with others, we provide a few results obtained by ECISER as well as other methods. From the comparison shown in Figs. 8–11, we can see our results, in general, are as good as (or even better in some cases) those of the state-ofthe-art method, Vector-Magic in terms of quality.
M. Yang, H. Chao / Computer-Aided Design (
)
–
a
b
c
d
e
f
9
Fig. 9. Qualitative comparison. (a) Input (b) Trapped-Ball’s result (c) Vector-Magic’s result (d) Felz–Hutt’s result (e) Mean-Shift’s result (f) Our result.
a
b
c
d
e
f
Fig. 10. Qualitative comparison. (a) Input (b) Trapped-Ball’s result (c) Vector-Magic’s result (d) Felz–Hutt’s result (e) Mean-Shift’s result (f) Our result.
More specifically, it is clear that the boundaries of regions produced by ECISER and Vector-Magic agree more closely with the boundaries of salient image regions. Both of these method could effectively avoid over-segmentation along object boundaries, while preserving meaningful regions at different scales. In some cases, our results are even superior, though not significantly, to Vector-Magic’s. For example, Vector-Magic tends to generate a bolder segment for a declining stroke-like region since they restrict a segment to be a 4-connected region. It works well in most cases (like red strokes in Fig. 8(c)), except where two regions are very close to each other (see the misjoined regions in Fig. 9(c)). Other methods typically generate segmentations of lower quality than ECISER and Vector-Magic. For instance, Felz–Hutt might suffer from over-segmentation along object boundaries (see Figs. 8(d) and 10(d)), while losing small semantic regions (see Fig. 9(d)). Note that even tuning the parameters could hardly avoid these two unwanted effects at the same time.
The above visual inspection of the results offers compelling evidence that our segmentations are comparable with those resulting from the current state-of-the-art methods in terms of quality. To validate these results and demonstrate the efficiency of our approach, a quantitative evaluation of ECISER against other methods will be presented in the following. 7.2. Quantitative comparisons To quantitatively evaluate the effectiveness of the above segmentation algorithms, we use several standard measures, namely the Probabilistic Rand Index (PRI) [31], the Global Consistency Error (GCE) [25], and the Boundary Displacement Error (BDE) [32]. Probabilistic Rand Index. The Probabilistic Rand Index (PRI) counts the fraction of pairs of pixels whose labeling is consistent between the computed segmentation and the ground truth. Since
10
M. Yang, H. Chao / Computer-Aided Design (
)
–
a
b
c
d
e
f
Fig. 11. Qualitative comparison. (a) Input (b) Trapped-Ball’s result (c) Vector-Magic’s result (d) Felz–Hutt’s result (e) Mean-Shift’s result (f) Our result.
Fig. 12. PRI of different segmentation methods w.r.t. image size.
Fig. 13. GCE of different segmentation methods w.r.t. image size.
a single image in our dataset corresponds to an individual ground truth segmentation, we do not have to average across multiple ground truth segmentations to account for scale variation in human perception. Therefore the PRI in our case is equivalent to the Rand Index measure. As the value of PRI and the size of the segmentation map are generally related, we divide the entire image size range of our dataset into several intervals, and compute average PRI of the segmentation maps that fall into each interval. The average PRI w.r.t. image size resulting from each segmentation approach being compared is shown in Fig. 12. Note that PRI ranges between [0, 1], higher is better. It can be seen that our segmentation results have almost the same PRI as that of Vector-Magic. The PRI of the two general image segmentation approaches is relative low, because they do not directly model regions with constant color. Global Consistency Error. The Global Consistency Error (GCE) measures the extent to which one segmentation can be viewed as a refinement of the other. Fig. 13 shows the average GCE w.r.t. image size resulting from different segmentation approaches. Note that GCE ranges between [0, 1], lower is better. It can be seen that ECISER, Vector-Magic and Trapped-Ball all produce results with much lower GCE than other approaches. Although Trapped-Ball suffers from over-segmentation more often than Vector-Magic,
the performance of these two methods is almost the same here, because GCE does not penalize over-segmentation at all, i.e., the highest score could be achieved by assigning each pixel as an individual segment. Boundary Displacement Error. The Boundary Displacement Error (BDE) measures the average displacement error of boundary pixels between two segmented images. It defines the error of one boundary pixel as the distance between the pixel and the closest pixel in the other boundary image. BDE ranges between [0, ∞) in the unit of pixels, lower is better. From the average BDE w.r.t. image size resulting from different segmentation approaches (shown in Fig. 14), we can see that ECISER is slightly superior to TrappedBall and Vector-Magic. Similar to GCE, BDE also penalizes undersegmentation more heavily than over-segmentation. Therefore the performance of Trapped-Ball and Vector-Magic is almost the same in terms of BDE. To summarize the quantitative comparison in terms of accuracy, ECISER and other methods specific to clip-art images generally produce better segmentations compared with the general image segmentation methods. Though ECISER is not a clear winner in terms of the above three indexes compared with the state-ofthe-art clip-art segmentation approaches, we show that ECISER is much more efficient in the next subsection.
M. Yang, H. Chao / Computer-Aided Design (
)
–
11
were measured on a 2.53 GHz CoreTM 2 Duo machine. It is clear that ECISER runs much faster (typically more than 10 times faster) than the state of the art method, i.e., Vector-Magic. Felz–Hutt is also extremely efficient, but produces clip-art segmentation of unsatisfactory quality in general. Consequently, ECISER achieves dramatic computational speedups over the current state-of-the-art approaches, while preserving almost the same quality of results. 8. Conclusion
Fig. 14. BDE of different segmentation methods w.r.t. image size.
Fig. 15. Average running time of different segmentation approaches w.r.t. image size. Notice that the y-axis is in logarithmic scale.
7.3. Efficiency comparisons To show the efficiency of ECISER, we illustrate the average time w.r.t. image size using different approaches (Fig. 15). These times
In this paper, we have proposed a novel approach for clip-art image segmentation. Different from other methods, the proposed approach segments an image into regions by re-rasterizing the image, which takes full advantage of characteristics of clip-art images. Both quantitative and qualitative experimental results show that ECISER is typically comparable to the current state-of-the-art methods in terms of segmentation quality, but takes much less computation time. However, there still exist some limitations in our method. First, we assume the color of each region in the image to be uniform, which is not always the case in clip-art images. For non-uniform color (e.g. gradient color) regions, ECISER would suffer from oversegmentation (Fig. 16(d)). In contrast, Trapped-Ball can handle this case well as they use a more complex color model for each segmented region. Second, although ECISER is robust to noise in high quality JPEG images, the segmentation quality would be degraded rapidly as the images become noisier (Fig. 16(e)). Third, low-resolution images consisting of complex shapes might be also poorly segmented due to the ambiguities present in the observed data and the limited representation ability of pixel-level segmentation map (Fig. 16(f)). As future research, we consider, to a certain extent, addressing the above limitation. To avoid over-segmentation for gradient color regions, the only non-trivial problem is identifying all possible gradient color settings in the input image, since both pixel recolorization and pixel grouping could be easily extended to the case of gradient color regions. To make the algorithm more robust to noise in the input, we consider incorporating an efficient denoising method to pre-process the original image. If efficiency is not important, [33] or [34] should be a good choice.
a
b
c
d
e
f
Fig. 16. Cases producing poor results. First row: input images. Second row: Our segmentation results. (For interpretation of the references to color in this figure legend, the reader is referred to the web version of this article.)
12
M. Yang, H. Chao / Computer-Aided Design (
Acknowledgments We would like to thank the anonymous reviewers for their careful examination of our manuscript and valuable comments. This work was partially supported by NSF of China under Grant 61173081 and Guangdong Natural Science Foundation, P.R. China, under Grant S2011020001215. Appendix A. Supplementary data Supplementary material related to this article can be found online at http://dx.doi.org/10.1016/j.cad.2014.08.011. References [1] Diebel JR, Thrun S. (Adviser). Bayesian image vectorization: the probabilistic inversion of vector image rasterization, Stanford University, 2008. [2] Zhang S-H, Chen T, Zhang Y-F, Hu S-M, Martin RR. Vectorizing cartoon animations. IEEE Trans Vis Comput Graphics 2009;15(4):618–29. ` [3] Sykora D, Buriánek J, Žára J. Unsupervised colorization of black-and-white cartoons. In: Proceedings of the 3rd international symposium on Nonphotorealistic animation and rendering. ACM; 2004. p. 121–7. [4] Irony R, Cohen-Or D, Lischinski D. Colorization by example. In: Proceedings of the sixteenth eurographics conference on rendering techniques. Eurographics Association; 2005. p. 201–10. [5] Haseyama M, Matsumura A. A trainable retrieval system for cartoon character images. In: Acoustics, speech, and signal processing, 2003, proceedings, (ICASSP2003), 2003 IEEE International Conference on, Vol. 3.. IEEE; 2003. p. III673-6. [6] Yu J, Liu D, Tao D, Seah HS. On combining multiple features for cartoon character retrieval and clip synthesis. IEEE Trans Syst Man Cybern B 2012; 42(5):1413–27. [7] Seah HS, Feng T. Computer-assisted coloring by matching line drawings. Vis Comput 2000;16(5):289–304. [8] Qiu J, Soon SH, Tian F, Wu Z, Chen Q. Feature and region-based auto painting for 2D animation. Vis Comput 2005;21:928–44. http://dx.doi.org/10.1007/s00371-005-0307-1. [9] Lee WS, Kassim AA. Image and animation cel coding using wedgelets and beamlets. In: Visual communications and image processing 2003. International Society for Optics and Photonics; 2003. p. 1460–9. ` [10] Sykora D, Buriánek J, Žára J. Video codec for classical cartoon animations with hardware accelerated playback. In: Advances in visual computing. Springer; 2005. p. 43–50. [11] Felzenszwalb PF, Huttenlocher DP. Efficient graph-based image segmentation. Int J Comput Vis 2004;59(2):167–81. [12] Shafarenko L, Petrou M, Kittler J. Histogram-based segmentation in a perceptually uniform color space. IEEE Trans Image Process 1998;7(9):1354–8. [13] Guo G, Yu S, Ma S. Unsupervised segmentation of color images. In: Image processing, 1998, ICIP 98, proceedings, 1998, international conference on,. IEEE; 1998. p. 299–302.
)
–
[14] MacQueen J. et al., Some methods for classification and analysis of multivariate observations. In: Proceedings of the fifth Berkeley symposium on mathematical statistics and probability, Vol. 1, California (USA). 1967, p. 14. [15] Shi J, Malik J. Normalized cuts and image segmentation. IEEE Trans Pattern Anal Mach Intell 2000;22(8):888–905. [16] Gorte B. Supervised segmentation by region merging. In: Machine vision and advanced image processing in remote sensing. Springer; 1999. p. 328–35. [17] Liu J, Yang Y-H. Multiresolution color image segmentation. IEEE Trans Pattern Anal Mach Intell 1994;16(7):689–700. [18] Deng Y, Manjunath BS, Shin H. Color image segmentation. In: Computer vision and pattern recognition, 1999, IEEE computer society conference on. IEEE; 1999. [19] Kass M, Witkin A, Terzopoulos D. Snakes: active contour models. Int J Comput Vis 1988;1(4):321–31. [20] Arbelaez P, Maire M, Fowlkes C, Malik J. Contour detection and hierarchical image segmentation. IEEE Trans Pattern Anal Mach Intell 2011;33(5):898–916. [21] Kopf J, Lischinski D. Depixelizing pixel art. In: ACM Transactions on graphics (TOG), Vol. 30. ACM; 2011. p. 99. [22] Shafer SA. Using color to separate reflection components. Color Res Appl 1985; 10(4):210–8. [23] Dahan MJ, Chen N, Shamir A, Cohen-Or D. Combining color and depth for enhanced image segmentation and retargeting. Vis Comput 2012;28(12): 1181–93. [24] Friedman JH, Bentley JL, Finkel RA. An algorithm for finding best matches in logarithmic expected time. ACM Trans Math Software (TOMS) 1977;3(3): 209–26. [25] Martin D, Fowlkes C, Tal D, Malik J. A database of human segmented natural images and its application to evaluating segmentation algorithms and measuring ecological statistics. In: Computer vision, 2001, ICCV 2001, proceedings, eighth IEEE international conference on,. IEEE; 2001. p. 416–23. [26] Gould S, Fulton R, Koller D. Decomposing a scene into geometric and semantically consistent regions. In: Computer vision, 2009 IEEE 12th international conference on. IEEE; 2009. p. 1–8. [27] Silberman N, Hoiem D, Kohli P, Fergus R. Indoor segmentation and support inference from RGBD images. In: Computer vision—ECCV 2012. Springer; 2012. p. 746–60. [28] Everingham M, Van Gool L, Williams CKI, Winn J, Zisserman A. The PASCAL Visual Object Classes Challenge 2012 (VOC2012) Results, http://www.pascalnetwork.org/challenges/VOC/voc2012/workshop/index.html. [29] Haines E. Point in polygon strategies. Graph Gems IV, 994. 1994. p. 24–6. [30] Comaniciu D, Meer P. Mean shift: A robust approach toward feature space analysis. IEEE Trans Pattern Anal Mach Intell 2002;24(5):603–19. [31] Unnikrishnan R, Pantofaru C, Hebert M. A measure for objective evaluation of image segmentation algorithms. In: Computer vision and pattern recognitionworkshops, 2005, CVPR workshops. IEEE computer society conference on. IEEE; 2005. p. 34-34. [32] Freixenet J, Muñoz X, Raba D, Martí J, Cufí X. Yet another survey on image segmentation: Region and boundary information integration. In: Computer vision—ECCV 2002. Springer; 2002. p. 408–22. [33] Xu L, Lu C, Xu Y, Jia J. Image smoothing via l 0 gradient minimization. ACM Trans Graph(TOG) 2011;30(6):174. [34] Dabov K, Foi A, Katkovnik V, Egiazarian K. Image denoising by sparse 3D transform-domain collaborative filtering. IEEE Trans Image Process 2007; 16(8):2080–95.