Edge Inference for Image Interpolation Neil Toronto
Dan Ventura
Bryan S. Morse
Department of Computer Science Brigham Young University Provo, UT 84602 email:
[email protected]
Department of Computer Science Brigham Young University Provo, UT 84602 email:
[email protected]
Department of Computer Science Brigham Young University Provo, UT 84602 email:
[email protected]
Abstract— Image interpolation algorithms try to fit a function to a matrix of samples in a “natural-looking” way. This paper presents edge inference, an algorthm that does this by mixing neural network regression with standard image interpolation techniques. Results on gray level images are presented. Extension into RGB color space and additional applications of the algorithm are discussed.
I. I NTRODUCTION The goal of image interpolation is to infer a continuous function f (x, y) from a given m × n matrix of quantized samples [1]. Though the density and equal spacing of the samples simplifies the mechanics of this process, the human eye is picky—which gives rise to the quest to find techniques that yield ever-more “natural-looking” fits. In machine learning terms, the objective is to find an algorithm with a bias that approximates that of human image interpretation. This paper presents edge inference, an algorithm that uses many simple neural networks to infer edges from blocks of neighboring samples and combines their outputs using bicubic interpolation. The result is a natural-looking fit that achieves much sharper output than standard interpolation algorithms but with much less blockiness. Edge inference is similar to edge-directed interpolation [2], [3], [4], but with a crucial difference. Edge-directed methods regard an edge as a discontinuity between two areas of different value, and use thresholds to determine which discontinuities are significant. They then use the edges to guide a more standard interpolation algorithm. Edge inference regards an edge as a gradient between two areas of different value and uses the gradient as a model of the underlying image, avoiding thresholding altogether. Edge inference may also be regarded as a reconstruction technique. It fits geometric primitives to samples and combines them to produce the final output. Data-directed triangulation (DDT) [5] is similar, with triangles as its geometric primitives. DDT is computationally demanding, and while edge inference produces output that is qualitatively similar to DDT’s, it produces it much more quickly. Edge-directed methods provide sharpness control in a postprocessing stage, and DDT currently provides none. With edge inference, users have control over a sharpness factor: a sliding scale between the output of bicubic interpolation (which is “fuzzy”) and edge inference of any sharpness.
Please note that all matrices are assumed column-major. This is for notational convenience only, as the algorithm works just as well with row-major matrices. II. T HE E DGE I NFERENCE A LGORITHM In short, edge inference performs regression using multiple neural network basis functions, and combines their outputs using a piecewise bicubic interpolant. The image samples are given in an m × n matrix M of gray-level pixel values, normalized to the interval [−1, 1]. Each sample has a location (x, y) and a value Mxy . A. Neural Network Basis Functions An m × n matrix F contains the basis functions, for a oneto-one correspondence with the samples. (This is not strictly necessary, but has given the best results so far.) It may be helpful to think of the neural networks as being placed on the image itself. Figure 1 shows the simple two-layer network that this algorithm uses. Each trains on the sample it is associated with and its eight nearest neighbors (or fewer, if the sample lies on an image boundary). The instances in the training set are in the form (x, y) → Mxs ys where (xs , ys ) is the location of the sample, and (x, y) is the location of the sample relative to the neural network. That is, if (u, v) is the location of the network, x = xs − u, and y = ys − v. Each neural network represents a function in this form: Fuv (x, y) = w4 ∗ tanh(w1 x + w2 y + w3 ) + w5
V w5 w4
1
w1
x
w2
y
w3
1
Fig. 1. The simple two-layer network
(1)
B(x)
0.2
0.3
0.4
0.5
0.6
Figure 2 shows the graphical interpretation of fitting one of these simple neural networks to a 3 × 3 block of samples.
1.0
−0.5
0.5
−1.0
0.0
Value
0.0
0.1
0.5
Y
0.0 −0.5 0.0 X
−2
−1
0
−0.5
1
2
x
0.5
Fig. 3. B-spline kernel function
1.0 −1.0
(a) A 3 × 3 block of samples
(b) 1 ∗ tanh(2x + 2y + 0) + 0
Fig. 2. Fitting to a 3 × 3 block of samples
Unlike with most neural networks, the weights can be interpreted to have specific, geometric meanings. The equation w1 x + w2 y + w3 = 0 gives the orientation of the inferred edge as a line in implicit form. The gradient of Fuv is · ¸ · ¸ ∂Fuv /∂x w1 (1 − tanh2 (w1 x + w2 y + w3 )) ▽Fuv = = ∂Fuv /∂y w2 (1 − tanh2 (w1 x + w2 y + w3 )) Because the steepest slope of tanh(x) is at x = 0, ▽Fuv is at its greatest magnitude when w1 x + w2 y + w3 = 0: · ¸ · ¸ w1 (1 − tanh2 (0)) w1 ∗ ▽Fuv = = w2 w2 (1 − tanh2 (0)) Therefore, the steepest slope of Equation 1 is given by q ∗ |▽Fuv | = w12 + w22 which can be interpreted as the sharpness of the inferred edge. The values −w4 + w5 and w4 + w5 approximate the gray-level values on each side of the edge, and w5 is the gray-level value along the line defining the edge. Speed is critical in most image processing applications. Though these neural networks are small, special care must be taken in setting the training parameters and setting stopping criteria. The appendix describes our current implementation, and the techniques and parameters we used to reduce training time. B. Bicubic “Distance Weighting” Edge inference uses an inexact cubic B-spline interpolant to combine the outputs of the neural networks. Other cubic interpolants exist and may be desirable for some images [1], [6], but in our experiments, B-splines tended to produce the best results in photographs and cartoon images. For the remainder of this paper, assume that all cubics mentioned are cubic B-splines. This section describes only what is necessary to implement bicubic interpolation. For a fuller treatment, see [1].
Figure 3 shows a plot of the cubic B-spline’s kernel function: 3|x|3 − 6|x|2 + 4 : 0 ≤ |x| < 1 1 3 −|x| + 6|x|2 − 12|x| + 8 : 1 ≤ |x| < 2 [1] B(x) = 6 0 : 2 ≤ |x|
which can be used much like a distance metric. If (x, y) is the point in question, and x0 = max(⌊x⌋ − 1, 1) x1 = min(⌊x⌋ + 2, m) y0 = max(⌊y⌋ − 1, 1) y1 = min(⌊y⌋ + 2, n) c = (x1 − x0 + 1)(y1 − y0 + 1)
(where (x0 , y0 ) is one corner of the surrounding samples, (x1 , y1 ) is the opposite corner, and c is the number of surrounding samples), then the interpolated value is given by b(x, y) =
y1 x1 X 16 X Muv B(x − u)B(y − v) c u=x v=y 0
(2)
0
where b is a C 2 -continuous function over the image domain. The term 16 c scales the result according to the number of surrounding samples, to avoid vignette effects (fuzzy, dark borders) on the image boundaries. Each of the 16 (or fewer) nearest neighbors makes a weighted contribution to the interpolated value. What if, instead of contributing a constant value, the nearest neighbors contributed an estimate of the value at (x, y)? Under the right circumstances, this should result in more detail. Fortunately, the matrix of neural networks, F , provides a way to make these estimates. Given the same definitions for x0 , x1 , y0 , y1 , and c above, edge inference’s interpolated values are given by y1 x1 X 16 X Fuv (x − u, y − v)B(x − u)B(y − v) c u=x v=y 0 0 (3) where v is also a C 2 -continuous function over the image domain. In a sense, edge inference interpolates over superpixels, which have not just a single value, but two values and an oriented edge between them.
v(x, y) =
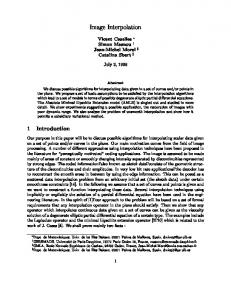
(a) Nearest-neighbor (to emphasize samples)
(b) Edge inference, s = 1
(c) Edge inference, s = 2
(d) Bicubic interpolation
(e) Full edge inference (with noise), s = 1
(f) Full edge inference (with noise), s = 2
Fig. 4. 128 × 128 crop of “Man” from the USC-SIPI Image Database, scaled to 1024 × 1024 (8 × 8)
With this intuition, it is easy to see why edge inference is capable of sharper edges than bicubic interpolation. Suppose a small local area of samples has a sharp edge running through it. Multiple neural networks on either side of the edge are likely to fit to that edge, especially if it is the strongest feature in their training sets. Thus, at interpolated points near the edge, nearest neighbors from both sides of the edge contribute the correct value. With standard bicubic interpolation, this is not possible. Figure 4 demonstrates that this is often the case. It shows the output of edge inference applied to a 128 × 128 image of an unfortunate actor from the USC-SIPI Image Database [7], and used to magnify the image to 1024 × 1024. Figure 4(a) shows the original image magnified using nearest-neighbor interpolation to emphasize the original samples. Figure 4(d) shows the output of Equation 2, and Figure 4(b) shows the output of Equation 3. Notice how much sharper the edges are in Figure 4(b). C. Post-training Sharpness Control Modifying Equation 1 to become Fuv = w4 ∗ tanh(s(w1 x + w2 y + w3 )) + w5
(4)
introduces a new sharpness factor, s. This is similar to gain, except it is held constant equal to 1 during training, and may only be changed afterward. Now, when w1 x + w2 y + w3 = 0, ∂Fuv /∂x = sw1 and ∂Fuv /∂y = sw2 . The steepest slope is given by ¯· ¸¯ q ¯ sw1 ¯ q ∗ ¯ = s2 w2 + s2 w2 = s w2 + w2 |▽Fuv | = ¯¯ 2 1 2 1 sw2 ¯
Thus, s is a constant multiplier to the steepest slope. Figure 4(c) shows the output of Equation 3 with s = 2, which is even sharper than Figure 4(b). D. Reinterpreting Noise A problem with Figures 4(b) and 4(c) is that parts that, in the original image, have fine detail—especially the headdress— are flat and uninteresting. The neural networks have learned the edges very well and disregarded noise. (We define “noise” somewhat circularly as every feature the neural networks fail to learn.) However, the “noise” clearly contains significant features that would be desirable to have in the interpolated image. A simple way to keep those features is to add the noise directly to the interpolated image. Let N be an m × n matrix,
defined by Nuv = Muv − Fuv (0, 0)
(5)
In other words, each element in the noise matrix N contains the signed difference between the sample and the corresponding neural network’s estimate of the sample. Figure 5 shows the calculation of N and the result: a low-contrast image with values in the range [−2, 2]. The noise image is then scaled and added directly to the interpolated image. This is easy to combine with edge inference as it is defined so far. Adding the right side of Equation 2 (with N substituted for M ) to the right side of Equation 3 results in f (x, y) = y1 x1 X 16 X c
(Nuv + Fuv (x − u, y − v))B(x − u)B(y − v)
u=x0 v=y0
(6) This finally completes the algorithm. Figures 4(e) and 4(f) show the results of applying it to the 128 × 128 “Man” image. Both seem to be fuller and have more depth than their counterparts, Figures 4(b) and 4(c). In particular, the noisy parts of the image, such as the feathers and hair, have regained lost features. Figure 6 gives edge inference in high-level pseudocode. Notice that the noise value is calculated only after the neural network’s sharpness is set, because any Nuv depends on the value of Fuv (0, 0), which depends on the sharpness. Of course, if the sharpness is changed later on, the noise value will have to be recalculated. One very useful property of this formulation is that it turns edge inference into a generalization of bicubic interpolation. Specifically, from Equation 4, when s = 0, Fuv = w4 ∗ tanh(0(w1 x + w2 y + w3 )) + w5 = w4 ∗ 0 + w5 = w5 Equation 5 becomes Nuv = Muv − w5 and the term (Nuv +Fuv (x−u, y −v)) in Equation 6 becomes Muv − w5 + w5 = Muv , yielding y1 x1 X 16 X fs=0 (x, y) = Muv B(x − u)B(y − v) c u=x v=y 0
function learnFunctions(M, m, n, sharpness) F