[8] S. Y. Chan, I. X. Y. Leung, and P. Lio, âFast centrality approximation in ... [11] J. M. Anthonisse, âThe rush in a directed graph,â. Stichting, Mathematisch ...
Efficient Approximate Computation of Betweenness Centrality Dimitra Gkorou, Johan Pouwelse, Dick Epema Delft University of Technology {D.Gkorou, J.A.Pouwelse, D.H.J.Epema}@tudelft.nl Keywords: large-scale distributed computing, reputation systems, scale-free graphs, betweenness centrality
Abstract
thousands or sometimes millions of users, it is impossible to compute online the values of BC in these networks even if they are sparse. In this paper, we address the problem of detecting central nodes efficiently using BC in large and dynamically changing networks.
Betweenness Centrality (BC) is a powerful metric for identifying central nodes in complex network analysis, but its computation in large and dynamic systems is costly. Most of the previous approximations for computing BC are either restricted to only one type of networks, or are too computationally inefficient to be applied to large or dynamically changing networks. We explore two approximative approaches for computing BC, and we evaluate them experimentally using both synthetic graphs and graphs derived from real data. For dynamic networks, our approach relies on the observation that the nodes with high BC in real-world networks remain almost invariant over time. For large networks, we propose an approximation of BC, k-BC, which consists in reducing the number of shortest paths taken into account. We evaluate our methods using synthetic scale-free and random graphs, and a graph created by the Bartercast reputation mechanism used in the Tribler P2P network, and we show that the proposed methods approximate BC with sufficient accuracy and low cost.
1
Many previous studies have attempted to propose methods for the efficient computation of BC. The most efficient of these methods is the parallel computation of BC [4, 5]. However, this approach is appropriate for off-line computations, but in a large range of networks such as peer-to-peer networks, there is no ability for parallel computations in each peer. Other approaches like [6, 7] attempt to approximate the values of BC using extrapolation and sampling methods resulting in inaccurate results and overestimation of the BC of the nodes close to the nodes selected as pivots. Another category of previously proposed approximations target only a restricted type of networks, such as modular networks [8]. Although most realworld networks grow rapidly in time, all these approaches have been designed and evaluated only for static networks. Moreover, they try to approximate the exact BC value of all nodes while in practice their relative BC value is enough. These weaknesses of previous studies makes the detection of central nodes using BC in large and dynamic real world networks inapplicable.
Introduction
Identifying central nodes in real-world networks is fundamental for many applications in large-scale networks. Betweenness Centrality (BC) is a reliable metric for detecting central nodes in complex network analysis, but its computation in large and dynamic systems is costly. BC measures the proportion of shortest paths passing through a node in the network, and it has been studied extensively in the context of social networks [1] and networks built by interactions of proteins [2] for detecting central nodes. Furthermore, it is the core of the most promising community identification and clustering algorithms in large and complex networks [3]. Considering that networks such as peer-to-peer and social networks consist of
Unlike the indicated approaches, we explore methods to compute efficiently BC focusing on large and dynamically growing networks. Furthermore, our approach relies on the fact that to detect centroids in a network, it is not needed to compute the accurate BC value of all nodes but only their relative BC value. In our study, we model networks as scale-free and random graphs and we study the accuracy and the cost of two different ways of approximating BC. The first approach relies on the observation that the nodes with high BC in real-world networks remain almost invariant over time, thus reducing the cost of the (re1
)computation of BC in dynamic networks. According to the second method, instead of computing BC, we use k-BC, which is similar to BC but considers only the shortest paths with lengths at most equal to k. We conclude that in scale-free graphs, our BC approximation is efficient and highly accurate, while in random graphs it is poor due to their structural properties. Our initial motivation for this work was to apply BC in Bartercast [9], which is the reputation mechanism implemented in our BitTorrent-based client Tribler [10]. In decentralized systems such as peer-topeer systems, reputation-based mechanisms provide incentives for cooperation by awarding the peers with high reputation. In Bartercast, the reputation metric for each peer is a function of its contribution to the system, namely, the amount of its uploaded data to other peers over the amount of its downloaded data. For our study, we crawled Bartercast for three months, and in our experiments we use the total graph derived from the crawled data of Bartercast.
2
them and then efficiently aggregates the path counts with time cost O(nm) for unweighted graphs and O(nm + n2 log n) for weighted graphs, where m denotes the number of edges in a graph. This algorithm is based on Breadth-First Search (BFS) or on Dijkstra’s algorithm for unweighted and weighted graphs respectively and it reduces the cost of the computation of BC to the cost of APSP. However, this cost remains high for online computations of BC.
2.2 The Bartercast Reputation mechanism Bartercast is the reputation mechanism of Tribler. Using Bartercast, each peer in Tribler computes the reputation of other peers based on the history of their upload and download rates. A peer achieves high reputation by uploading much more than downloading and other peers give a higher priority to it when selecting a bartering partner. In Bartercast, when a peer exchanges content with another peer, they both store the amount of transferred data and the identity of the corresponding peer keeping a history of their interactions. Regularly, peers contact another peer to exchange their history using a gossip-like protocol. Therefore, each peer keeps a history not only of the interactions where it was directly involved but of interactions among other peers as well. According to the Bartercast message exchange mechanism, each peer creates its own current local view of the upload and download activity in the system. The local view of a peer i can be considered as a subjective graph Gi = (Vi , Ei ), where Vi is the set of nodes representing the peers about whose activity i has heard through Bartercast records, and Ei is the set of weighted directed edges. The weight of each edge represents the total amount of data transferred between two nodes and the direction indicates the receiver and the transmitter of the data. With the exchange of their subjective graphs, peers expand their subjective graphs with new nodes and edges. Although this mechanism works properly in system with reliable peers, it is vulnerable to misreporting. Some peers may take advantage of this reputation mechanism misreporting about their upload rate or the download rate of other peers. To deal with this problem in Bartercast, each peer computes its subjective reputation applying Ford-Fulkerson algorithm [14] to its current subjective graph to find the maximum flow from itself to a destination peer and conversely. Consequently, even some colluders misreport about their the upload rates, the other peers in the system know that the flow outgoing from the colluders is bounded by the max-flow in the network. The original maxflow algorithm by Ford-Fulkerson tries all possible paths from the source to the destination, but in Bartercast, in order to limit the computational cost, only
Background and Motivation
In this section, we present a short description of the Bartercast reputation system explaining our motivation, and we present the network concepts needed for this paper.
2.1 Betweenness Centrality BC was introduced by Anthonisse [11] and Freeman [12] in the context of social networks as a measure of the influence of an individual over the information flow in the network. The importance of BC relies on detecting the nodes through which the largest amount of flow passes independently their local characteristics (degree). The BC of a node v is defined as: X σs,t (v) CB (v) = σs,t v6=s,t
where σs,t is the number of shortest paths from node s to t and σs,t (v) is the number of such paths that contains node v. BC can be interpreted as the number of messages passing through node v and it indicates the participation of node v in the network flows. BC does not depend on local information of nodes (i.e., their degree), but it has a conjunctive meaning, namely, the node with the highest BC is not the node participating in a dense neighborhood but the node connecting dense neighborhoods. BC is normalized by the number of possible paths in the network (n − 1)(n − 2), where n the number of nodes in the graph. Although BC is very useful for graph analysis, it is highly costly due to the involvement of all-pair shortest path problem (APSP) in its computational core. A fast algorithm proposed by Brandes [13] computes BC by counting the number of paths as it explores 2
paths of length at most 2 are considered. The restriction of 2 hops in the computation of max-flow results in inaccurate evaluation of reputation of peers. To improve this weakness of Bartercast, each peer i willing to interact with a another peer j detects the node with highest BC in its subjective graph Gi and then it applies the Ford-Fulkerson algorithm with the restriction of 2 hops from the node with the highest BC to peer j and conversely. This modification implies a great improvement in the accuracy of the evaluated reputations because the node with the highest BC holds a central position in the subjective graph and thus encompassing this node in the evaluation of reputation, we exploit more of the provided information of the subjective graph. However, the computational cost of BC makes its application in Bartercast prohibitive. The topological characteristics of a graph affect the behavior of central nodes. Therefore, we analyze the graph built by Bartercast and we evaluate on it the proposed approximation for BC. To study Bartercast mechanism, we have crawled Tribler for three months. As an ordinary peer, the crawler regularly contacts each peer in the Tribler network asking for its subjective graph. After receiving the demanded data, the crawler stores it including a time stamp. Combining the subjective graphs of all the peers using Bartercast, we build a graph that represents the whole interaction network, where nodes represent the nodes in our system and edges represent the uploaded and downloaded information and are weighted. In this paper, we consider the undirected and unweighted graph.
Barabasi and Albert in [16] have proposed preferential attachment to explain the origin of powerlaw degree distribution of real networks, where a new node joining in the system is attached to nodes already existent with probability proportional to their degree. The nodes with high degree have the role of ”hubs”. Therefore, the power law behavior is interpreted as a ”robust yet fragile” connectivity [21], i.e. the scale-free networks are robust to random failures and attacks but fragile to targeted attacks. The concept of small world graph has been introduced in [22] by Watts and Strogatz. A graph is small world if most nodes can be reached from every other in a small number of hops. Graphs with hight clustering coefficient and small characteristic path length have many connections between each pair of nodes and consequently paths of short length are established. Therefore, they exhibit the small world property [23]. To prove that a graph with a given characteristic path length is a small world graph, we show that it has a much larger clustering coefficient than a random graph with the same characteristic path length. The characteristic path length of a graph is defined as the median of the means of the shortest path lengths connecting each vertex in the graph to all other vertices, and the clustering coefficient demonstrates if vertices adjacent to a given vertex are adjacent to each other. We denote the characteristic path length by L and the clustering coefficient by γ.
3
Analysis of the Bartercast
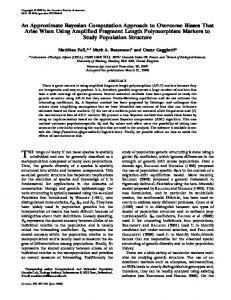
In this section, we present an analysis of the graph built by Bartercast in terms of its degree distribution, centrality distribution, clustering coefficients, and characteristic path length. After having crawled the subjective graphs of all the peers using Bartercast, we combine them and build a graph that represents the whole network of interactions among peers, where nodes represent the nodes in our system and edges are weighted representing the amount of data uploaded and downloaded. We examine five different instances of the Bartercast network, denoted by B1 , ..., B5 , the first of which was crawled on 24 July 2009 and the last on 9 September 2009. Each of these instances is an extension of the previous one. Since each of these graphs is disconnected, we proceed in the analysis using their largest connected components. The degree distribution of the Bartercast graph follows a power-law (see Figure 1). In Table 1, we present the power-law exponents for B1 , ..., B5 , the different instances of the graph built by Bartercast. Our results show that the exponent decreases when the graph grows, but does not change significantly. These exponents are computed as described in [24] using Kolmogorov-Smirnov statistics for the goodness of fit.
2.3 Random, Scale-free and SmallWorld Graphs In this section, we will briefly review some elements of complex graph analysis applied in this paper. Real world networks appear complex with random organizing principles. A well studied model that tried to capture the properties of real networks is the Erd˝os-R´enyi model [15] for random graphs. According this model, a graph, denoted G(n, p), is composed of n nodes and each edge connecting two nodes occurs independently with probability p. Many real world networks are characterized by heavy-tailed degree distribution follow a power-law, i.e. their degree distribution is expressed as P (x) ≈ cx−α , where α denotes the power-law exponent and c is a constant. The networks whose degree distribution follow a power-law are named scale-free [16]. Examples of scale-free networks are the Internet Topology [17], the WWW [18], protein interaction networks [19] and many social networks [1, 20]. As we will show in Section 3, Bartercast can be described by scale-free graphs. 3
we find that it exhibits a power-law degree distribution and almost invariable statistical properties over time, so it can be modeled as a scale-free graph. Furthermore, because of its large clustering coefficient, it displays the small-world property. We observe that the size of Bartercast graph has almost doubled while its degree distribution, clustering coefficient and characteristic path length has changed slightly.
0
10
−1
10
4 Efficient Betweenness Computation
−2
10
1
2
10
3
10 degree
10
The computation of BC is infeasible in large and dynamic systems, such as P2P networks, because the core of BC consists in solving the APSP problem. The efficient re-computation of shortest paths in a dynamically changing network using information from previous instances could be a solution. However, the fastest algorithm for the dynamic APSP problem requires O(n2 ) time [25] and is still very expensive to be implemented in large-scale networks. We explore two approaches to reduce the cost of computing BC. Our first approach focuses on identifying the most central nodes in dynamic networks and exploring the stability of BC over time. If the more central nodes don’t change much in time, BC does not have to be updated very often when the graph grows. For our second approach, we propose and evaluate kBC which is suitable for large graphs and consists in the reducing the number of shortest paths counted. In dynamic networks, BC has to be recomputed as the network changes. According to our first method, the most central nodes remain almost invariant over time in networks that are scale-free. In this paper, we only evaluate the stability of BC over time as random and scale-free graphs grow, the quantification of the stability of BC regarding the network growth will be assessed in future work. Intuitively, we expect that in random graphs the most central nodes change quickly as the network changes over time, while in scale-free graphs the central nodes don’t change significantly with the change of the network. In random graphs, each pair of nodes is connected with some fixed probability p, and so, all nodes have similar properties of connectivity. Consequently, it is hard to predict the change of central nodes as the graph grows. According to the constructive process of scale-free networks, the new-coming nodes prefer to be attached to nodes with high degree which play the role of ”hubs.” Moreover, when a node leaving the network is not a central node, the structure and the statistical properties of the network do not change. Therefore, as network evolves in time, the central nodes are not affected significantly. However, if an outgoing node is central, the BC should be recomputed because the structure of the network changes significantly. Since many realworld networks can be modeled by scale-free graphs,
Figure 1: The ccdf of the degree distribution in B5 Graph B1 B2 B3 B4 B5
Date Collected July 24, 2009 August 6, 2009 August 14, 2009 August 26, 2009 September 9, 2009
# Nodes 1592 1870 2037 2254 2408
# Edges 4318 5164 5722 6420 6926
α 2.2209 2.2106 2.2041 2.1683 2.1234
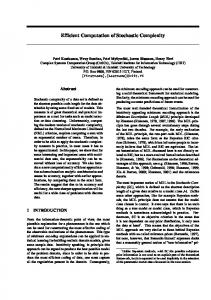
Table 1: Properties of the Bartercast graphs. To study Bartercast in terms of the small-world property, we compute its clustering coefficient comparing it with the clustering coefficient of a random graph with the same characteristic path length (built as it is descrided in ??). Table 2 exhibits the characteristic path length and the clustering coefficient of B1 , . . . , B5 in comparison with the random graphs with the same characteristic path length. Our graphs exhibits much larger clustering coefficients than the corresponding random graphs while the characteristic path lengths are close. Therefore, the graph built by Bartercast is a small-world graph. Next, we compute the BC of each node in the instances of Bartercast graph. As it turns out, the BC follows a power-law distribution with exponent 2.0887, see Figure 2a. The observed cut-off on the plot of BC is caused by finite-size effects. Figure 2b presents the correlation between the degree of a node and its BC. We observe that nodes with low connectivity might hold a central position in the graph. However, nodes with extremely high connectivity always have high betweenness cetrality values. According to our analysis of the Bartercast graph, Graph B1 B2 B3 B4 B5
L 4.8003 4.8536 4.6386 4.6286 4.5507
γ 0.2417 0.2297 0.2378 0.2205 0.2251
Lrand 4.7772 4.8567 4.6699 4.6059 4.5150
Centrality
γrand 0.0057 0.0053 0.0049 0.0045 0.0043
Table 2: The characteristic path length and the clustering coefficient of the Bartercast graphs and of random graphs with similar characteristic path length. 4
0
0
10
10
−1
10
−1
10
−2
BC
10
−3
10
−2
10
−4
10
−5
10
−3
10
−3
−2
10
−1
10 10 Betweenness Centrality
−6
10
0
10
0
1
10
2
10
3
10
10
Degree
(a) The ccdf of Betweenness Centrality
(b) Betweenness Centrality vs Degree
Figure 2: The Betweenness Centrality of the graph created by Bartercast S1 2 6 4 5 17 31 20 46 34 1
S2 2 4 6 17 5 31 20 34 46 1
S3 2 4 6 17 5 31 20 34 1 86
S4 2 4 6 17 5 31 20 1 34 46
S5 2 4 6 17 5 31 20 34 46 86
R1 369 270 340 1228 742 1362 1296 958 1039 1524
R2 270 369 340 684 436 1834 1228 297 533 368
R3 369 270 1553 1169 436 684 1116 1228 452 1834
R4 369 270 2205 1694 380 368 1988 2237 2216 255
R5 369 270 1834 2205 2256 2266 1694 297 2346 986
Table 3: The IDs of the ten most central nodes in the scale-free graphs.
Table 4: The IDs of the ten most central nodes in the random graphs.
the results for scale-free graphs can be generalized to real-world networks. In Section 5, we present the experimental evaluation of this approach. The second proposed method, k-Betweenness Centrality (k-BC), focuses on the approximate computation of BC in large networks, and consists in reducing the number of shortest paths counted. k-BC is a variation of BC, defined exactly as BC but only exploring paths of lengths at most equal to k. The k-BC of a node v is defined as
be easily computed by the depth-limited algorithm or by imposing to classic Breadth-First Search to stop at depth k. We define as the set of k-neighbors of node v, denoted by nk (v), the set of nodes that are within distance k from v (including v itself), and as the kneighborhood of node v the subgraph of G defined by the k-neighbors of v and their connections. The cost of k-BC is O(mk n) for unweighted graphs and O(mk n + n2 log n) for weighted graphs, where mk is the average of the number of edges present in the k-neighborhood of nodes.
CBk (v) =
X s,t∈V :d(s,t)≤k
σs,t (v) σs,t
5
where σs,t is the number of shortest paths from node s to t, σs,t (v) is the number of such paths that contains node v, and d(s, t) is the distance from vertex s to vertex t. For k = n − 1, k-BC is equivalent to standard BC. In [26] k-BC has been defined to measure centrality in networks in which long paths are not used, such as wireless sensor networks. We use this metric as an approximation of standard BC. k-BC can
Experimental Results
In this section, we evaluate experimentally our two approximative methods proposed in Section 4. Fist, we measure the stability of BC over time for both random and scale-free graphs. To proceed with our experiments we generate five instances of a scale-free graph S = (V, E), denoted by S1 , . . . , S5 , with the same power-law exponent as the Bartercast graph using the model proposed in [23], and five instances of a random graph R(n, p), denoted by R1 , . . . , R5 , with 5
D 1 4 4 4 6 6 9 9 10 -
Scale-free Graph (S5 ) 2-BC 3-BC 4-BC 2 2 2 4 4 6 17 6 4 6 17 17 5 31 31 31 5 5 86 34 20 34 20 34 20 86 86 67 46 46
BC 2 4 6 17 5 31 20 34 46 86
2-BC 1834 270 297 1440 2205 2256 368 369 436 634
Random Graph (R5 ) 3-BC 4-BC BC 1834 369 369 270 270 270 369 1834 1834 2205 2205 2205 2256 2256 2256 297 297 2266 1440 2266 1694 1694 368 297 368 1359 2346 2266 1694 986
D 8 8 -
Table 5: The IDs of the ten most central nodes found with k-BC. the probability p of each edge existing computed according the number of nodes and the number of edges in the Bartercast graph. The graphs Si and Ri have the same number of nodes as the corresponding instance of Bartercast graph Bi , i = 1, 2, . . . , 5. Table 3 presents the IDs of the ten most central nodes in the scale-free graphs. Although the scalefree graph grew by 51%, the more central nodes do not change significantly. Therefore, in scale-free graphs, the expensive computation of BC does not have to be repeated often. Table 4 presents the same results but for a random graph that grows over time. We observe that in the random graph the most central nodes change quickly, and it is difficult to predict their alternation. Next, we examine the ability of k-BC to approximate BC. In our experiments we use the graphs S5 and R5 . Table 5 demonstrates the ten most central nodes in the random and the scale-free graph as computed by BC and k-BC, k = 2, 3, 4. In the case of scale-free graphs, 3-BC detects the same ten central nodes as BC, albeit in a somewhat different order, while for the case of random graph, even 4-BC fails to detect the ten central nodes. In order to assess to what extent the vectors of the ten most central nodes as computed by BC and k-BC are equal, in the first and last column of Table 5 we show the depth D, that is the number of rows that we have to traverse in all four k−BC vectors in order to find all the nodes placed in the corresponding or higher rows. Finally, we compute the cost of k-BC. The computation of k−BC constists in the execution of n different BFSs (one for each node) modified to stop at shortest-paths of length k. Therefore, we present the cost as the number of edges traversed by each node in its k−neighborhood on average during the execution of BFS, since only this value differs in k−BC computations for different ks. In Table 6, we demonstrate the cost of k−BC for the scale-free and the random graph. The cost of k-BC for k = 2 and 3 is one order of magnitude lower than the cost of BC.
2-BC 162 2-BC 45
Scale-free Graph 3-BC 4-BC BC 772 2, 377 6, 892 Random Graph 3-BC 4-BC BC 137 389 6, 902
Table 6: The cost of k-BC in the average number of edges in the k-neighborhood of the nodes (mk ). 2-BC 509
3-BC 1, 972
4-BC 4, 1237
BC 6, 926
Table 7: The cost of k-BC in B5 in the average number of edges in the k-neighborhood of the nodes (mk ).
After having evaluated k-BC and the dynamics of central nodes in random and scale-free graphs, we study the same methods for the graph built by Bartercast. In Table 7, we present the cost (in the number of mk ) of k-BC in the latest instance B5 of the Bartercast network for different values of k. The cost of kBC for k = 2 and 3 is one order lower than the cost of BC. Table 8 shows the ten most central nodes in B5 . We conclude that we can efficiently detect the central nodes in Bartercast network. 2-BC 494 25 805 1058 3603 1463 62 141 507 5
3-BC 25 494 1058 3603 805 1463 62 141 507 42
4-BC 25 494 1058 3603 805 1463 62 141 507 189
BC 25 494 3603 1058 1463 805 62 141 507 328
Table 8: The ten most central nodes in B5 . 6
6
Related Work
nodes with high BC in real-world networks remain almost invariant over time. For large networks, we propose another approximative method which consists in reducing the number of shortest paths taken into account. We show that our methods can identify the central vertices of real-world networks which can be modeled as scale-free graphs with sufficient accuracy and low cost. In future work, we plan to asses the time that BC has to be recomputed with the network growth, for dynamic networks. Furthermore, in this study, we considered only undirected and unweighted graphs. Another direction, on which we will focus, consists in finding models to generate weighted and directed graphs with similar statistical properties as real graphs and extending our proposed methods to be used in these graphs.
The BC metric has been studied a lot in a great range of real-world networks, such as social networks, the network built by scientific citations, and biological networks. However, the high cost of BC due to the involvement of APSP problem in its kernel, makes its computation in large networks infeasible. The most efficient algorithm to compute BC has been proposed in [13] and it needs O(mn) time for unweighted graphs and O(mn + n2 log n) for unweighted graphs, where n is the number of nodes and m is the number of edges. This algorithm explores and counts the shortest paths at the same time using Breadth-First Search for the unweighted case and Dijkstra’s algorithm for the weighted case, and then aggregates efficiently the path counts. However, this algorithm is still very expensive for large networks. Designing efficient approximating or fully dynamic algorithms for BC is an open problem that has attracted a lot of research efforts. The problem of dynamic computation of BC is equivalent to dynamic APSP problem which is involved in the computation of BC keeping its cost high. Therefore, the hardness of dynamic APSP is an evidence for the hardness of dynamic BC computation. The faster algorithm proposed for dynamic APSP [25] needs O(n2 ) time, which is still infeasible for large real-world networks consisting of thousands even millions of nodes. A set of prior works have proposed parallel implementation of BC [4, 5]. This approach reduces the time of BC computation, however it cannot be used in networks such as peer-to-peer networks where there is no possibility of parallel computations. Another approach relies on approximating BC. An approximative method, proposed in [6], is based on extrapolation from a subset of nodes (the pivots). The selection of pivots in random way is proved to perform better than more sophisticated strategies. However, this method is not accurate enough because it introduces overestimation of the BC of unimportant nodes. Techniques to reduce this overestimation are studied in [27]. The approximation of BC for a given node using adaptive sampling is studied in [7]. All these approaches focus on static networks. In contrast, our work studies the approximation of BC in dynamic real-world networks.
7
References [1] M. E. J. Newman, “Scientific collaboration networks. i. network construction and fundamental results,” Phys. Rev. E, vol. 64, Jun. 2001. [2] H. Jeong, S. P. Mason, A. L. Barabasi, and Z. N. Oltvai, “Lethality and centrality in protein networks,” Nature, vol. 411, pp. 41–42, 2001. [3] M. Girvan and M. E. J. Newman, “Community structure in social and biological networks,” Proceedings of the National Academy of Sciences of the United States of America, vol. 99, no. 12, pp. 7821–7826, Jun. 2002. [4] K. Madduri, D. Ediger, K. Jiang, D. A. Bader, and D. Chavarria-Miranda, “A faster parallel algorithm and efficient multithreaded implementations for evaluating betweenness centrality on massive datasets,” in IPDPS ’09: Proceedings of the 2009 IEEE International Symposium on Parallel & Distributed Processing, 2009, pp. 1–8. [5] D. A. Bader and K. Madduri, “Parallel algorithms for evaluating centrality indices in real-world networks,” in International Conference on Parallel Processing, 2006, pp. 539–550. [6] U. Brandes and C. Pich, “Centrality estimation in large networks,” in Intl. Journal of Bifurcation and Chaos, Special Issue on Complex Networks Structure and Dynamics, 2007. [7] D. Bader, S. Kintali, K. Madduri, and M. Mihail, “Approximating betweenness centrality,” in Algorithms and Models for the Web-Graph, 2007, pp. 124–137.
Conclusion & Future Work
[8] S. Y. Chan, I. X. Y. Leung, and P. Lio, “Fast centrality approximation in modular networks,” in Proceedings of the 1st ACM International Workshop on Complex Networks in Information and Knowledge Management (CNIKM), 2009.
The efficient computation of BC remains an open problem. We proposed and we experimentally evaluated two approximate methods for computing BC using random, scale-free graphs, and real data. Our study focuses on the approximation of BC in large and dynamic real-world networks. The main idea of our first approach relies on the observation that the
[9] M. Meulpolder, J. Pouwelse, D. Epema, and H. Sips, “Bartercast: A practical approach to prevent lazy freeriding in p2p networks,” in Sixth Int’l Workshop on Hot Topics in P2P Systems, (HoT-P2P), May 2009.
7
[10] J. A. Pouwelse, P. Garbacki, J. Wang, A. Bakker, J. Yang, A. Iosup, D. H. J. Epema, M. Reinders, M. R. van Steen, and H. J. Sips, “Tribler: a socialbased peer-to-peer system: Research articles,” Concurr. Comput.: Pract. Exper., vol. 20, no. 2, pp. 127– 138, 2008. [11] J. M. Anthonisse, “The rush in a directed graph,” Stichting, Mathematisch Centrum, Amsterdam, Tech. Rep. BN 9/71, 1971. [12] L. C. Freeman, “A set of measures of centrality based on betweenness,” Sociometry, 2007. [13] U. Brandes, “A faster algorithm for betweenness centrality,” Journal of Mathematical Sociology, 2001. [14] T. Cormen, C. Leiserson, and R. Rivest, Introduction to Algorithms. Cambridge, MA: The MIT Press, 1990. [15] P. Erd¨os and A. R´enyi, “On random graphs i,” Publicationes Mathematicae (Debrecen), vol. 6, pp. 290– 297, 1959. [16] R. Albert and A. L. Barabasi, “Emergence of scaling in random networks,” Science, pp. 509–12, 1999. [17] M. Faloutsos, P. Faloutsos, and C. Faloutsos, “On power-law relationships of the internet topology,” in SIGCOMM ’99, 1999, pp. 251–262. [18] S. Chakrabarti, B. E. Dom, S. R. Kumar, P. Raghavan, S. Rajagopalan, A. Tomkins, D. Gibson, and J. Kleinberg, “Mining the web’s link structure,” Computer, vol. 32, no. 8, pp. 60–67, 1999. [19] R. Albert, “Scale-free networks in cell biology,” Journal of Cell Science, vol. 118, pp. 4947–4957, 2005. [20] R. Albert. and A. L. Barabasi, “Statistical mechanics of complex networks,” JReviews of Modern Physics, vol. 74, pp. 47–97, 2002. [21] L. Li, D. Alderson, J. Doyle, and W. Willinger, “Towards a theory of scale-free graphs: Definition, properties, and implications,” Internet Mathematics, vol. 2, no. 4, pp. 431–523, 2005. [22] D. J. Watts and S. H. Strogatz, “Collective dynamics of small-world networks,” Nature, vol. 393, no. 6684, pp. 440–442, 1998. [23] T. Bu and D. Towsley, “On distinguishing between internet power law topology generators,” in in Proc. Infocom, 2002. [24] A. Clauset, C. R. Shalizi, and M. E. J. Newman, “Power-law distributions in empirical data,” SIAM Reviews, June 2007. [25] C. Demetrescu and G. F. Italiano, “A new approach to dynamic all pairs shortest paths,” in STOC, 2003, pp. 159–166. [26] S. Borgatti and M. Everett, “A graph-theoretic framework for classifying centrality measures,” J Social Networks, vol. 28(4), pp. 466–484, 2006. [27] R. Geisberger, P. Sanders, and D. Schultes, “Better approximation of betweenness centrality,” in Proceedings of the Ninth Workshop on Algorithm Engineering and Experiments (ALENEX), 2008.
8