Proceedings of the World Congress on Engineering and Computer Science 2008 WCECS 2008, October 22 - 24, 2008, San Francisco, USA
Extensive Application of Multiple Regression: A Critical Insight into English Remedial Education through Web-based Learning Rong Zhang, Yue Zhou, and Fukuya Ishino
Abstract— With the rapid decrease in younger population, Japanese universities/colleges have to face the challenging issue of how to reach the annual quota for the incoming students. The admission standards are debased and students with different varieties of scholastic abilities are being accepted by higher education institutions. Rather than the deterioration of students’ total academic achievements, the bipolar distribution of students’ academic proficiencies is believed to be the most crucial factor hindering the implementation of effective teaching. Many universities/colleges intend to solve this problem by providing remedial education to freshmen, aiming at a fairly balanced situation in students’ academic performances. This paper reports an English remedial education program carried out in Nishinippon Institute of Technology, Japan, discussing the validities of the proposed prediction models for its outcome, focusing on the issue of how to improve the scholastic abilities of low-proficiency students. The study shows that students’ contentment is a chief determinant affecting the consequence. Index Terms— linear regression, prediction model, remedial education, English education.
I. INTRODUCTION Remedial education is a transformation of the term developmental education. It originally refers to special preparatory courses offered by some American community colleges to potential incoming students whose scholastic abilities are not yet admirable [1]. Students are granted a certain period of time to compensate for their academic deficiencies. Recently, remedial course has also been integrated into the first-year education into the higher education of many countries. Numerous studies report attempts in such special programs to strengthen students’ basic scholastic skills in common subjects [2] [3] [4]. The apparent cause of this demanding situation is the progressive deterioration of students’ academic proficiencies. Manuscript received August 6, 2008. This research was supported by “Ambient SoC Global COE Program of Waseda University” of the Ministry of Education, Culture, Sports, Science and Technology, Japan. Rong Zhang is with Computer Design Technology Department, Nishinippon Institute of Technology, Japan. She is also a student in Graduate School of Information, Production and System, Waseda University, Japan (phone: 0081-93-563-2901; fax: 0081-93-563-2901; e-mail: zhang@ nishitech.ac.jp). Yue zhou is a student in Graduate School of Information, Production and System, Waseda University, Japan (e-mail:
[email protected]). Fukuya Ishino is a professor with Graduate School of Information, Production and System, Waseda University, Japan (e-mail:
[email protected])
ISBN: 978-988-98671-0-2
It is also the most serious problem which most higher education institutions have to face currently in Japan. As the younger population is experiencing rapid decrease, more and more universities/colleges are making every effort to ensure annual quotas. As a result, the admission standards are debased to an unprecedented level and students with different varieties of scholastic abilities are being accepted [5]. In order to improve the effectiveness of teaching, universities/colleges have to offer remedial courses paralleling the normal curricula education, aiming at admirable progress in their freshmen’s academic performances. In fact, rather than the degeneration of students’ total academic achievements, the bipolar distribution of students’ academic proficiencies is believed to be the most crucial factor hindering the implementation of effective teaching[5]. The core of all remedial education projects lies in the issue of how to help low-proficient students develop their potential abilities in learning and how to diminish the dispersion of students’ scholastic achievements. Since most remedial courses are carried out online and through some web-based learning tools, two factors are considered most crucial for a desirable output from such project: (1) proper selection of candidate students; (2) appropriate contents which best suit their level. Inapplicable instructions in remedial course will not help adjust the unbalanced distribution of students’ academic achievements and only results in a vicious circle dissipating the limited educational resources. Because remedial education is generally treated as a supplement to the ordinary course study, there has seldom been any research about its instructional methodologies and pedagogic validity. This study makes an extensive application of the multiple regression theory, exploring the solution of the problem of how to select proper candidate students and contents for remedial courses, fitting the postulated prediction model for student’s post-test score changes and figuring out determinants affecting low-proficient students’ academic performances during their remedial study.
II. DATA COLLECTION AND ANALYTICAL ALGORITHM The data used in this study were collected from an English remedial course adopted by Computer Design Faculty of Nishinippon Institute of Technology, Japan. Freshmen students are supposed to accomplish their study within a certain period of time through a web-based learning system
WCECS 2008
Proceedings of the World Congress on Engineering and Computer Science 2008 WCECS 2008, October 22 - 24, 2008, San Francisco, USA
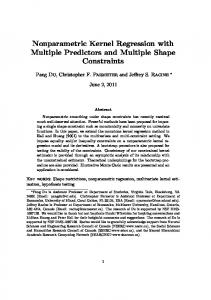
called ASP (Active Server Pages) (Fig.1). The content of the e-learning tool aims at an improvement of students’ basic knowledge (both grammatical rules and vocabulary) about English which should have been mastered during their middle school and high school study. Pre-course test and post-course test were conducted in order to make out the changes in their English proficiencies, which is used as an important index to investigate the effectiveness of this online program. Three inquiries (such as questions about their learning strategies, intercultural communication abilities & computer operation skills) were carried out in order to spot those factors which have the most significant effects on students’ learning production. Students’ school records (including their attendance rates, average scores of all subjects) are also employed to strengthen the objectivity of this research. The very basic concept propping the current investigation is the multiple regression theory which are applied abundantly in studies about educational issues [6] [7] [8]. The most commonly accepted regression model shows a linear relationship between the dependent variable (W) and certain independent variables (Y). It is also the most intuitional way which helps clarify the potentially complex implications in all the variables. The quasi-linear correlation can be expressed through the following equation: f (wi) = ß0 + ß1y1 + β2y2 + …+ βmym (i = 1, n)
(1)
In this study, dependent variable Wi indicates the score change of the ith sample student after remedial education course study and Y refers to a combination of all the factors which correlate maximally with this change. We assume that post-course score changes are mainly influenced by students’ willingness to get involved in learning activities, their competences in intercultural communication and computer operation [9] [10]. Parameters related to these factors make up the majority of the independent variables. ß0 is the intercept of the line and βm functions as the coefficient of the mth independent variable. By using the least square method, we can figure out the largest coefficient modulus (R2) and fix the independent variables constituting the above prediction model (1). A larger R2 signifies a higher percentage that the dependent variable (W) can be interpreted by the conjuncture of the independent variables. Therefore, we further fit the postulated model to a binomial formula in order to increase the preciseness of our prediction. Web Manager
Achievement Records
Teaching Materials
Server
Teacher
Students
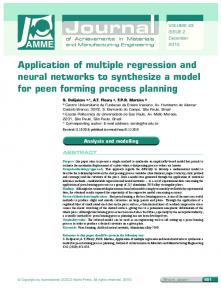
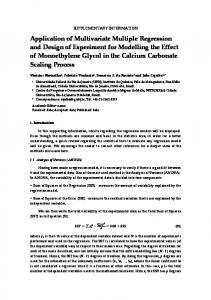
Fig. 2 shows the unbalanced distribution of students’ Pre-course Test Scores (PRTS). Sample students are classified into small groups according to their scores. The average score of PRTS is 68 point, and most students score from 50~90. We use very basic and simple questions in the pre-course test for a simple reason: If the students lose confidence and become desperate at the beginning, they will not show interests and efforts in English learning afterwards. This is especially the case with those students who obviously lack basic learning abilities in English. There are only 11 students who scored below 50. But, in fact, they are the main target of our remedial course, because their improvement of English proficiencies will definitely help increase teaching efficacy in class. Table 1 implies an average change of 9.49 points in the test scores of 121 effective sample students, with most of these changes occurring within an interval of 0 ~ 20 points. The gap between the minimum Observed Score Change (OSC) and the maximum OSC reaches 64 points. As an inevitable phenomenon of the growing curve theory, pre-course test score turns out to be one fundamental determinant in OSC -students with higher Pre-course Test Scores (PRTS) tend to show a non-significant change in their post-course test performance (Fig. 3), while those with lower PTS absolutely benefit more from their online learning. PTS spans an extremely wide range of 24~100 points, which demonstrates a radical dispersion in its distribution. The above features of the two fundamental exponents once more intensify the paradox we hold in mind: What should be the exact level of the remedial course we can best serve students? Or how should we assort proper candidates for the prepared course and delete those who will not favored by their study? What on earth contribute to students’ OSC except for their PRTS? 50 40 30 20 10 0 -30 -20 -10
0
10
20
30
40
Fig. 2 Histogram of Observed Score changes Table 1 Statistics of Observed Score Change Mean Standard Deviation Median Mode Kurtosis Skewness Minimum Maximum Sample Number
9.5 11.1 8 2 0.758 0.10 -28 36 121
Fig. 1 Framework of ASP System
ISBN: 978-988-98671-0-2
WCECS 2008
Proceedings of the World Congress on Engineering and Computer Science 2008 WCECS 2008, October 22 - 24, 2008, San Francisco, USA
Fig. 3 Scatterplot of Observed Score Change and Pre-course Test Score Table 2 Optimized Model (1) for Prediction of Post-course Score Changes (PSC) Independent Variables Coefficients Intercept (I)
-17
Pre-course test score (PRTS)
-0.483**
Average score of total subjects (A) Encouragement from positive evaluation (M) Credit anxiety (U)
0.736**
Existence of foreign friends (F) Curiosity towards foreign cultures (C) Self-confidence in making foreign friends(Q) Easiness in contact with foreign people (G) Appropriate dependence on computer (O) Self-confidence in computer operation (S) Willingness to improve one’s computer operation skills (E) Adaptiveness to the rapid progress of scientific technology (D)
2.31**
1.21
1.56* 1.97** 2.28** 1.74** 2.19** 1.11 1.51*
Degree of Impacts
*p < 0.05
30 20 10 0 -20
A M U
F
C Q G O
S
E
-30
Fig. 4
Independent Variables
Impact Degrees of Determinant Variables in (2)
III. ASSESSMENT A. General multiple regression We conducted multiple regression analysis according to the general procedure while taking all the parameters into account (Table 2) [10]. The acquired model (equation 2) is proposed to describe the value of the post-course score changes (PSC): PSCi = -17(I) + 0.483 * PRTSi + 0.736 *Ai + 2.172 * Mi + 1.21* Ui + 2.31 * Fi + 1.56 * Ci + 1.97 * Qi + 2.28 * Gi + 1.74 * Oi + 2.19 * Si + 1.11 * Ei + 1.51 * Di ( i = 1, n)
ISBN: 978-988-98671-0-2
(2)
Table 3
Correlations between PCS and other Independent Variables Coefficient s -0.577
Independent Variable Pre-course test score (PRTS) The remedial course is not difficult (D). I find English learning is more enjoyable than before. (Y) I am doing extra learning in English. (L)
0.275 0.258 -0.241
There are still many questions unsolved. (S)
0.235
I always review after the class. (R)
0.233
Remedial course is necessary.(N)
0.229
I can catch up with the teacher in class. (C)
0.225
Credit anxiety (I am learning for credits.) (A)
0.222
I always prepare before class.(P)
0.221
I like computer games.(G) I do not want to lose my current English ability.(U) One's English proficiency depends on his/her efforts.(E) Computers are more reliable than human beings.(R)
-0.215 0.20 0.20 -0.181
D
PRTS
-40
B. Correlation
2.17**
**p
4
/
(n+2)
(3)
“n” signifies the sample number, which is 121 in this study. Therefore, the modulus R2 is expected to be more than 0.0325 ( 4 / (121+2) ) in order to assure the correlation. 13 factors are proved to have a strong correlation with the independent variable (PSC) except for PRTS (Table 3). Only two factors in the prediction model (2) survive in the list. The factors ranking at the top are all related to students’ psychological pressure and most of them hold a negative correlation with PSC. Students with lower PRTS realized a higher promotion in their post-course test (Fig. 3 & Table 3). Hence, the rational argument is: low-proficient students have to overcome extreme frustration during the process of self-study. The more they take it seriously, the faster they WCECS 2008
Proceedings of the World Congress on Engineering and Computer Science 2008 WCECS 2008, October 22 - 24, 2008, San Francisco, USA
make progress in their English learning. Psychological pressure is turned into some sort of motivation enhancing their devotion to the course. As illustrated in Table 4, the optimized model (equation 4) contains only four independent variables this time. Although it can describe only 40.3% of the total data, which is lower than the case of equation (2), the plain formula helps us understand better about the factors causing the changes in students’ test scores. The impact degrees of determinants in equation (4) are indicated in Fig. 5. PSCi = 37.9 (I) + (-0.409)*PRTS + 2.01*C + 1.93*Y + 19.6*D
(4)
Table 4 Optimized Model (2) for Prediction of Post-course Score Change (PSC) Coefficient 37.9 -0.409** 2.01 1.93 19.6** **p