RIVER RESEARCH AND APPLICATIONS
River Res. Applic. 19: 443–457 (2003) Published online in Wiley InterScience (www.interscience.wiley.com). DOI: 10.1002/rra.737
IDENTIFYING SPATIAL AND TEMPORAL PATTERNS IN THE HYDROLOGICAL CHARACTER OF THE CONDAMINE–BALONNE RIVER, AUSTRALIA, USING MULTIVARIATE STATISTICS MARTIN C. THOMS* and MELISSA PARSONS Cooperative Research Centre for Freshwater Ecology, University of Canberra, ACT 2601, Australia
ABSTRACT Many environmental flow approaches calculate hydrological indicators on an annual or daily basis and do not consider the multiple scales of a rivers’ hydrological character. However, hydrologic processes operate within a temporal and spatial dimension, in accordance with multidimensional and hierarchical views of river systems. This study investigates spatial and temporal patterns of the hydrological character of a large river system, and examines the impact of water-resource development on these patterns. Over 300 regime, history and pulse-scale flow variables have been calculated from simulated discharge data representing ‘reference’ and ‘current’ water-resource development scenarios. Multivariate statistical analyses are used to identify measurement nodes with similar hydrological character and to determine the association between different temporal scale flow variables and groups of nodes. Six spatial hydrological zones are identified in the Condamine–Balonne River, Australia. These hydrological zones are found to have become homogenized with water-resource development. Different temporal scales of flow variables are related to the different hydrological zones, and to water-resource development scenarios. Thus, the temporal dimension of hydrological character is embedded within a spatial dimension of river zonation. Both dimensions should be considered in a hierarchical context, and environmental flow restoration targets may need to be set for each dimension of a river system. Copyright # 2003 John Wiley & Sons, Ltd. key words: spatial scale; temporal scale; classification; ordination; environmental flows
INTRODUCTION The natural flow paradigm (Poff et al., 1997) has been widely accepted as an underlying framework for the determination of environmental water allocations (Richter et al., 1997). The natural flow paradigm asserts that the structure and function of aquatic ecosystems can be maintained if the flow regime in regulated rivers is managed so that it mimics the natural flow regime. There are five components of the natural flow regime: magnitude, frequency, duration, timing and rate of change of hydrological conditions (Poff et al., 1997). Several environmental flow approaches have used these components to set flow management targets. For example, the range of variability approach (RVA) uses 32 indicators related to magnitude, frequency, duration, timing and rate of change, to set flow targets for a river or river reach (Richter et al., 1997). However, like many other approaches (e.g. building block methodology (King and Louw, 1998), holistic method (Arthington et al., 1992)), the RVA is limited in temporal extent because indicators are calculated largely on an annual basis. Thus, existing approaches to environmental flows do not consider the multiple temporal scales of a river’s hydrological character. Hydrological processes operate across hours, days, seasons, years and longer (Poff et al., 1997). Puckridge et al. (1998) and Thoms and Sheldon (2000a) resolve this variation into three temporal scales of hydrological character: flow regime, flow history and flood pulse. Flow regime represents the long-term statistical generalization of flow behaviour and incorporates macroscale influences that occur over hundreds of years. Flow history represents the sequence of floods or droughts and incorporates mesoscale influences that last between one and 100 years. Flood pulses represent flood events and incorporate microscale influences that generally last for less than one year. * Correspondence to: Martin C. Thoms, CRC for Freshwater Ecology, University of Canberra, ACT 2601, Australia. E-mail:
[email protected]
Copyright # 2003 John Wiley & Sons, Ltd.
Received 8 March 2002 Revised 24 June 2002 Accepted 18 July 2002
444
M. C. THOMS AND M. PARSONS
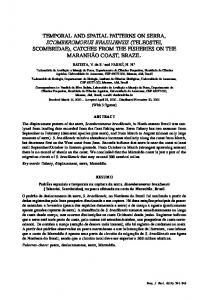
Examination of hydrological change in the Barwon–Darling River, Australia, at the regime, history and pulse scales demonstrates that water-resource development has had a marked impact at all three scales (Thoms and Sheldon, 2000a). Thus, the temporal scale of any hydrological attribute is also an important indicator of the natural flow regime, despite being omitted from many environmental flow approaches. Not only do hydrological processes operate at various time scales, they also vary at geographic scales. Variation in hydrological processes has been documented at a regional scale (e.g. Gustard, 1992; Harris et al., 2000). Downstream hydrological changes in individual river systems are also variable and depend upon the amount and timing of tributary inputs and interactions with adjacent floodplain surfaces. For example, Knighton and Nanson (1994) recorded a non-linear relationship between transmission losses and river stage along a 400 km reach of Cooper Creek, in central Australia. Significant reductions in flow volumes and peak discharges were recorded during overbank flows because floodplain transmission losses exceeded 75%. However, during minor floods that were contained within the channel, the hydrological integrity of a flood event was maintained along the entire reach. These differences in hydrological behaviour potentially create a complex spatial and temporal pattern of hydrological characteristics. This view is consistent with a multidimensional hierarchy of river system organization (Schumm and Lichty, 1965; Frissell et al., 1986; Ward, 1989). However, many environmental flow approaches at present do not recognize the spatial and temporal dimensions of a river’s hydrological character. If the hydrological complexity of a river system can be identified and modelled, environmental flow targets may more accurately mimic the natural flow regime. This paper investigates the interaction between the spatial and temporal dimensions of the hydrological character of the regulated Condamine–Balonne River system, Australia. We use modelled discharge data representing ‘reference’ and ‘current’ water-resource development scenarios to investigate four aspects of spatial and temporal pattern. First, we examine the spatial pattern of the river’s hydrological character. Second, we examine the impact of waterresource development on this spatial pattern. Third, we examine the temporal pattern of the hydrological character in relation to the spatial pattern. Fourth, we examine the impact of water-resource development on temporal pattern, in relation to spatial pattern. The spatial dimension equates to the physical position of measurement nodes with similar hydrological character. The temporal dimension equates to the relationship between regime, history and pulse-scale flow variables and the spatial array of measurement nodes. Multivariate statistical analyses were used to decipher spatial and temporal patterns of hydrological character because these methods allow a large number of differently scaled flow variables to be considered simultaneously. The methods can be used to identify samples or conditions that have similar hydrological character (Digby and Kempton, 1987; Clarke and Warwick, 1994). STUDY AREA The Condamine–Balonne River has a catchment area of 143 900 km2 (Figure 1). The Condamine–Balonne River has a single channel for most of its length, but bifurcates into a series of anabranching or anastomosing channels downstream of St George (Figure 1). The Condamine–Balonne and Maranoa Rivers have been notionally divided into geomorphological zones (Figure 1) using remotely sensed imagery, aerial photographs, and field reconnaissance (Thoms and Sheldon, 2002). These zones are process-based and reflect the way water and sediment discharge control river channel character, in relation to catchment size, geological influence and valley character (Thoms and Sheldon, 2002). The method used to delineate geomorphological process zones is similar to that outlined by Petts and Amoros (1996). Each geomorphological zone has a unique set of physical characteristics. The constrained upland zone is dominated by a high-energy, boulder/cobble-bed channel that has no floodplain. The armoured zone is characterized by relatively immobile bed sediment, riffle/pool sequences and small flanking floodplains. The mobile zone is characterized by highly active riverbed sediments and channel morphologies. The meandering zone consists of extensive floodplains, sandy in-channel sediment deposits and numerous billabongs and abandoned channels on the floodplain. The anabranch zone is dominated by multiple anastomosing channels and extensive floodplain systems. Like many Australian inland rivers the Condamine–Balonne originates in a well-watered area but flows for most of its length across a dry landscape (Thoms and Sheldon, 2000b). Rainfall within the Condamine–Balonne catchment is spatially and temporally variable and droughts and floods occur periodically throughout the region. Median annual rainfall decreases from east to west across the catchment. The long-term (1920–1996) average Copyright # 2003 John Wiley & Sons, Ltd.
River Res. Applic. 19: 443–457 (2003)
Figure 1. The Condamine–Balonne catchment, showing the 43 nodes for which simulated discharge data were obtained. Geomorphological zones of the Condamine–Balonne River system (Thoms and Sheldon, 2002) are shaded
PATTERNS OF HYDROLOGICAL CHARACTER
Copyright # 2003 John Wiley & Sons, Ltd.
445
River Res. Applic. 19: 443–457 (2003)
446
M. C. THOMS AND M. PARSONS
annual rainfall at Toowoomba is 1105 mm decreasing to 517 mm at St George (Sims et al., 1999). Most rainfall occurs in the summer months (November–April) and is associated with tropical monsoonal activity. Mean annual evaporation is also variable, ranging from 230 mm in the headwaters to 1890 mm in the lower catchment. The long-term (1975–2000) median annual discharge of the Condamine–Balonne River at St George is 727 900 Ml. In this period, the minimum and maximum median annual discharges were 23 960 Ml and 7 385 000 Ml respectively. Thus, long-term stream discharge is highly variable. However, on an annual basis most rainfall events occur during the months of November to April, and hence the annual flow pattern is summer-dominated. Most water-resource development in the Condamine–Balonne catchment has occurred since the advent of irrigated agriculture in the 1960s. There are three main irrigation developments. The Upper Condamine Irrigation Project is in the upper part of the catchment and takes water from a 196 km section of river downstream of Warwick. The Chinchilla Weir Irrigation Project is in the middle part of the catchment and uses water from an 88 km section of river around Chinchilla. The St George Irrigation Area is in the lower part of the river and its water comes from a 140 km section of the river around St George. There are four significant public water storages in the Condamine–Balonne River, which service irrigation, agricultural and domestic supply (Queensland Department of Natural Resources, 2000). Leslie Dam (106 250 Ml capacity) is located in the upper part of the catchment on Sandy Creek. Chinchilla Weir (9800 Ml capacity) is located in the middle part of the catchment. Beardmore Dam (81 800 Ml capacity) and Jack Taylor Weir (10 100 Ml capacity) are located in the lower part of the catchment, close to St George. Overall, 30% of the main stem of the Condamine–Balonne River is influenced by river regulation (Queensland Department of Natural Resources, 2000). There are also numerous private off-stream water storages in the lower parts of the system that have a combined storage volume in excess of 500 000 Ml (Sims et al., 1999). The Maranoa River is largely unaffected by river regulation.
METHODS Data The rapid rate of water-resource development combined with natural flow variation makes it difficult to evaluate the impact of development on the hydrological regime, using historical data only. Thus, simulated discharge scenarios were obtained from the Queensland Department of Natural Resources and Mines’ Integrated Quantity Quality Model (IQQM). Two scenarios were used: ‘reference’ flows and ‘current’ flows. Reference scenario flows were simulated with a zero setting for flow-regulating structures, abstractions of water and catchment development, and using long-term mean climatic conditions. Current water-resource development scenario flows were simulated using water-resource and catchment development conditions present in 1999–2000, and also using long-term mean climatic conditions. A full description of model inputs, calibration and validation is given in Black et al. (1997) and Thoms and Sheldon (2000a). Both scenarios cover the period 1922–1995, and daily discharge data (Ml/day) were modelled for 43 stations (nodes) in the Condamine–Balonne River system (Figure 1). A set of 340 flow variables (Growns and Marsh, 2000) was calculated for each node in the reference and current water-resource development scenarios, using the simulated IQQM daily discharge data. These flow variables fall within seven types and various categories (Table I) which encompass the magnitude, frequency, duration, timing and rate of change components of the flow regime. Each of the categories was assigned to the regime, history or pulse scale according to the time period over which it would influence hydrological character. For example, ‘maximum annual moving average’ is a regime-scale variable (Table I) because it represents macroscale hydrological influences that occur over hundreds of years. Similarly, ‘seasonal variation of below-threshold flows’ is a history-scale variable (Table I) because it describes flow character over tens of years, and ‘magnitude of daily change in flow’ is a pulse-scale variable (Table I) because it records hydrological change over daily periods. The scales of the flow variables, rather than the types of flow variables, were used as the basis for examining the temporal dimension of hydrological character in the Condamine–Balonne River. Many of the nodes in the reference and current water-resource development data sets were missing data, because of zero divide errors in the calculation of some flow variables. Multivariate statistical techniques generally require a complete data set that is free of missing values, and thus any flow variable that was missing a data value for one or more of the 43 nodes was deleted. Flow variables that were invariant (that is, they contained the same value across Copyright # 2003 John Wiley & Sons, Ltd.
River Res. Applic. 19: 443–457 (2003)
447
PATTERNS OF HYDROLOGICAL CHARACTER
Table I. Flow variables used in multivariate analyses of the reference and current water-resource development scenarios. Seven main types of variables (labelled 1 to 7) were included, containing various categories of variables. Acronyms correspond to each category, but are also numbered sequentially within a category. For example, within the ‘long-term values’ category (LT) there were 18 individual flow variables. Growns and Marsh (2000) give a full list of the 340 flow variables. The number of flow variables from each category that were used in the reference and current water-resource development data sets is also given Variable type and variable category
(1) Daily flow summary Long-term values (2) High flow spell analysis Number of ‘above-threshold’ flows Peak magnitude of ‘above-threshold’ flows Duration of ‘above-threshold’ flows Seasonal variation of ‘above-threshold’ flows (3) Low flow spell analysis Number of ‘below-threshold’ flows Trough magnitude of ‘below-threshold’ flows Duration of ‘below-threshold’ flows Seasonal variation of ‘below-threshold’ flows (4) Moving average Maximum annual moving average Minimum annual moving average (5) Cessation of flow analysis Zero flows Number of rises and falls of the hydrograph Duration of rises and falls of the hydrograph Magnitude of daily change in flow (6) Monthly flow analysis Monthly flows Inter-monthly variability Inter-annual, monthly variability (7) Additional variables Number of days between spells of zero flow Maximum number of days between spells of 1/2 mean daily flow Maximum number of days between spells of 1/3 mean daily flow Maximum number of days between spells of 1/9 mean daily flow Mean annual flow CV mean annual flow
Scale
Acronym (and number of variables in each category)
Number of variables included in each scenario Ref.
Current
Regime
LT (1–18)
15
15
History Pulse Pulse History
HSN (1–22) HSP (1–22) HSD (1–22) HSSV (1–36)
17 17 17 30
17 17 17 28
History Pulse Pulse History
LSN (1–14) LST (1–14) LSD (1–14) LSSV (1–36)
8 2 8 18
8 2 8 18
Regime Regime
AMAX (1–12) AMIN (1–12)
9 4
9 3
History History Pulse Pulse
ZF (1–6) RFN (1–8) RFD (1–8) RFM (1–32)
5 8 8 26
5 8 8 26
Regime History Regime
MF (1–50) MFMV (1–4) MFAV (1–4)
26 2 4
26 2 4
History History
NDAY0 (1) NDAY5 (1)
1 1
1 1
History
NDAY3 (1)
1
1
History
NDAY9 (1)
1
1
Regime Regime
MAFL (1) CVMAF (1)
1 1
1 15
all 43 nodes) were also removed from the data because they add no information about differences between nodes (Belbin, 1993). The final data set for multivariate analysis of the reference scenario contained 230 flow variables and the final data set for analysis of the current water-resource development scenario contained 227 flow variables (Table I). Analysis All multivariate analyses were performed using the PATN analysis package (Belbin, 1993). The 43 nodes in the reference and current water-resource development scenarios were classified separately, using the flexible-unweighted pair-groups using arithmetic averages (UPGMA) fusion strategy recommended by Belbin and McDonald (1993). The Gower association measure was used in all classifications, because this measure is range-standardized and is Copyright # 2003 John Wiley & Sons, Ltd.
River Res. Applic. 19: 443–457 (2003)
448
M. C. THOMS AND M. PARSONS
recommended for non-biological data (Belbin, 1993). Groups of nodes with similar hydrological character were selected by viewing a dendrogram representation of the classification. Dendrogram groups were arrayed onto a map to delineate the positions of nodes with similar hydrological character. These groups of nodes with similar hydrological character equate to hydrological zones in the Condamine–Balonne River. Boundaries of hydrological zones were placed at the mid-points between pairs of nodes. Nodes in each scenario were ordinated using semi-strong-hybrid multidimensional scaling (Belbin, 1991). All ordinations had a stress level 0.2) indicates that the ordination solution is a poor representation of data structure, and should not be used (Digby and Kempton, 1987). Nodes were arrayed in ordination space according to the dendrogram groups identified in the classification analysis, which in turn equate to hydrological zones. Each ordination was performed in three dimensions, and therefore there are three possible axis comparisons (dimensions 1v2, 1v3 and 2v3). Bi-plots of each combination were constructed and the axes representing the best separation of dendrogram groups in ordination space were selected for presentation. Clear separation of groups in ordination space indicates that each group has a discrete hydrological character. The relationship between flow variables and groups of nodes in ordination space was determined using principal axis correlation (Belbin, 1993). Principal axis correlation generates a correlation value (R2) for each attribute, with high values being indicative of a strong association between a flow variable and the position of a node in ordination space. A Monte-Carlo permutation test (Belbin, 1993) was also performed, to test the significance of the correlation values. Only the significant variables with an R2 above the 80th percentile (when the R2 values of all 227 or 230 variables were considered) were included as vectors on the ordination plot. This assumes that vectors with an R2 value above the 80th percentile were the strongest indicators of hydrological character. Of these vectors many were from the same category and, thus, may be highly correlated with each other. However, no attempt was made to identify and remove correlated flow variables because it was desirable to see if a dominant scale of variable was strongly associated with groups of nodes in ordination space. Vectors were assigned to a group of nodes by visually examining the position of vectors in the bi-plot. Most vectors were clearly associated with a group of nodes, but some were assigned to the nearest group, or designated ‘no association’. The vectors associated with each group were subsequently tallied according to the regime, history and pulse scales. In previous analyses, the reference and current water-resource development scenarios were analysed separately. However, in a hierarchy of spatial and temporal hydrological influence, different patterns can emerge at different scales of observation (Gardner, 1998; Mac Nally and Quinn, 1998). Thus, temporal scales of hydrological influence were also calculated for individual hydrological zones. The reference and current water-resource development scenarios were considered together in these analyses because it was desirable to examine whether nodes from each zone grouped together according to scenario type, or physical location. Nodes in each zone were ordinated using semi-strong-hybrid multidimensional scaling. Principal axis correlation was used to examine the relationship between flow variables and groups of nodes in ordination space. A Monte-Carlo test was also performed to test the significance of the correlation values. Only those significant flow variables with an R2 above the 80th percentile were included as vectors on the ordination plot. Association between each vector and a group of nodes was assigned visually, and vectors were subsequently tallied according to the regime, history and pulse scales.
RESULTS Spatial zones of hydrological character Classification of nodes from the reference scenario revealed six groups with similar hydrological character (Figure 2a). Group 1 nodes were located in the upper section of the river. Group 2 nodes were located further downstream, in the mid-section of the river. Group 3 nodes were located in the lower section of the river, and included the main Condamine–Balonne River channel and the Culgoa and Balonne–Minor River anabranch sections. Group 4 contained only one node. This node, Sandy Creek, is a tributary within the upper section and is located immediately downstream of Leslie Dam. Group 5 predominantly contained nodes from the Maranoa River, but also included the only node present in Briarie Creek. Group 6 nodes were all located in the anabranching lower Copyright # 2003 John Wiley & Sons, Ltd.
River Res. Applic. 19: 443–457 (2003)
PATTERNS OF HYDROLOGICAL CHARACTER
449
Figure 2. Hydrological zones identified under the (a) reference and (b) current water-resource development scenarios. River names and nodes are detailed in Figure 1. Hydrological zones correspond to groups of nodes with similar hydrological character. Groups are derived from classification analysis of each scenario and are displayed in the dendrogram. Gower association is given at each major split of the dendrogram, where lower values indicate greater similarity
Copyright # 2003 John Wiley & Sons, Ltd.
River Res. Applic. 19: 443–457 (2003)
450
M. C. THOMS AND M. PARSONS
section of the Condamine–Balonne River. Thus, the six groups of nodes correspond to distinct zones of hydrological character along the Condamine–Balonne River. The hydrological zones delineated under the reference scenario corresponded closely with the geomorphological zones derived by Thoms and Sheldon (2002). The upper hydrological zone (Figure 2a) corresponded with the constrained upland and armoured geomorphological zones (Figure 1). In the remainder of the main channel, the mid-, lower and anabranch hydrological zones (Figure 2a) corresponded with the mobile, meandering and anabranch geomorphological zones respectively (Figure 1). Thus, there is an association between the independently derived hydrological and geomorphological zones of the Condamine–Balonne River. Classification of nodes from the current water-resource development scenario revealed five groups with similar hydrological character (Figure 2b). Several of these groups matched the hydrological zones present under the reference scenario. The upper, Sandy Creek and Maranoa and Briarie zones remained unchanged (Figure 2a), indicating that these three hydrological zones were maintained under the current water-resource development scenario (Figure 2b). However, several zones changed under the current water-resource development scenario. Nodes from the mid-zone merged with some nodes from the lower-zone, subsequently extending the mid-zone to St George (Figure 2b). The remainder of the nodes from the lower-main zone of the reference scenario merged with nodes from the anabranch-zone to form a single zone in this section of the Condamine–Balonne River. In addition, Node 2, originally from the upper-zone, became more similar to nodes from the mid-zone, and Node 10, originally in the mid-zone, became more similar to nodes from the anabranch-zone. Thus, zones of hydrological character are homogenized in the mid-, lower- and anabranch sections of the Condamine–Balonne River under the current water-resource development scenario. Temporal patterns of hydrological character In the analysis of separate water-resource development scenarios, hydrological zones formed clear groups in ordination space (Figure 3). The temporal scale of flow variables associated with hydrological zones differed between scenarios. In the upper zone, history and pulse-scale flow variables were prominent under the reference scenario (Figure 3a), but only history-scale variables occurred under the current water-resource development scenario (Figure 3b). In the anabranch-zone, regime-, history- and pulse-scale variables were prominent under the reference scenario (Figure 3a) but only history- and pulse-scale variables occurred under the current waterresource development scenario (Figure 3b). The proportion of history-scale variables also decreased between scenarios in the anabranch-zone whereas in the mid-zone the occurrence and proportion of history- and pulse-scale variables remained relatively even between scenarios (Figure 3a and b). Thus, there is a change in temporal hydrological diversity between the reference and current water-resource development scenarios. However, this interpretation cannot be applied to all zones because there was no association between flow variables and the position of some zones in ordination space (Figure 3). In the analysis of individual zones, the upper, mid- and anabranch zones revealed clear groups of nodes that corresponded to the reference and current water-resource development scenarios (Figure 4a, c and e). However, nodes within the Maranoa and Briarie zone did not group together by scenario. Rather, individual node pairs from the reference and water-resource development scenarios grouped together (Figure 4g). Thus, the hydrological character of nodes in the upper, mid- and anabranch zones was related to differences between the reference and current water-resource development scenarios whereas the hydrological character of the Maranoa and Briarie zone was node-specific and was not strongly related to scenario type. The temporal scale of flow variables associated with scenario groups in ordination space differed between the upper, mid- and anabranch zones. In the upper zone, pulse-scale variables were predominantly associated with the reference scenario and regime-scale variables were predominantly associated with the current water-resource development scenario (Figure 4b). In the mid-zone, history-scale variables were predominantly associated with the reference scenario but a mixture of regime-, history- and pulse-scale variables was associated with the current water-resource development scenario (Figure 4d). In the anabranch zone, a mixture of regime-, history- and pulse-scale variables was associated with the reference scenario but history-scale variables were predominantly associated with the current water-resource development scenario (Figure 4f ). Thus, different temporal patterns associated with water-resource development occur in each spatial hydrological zone. Copyright # 2003 John Wiley & Sons, Ltd.
River Res. Applic. 19: 443–457 (2003)
PATTERNS OF HYDROLOGICAL CHARACTER
451
Figure 3. Ordination, principal axis correlation (PCC) and tally of regime, history and pulse-scale variables associated with each zone in the (a) reference and (b) current water-resource development scenarios. Nodes are arrayed on the ordination plot (top left) according to the dendrogram groups shown in Figure 2. Lines enclose each designated hydrological zone. The association between flow variables and zone groups in ordination space is shown in the vector plot (top right), and vectors are summarized in the group association table. Acronyms are described in Table I. The histogram is a tally of regime- (R), history- (H) and pulse- (P) scale variables associated with each zone, expressed as a percentage of the total number of variables associated with each zone group
Copyright # 2003 John Wiley & Sons, Ltd.
River Res. Applic. 19: 443–457 (2003)
452
M. C. THOMS AND M. PARSONS
Figure 3. Continued
Copyright # 2003 John Wiley & Sons, Ltd.
River Res. Applic. 19: 443–457 (2003)
PATTERNS OF HYDROLOGICAL CHARACTER
453
Figure 4. Ordination and tally of regime-, history- and pulse-scale variables by individual hydrological zones. The four zones match those derived under the current water-resource development scenario (Figure 3). In the ordinations, lines enclose groups of nodes with similar hydrological character, where P ¼ reference scenario and C ¼ current water-resource development scenario. In the histograms, variables that were associated with scenario groups (vector plot not shown) are tallied by scale. Counts are expressed as a percentage of the total number of variables associated with each scenario group and n is shown in the legend
Copyright # 2003 John Wiley & Sons, Ltd.
River Res. Applic. 19: 443–457 (2003)
454
M. C. THOMS AND M. PARSONS
DISCUSSION Spatial zones of hydrological character Distinct spatial zones of hydrological character were identified in the Condamine–Balonne River. These zones were evident in both the reference and current water-resource development scenarios (Figure 2). Large-scale spatial zonation has been demonstrated for the geomorphological (Leopold and Wolman, 1957; Schumm, 1988; Davies et al., 2000; Thoms et al., 2002) and ecological character (Illies and Botosaneanu, 1963; Vannote et al., 1980) of river systems. Hydrological zonation has recently been demonstrated along the length of the Missouri River, USA (Pegg and Pierce, 2002). The present study supports those recent findings and suggests that spatial zonation of hydrological character is a fundamental property of river systems. The hydrological zones delineated in this study (Figure 2) matched the geomorphological zones determined independently by Thoms and Sheldon (2002). This match between zones of hydrological character and geomorphological zones is expected because alluvial rivers such as the Condamine–Balonne flow in self-formed channels, and display a consistency in river morphology that is adjusted to prevailing water and sediment discharges. Empirical relationships have been derived between river channel morphology and single independent flow variables such as bankfull discharge (Knighton, 1987) and dimensionless hydraulic character (Parker, 1978). However, Pickup and Rieger (1979) argue that channel form is the product of a series of discharge magnitudes, rather than a single dominant discharge. This view is also supported by the studies of Graf (1988) and Thoms and Sheldon (1996) who infer a positive relationship between channel complexity and flow variability. Correspondence of hydrological and geomorphological zones in the Condamine–Balonne River supports the view that channel form is the product of many discharge attributes and suggests a multivariate relationship between flow and channel morphology. The spatial pattern of hydrological zonation differed between flow scenarios. The mid-, lower and anabranch zones from the current water-resource development scenario did not match with zones from the reference scenario (Figure 2). This suggests that hydrological character is homogenized in these zones, in response to the pressure of water extraction that occurs directly from the channel or the harvesting that occurs on the floodplain during flood events. Impacts of water-resource development on the magnitude and frequency of flood events and low flows have been demonstrated in other Australian dryland rivers (e.g. Kingsford and Thomas, 1995; Maheshwari et al., 1995; Kingsford, 2000; Thoms and Sheldon, 2000a). However, the present study advances previous work by demonstrating that water-resource development has an impact on the spatial dimension of hydrological character at a wholeof-river-system scale. Temporal patterns of hydrological character There is a relationship between the spatial and temporal dimensions of hydrological character in the Condamine–Balonne River system. Analysis of separate scenarios (Figure 3) and analysis of individual zones (Figure 4) both showed that different scales of hydrological variables were associated with ordination groups. Thus, the temporal dimension of hydrological character is embedded within a spatial dimension of river zonation. Further, the two analyses used in this study reveal different aspects of the relationship between the spatial and temporal dimensions. Had analysis of flow variables not occurred by individual zones, the relationship between the spatial and temporal dimension would not have been fully revealed because all zones did not appear in the scale tally for each scenario (Figure 3). Even though the relationship of flow variables to hydrological zones in multivariate space does not demonstrate causality, multivariate analyses are an effective tool for examining complex patterns of hydrological character at a whole-of-river-system scale. The spatial dimension of hydrological character provides critical insight into the temporal dimension of hydrological character within the Condamine–Balonne River. This relationship may be a function of hierarchical principles. Spatial and temporal scaling are sibling concepts that can be applied to research questions as separate entities. Even when treated as separate entities, these concepts are still inextricably linked to each other because changes that occur across time may be manifest as changes across space and vice versa (Ward, 1989; Schumm, 1991; Phillips, 1995; Lane and Richards, 1997). According to hierarchy theory, ecosystems are composed of levels of organization, or holons, which are constrained within a nested vertical structure (O’Neill et al., 1986). Hierarchies are considered to be ‘nearly decomposable’ because each level of organization responds at a Copyright # 2003 John Wiley & Sons, Ltd.
River Res. Applic. 19: 443–457 (2003)
455
PATTERNS OF HYDROLOGICAL CHARACTER
characteristic spatial and temporal scale (Bergkamp, 1995). In addition, hierarchies have ‘emergent properties’ that cannot be deduced from the functioning of their parts (Allen and Starr, 1982; Bergkamp, 1995), and that arise because it is only the averaged, filtered or smoothed properties of a lower holon that can be input into higher level holons (O’Neill et al., 1986). In the present study, different patterns of temporal influence may have emerged from different analyses, because they targeted different hierarchical levels. The analysis that considered all zones together (Figure 3) was targeted at a whole-of-river-system level, and hence this analysis may only display patterns that are averages of patterns occurring at lower levels of the hierarchy. The hydrological zones observed along the Condamine–Balonne River equate to a lower hierarchical level and analysis of individual zones produced another temporal pattern of hydrological character that represents the individual zone level (Figure 4). Coupling of the spatial and temporal dimension is paramount to investigation of hydrological phenomena because important patterns may be obscured if observations are not made at the hierarchical levels at which corresponding processes occur within the river system. Water resource development in the Condamine–Balonne River has had an impact on the temporal dimension of hydrological character. In particular, there is a change in temporal hydrological diversity between the reference and current water-resource development scenarios, when scenarios are analysed separately (Figure 3). However, when scenarios are analysed together, nodes in the Maranoa and Briarie zone display a strong spatial grouping, whereas nodes in the upper, mid- and anabranch zones group according to water-resource development scenario (Figure 4). Additionally, the scale of the variables associated with ordination groups differs between analyses. For example, large regime-scale variables occur more frequently in the individual zone analysis (Figure 4) than in the separate scenario analysis (Figure 3). Therefore, it is important to examine the individual zone and whole-of-river-system levels to gain a full appreciation of the impacts of water-resource development on the temporal dimension of hydrological character in the Condamine–Balonne River. The spatial and temporal dimensions should not be uncoupled when examining hydrological character because the impacts of water resource development are manifest in both a spatial and a temporal dimension. Implications of spatial and temporal patterns of hydrological character for environmental flows Currently in Australia, and elsewhere, environmental flow approaches view rivers as uniform entities and fail to consider spatial and temporal complexity within a river system. The patterns of hydrological character observed in this study suggest that environmental flows may need to be managed at scales that capture the spatial and temporal dimensions of hydrological character in the system in question. To do this, flow variables that represent the regime, history and pulse scales of temporal influence can be calculated from discharge data. Spatial pattern can then be identified by subjecting these variables to multivariate analysis, and examining the physical location of measurement sites that have similar hydrological character. The temporal scale of flow variables associated with the spatial dimension can then be tallied and the resulting spatial and temporal patterns of hydrological character will indicate areas requiring individual management intervention. In the Condamine–Balonne, different flow restoration targets may need to be set for the upper, mid-, lower, anabranch and Maranoa zones. Additionally, the flow attributes that are manipulated in any flow strategy may differ between zones, in accordance with dominant regime, history or pulse scales of temporal influence. These zone-scale manipulations may also need to be fitted within a larger whole-of-river-system scale that considers spatial and temporal influences operating at this hierarchical level. Incorporation of a multidimensional spatial and temporal approach into existing environmental flow strategies will advance the application of the natural flow paradigm and, by association, may improve ecosystem responses to managed flows.
ACKNOWLEDGEMENTS
Gail Ransom provided assistance and instruction on the computer program used to calculate flow variables. Jon Marshall of the Queensland Department of Natural Resources and Mines supplied the discharge data and provided funds for an initial multivariate analysis. Louisa Davis produced the base Condamine–Balonne map and Desley Ferguson provided administrative support for the project.
Copyright # 2003 John Wiley & Sons, Ltd.
River Res. Applic. 19: 443–457 (2003)
456
M. C. THOMS AND M. PARSONS REFERENCES
Allen TFH, Starr TB. 1982. Hierarchy: Perspectives for Ecological Complexity. University of Chicago Press: Chicago. Arthington AH, King JM, O’Keefe JH, Bunn SE, Day JA, Pusey BJ, Bluhdorn DR, Tharne R. 1992. Development of an holistic approach for assessing environmental flow requirements of riverine ecosystems. In Water Allocation for the Environment: Proceedings of an International Seminar and Workshop, Pigram JJ, Hooper BJ (eds). Centre for Water Policy Research: University of New England, Australia; 60–67. Belbin L. 1991. Semi-strong Hybrid Scaling, a new ordination algorithm. Journal of Vegetation Science 2: 491–496. Belbin L. 1993. PATN Technical Reference. CSIRO Division of Wildlife and Ecology: Canberra, Australia. Belbin L, McDonald C. 1993. Comparing three classification strategies for use in ecology. Journal of Vegetation Science 4: 341–348. Bergkamp G. 1995. A hierarchical approach for desertification assessment. Environmental Monitoring and Assessment 37: 59–78. Black D, Sharma PK, Podger GM. 1997. Simulation modelling for the Barwon–Darling river system for management planning. In Researching the Barwon Darling, Thoms MC, Gordon A, Tatnell W (eds). Cooperative Research Centre for Freshwater Ecology: Canberra, Australia; 44–54. Clarke KR, Warwick RM. 1994. Change in Marine Communities: An Approach to Statistical Analysis and Interpretation. Plymouth Marine Laboratory: Plymouth, UK. Davies BR, Beilfuss RA, Thoms MC. 2000. Cahora Bassa retropsective, 1974–1997: effects of flow regulation on the Lower Zambezi River. Internationale Vereinigung fur Theoretishce und Angewandte Limnologie 27: 2149–2157. Digby PGN, Kempton RA. 1987. Multivariate Analysis of Ecological Communities. Chapman and Hall: London. Frissel CA, Liss WJ, Warren CE, Hurley D. 1986. A hierarchical framework for stream habitat classification: viewing streams in a watershed context. Environmental Management 10: 199–214. Gardner RH. 1998. Pattern, process, and the analysis of spatial scales. In Ecological Scale: Theory and Applications, Peterson DL, Parker VT (eds). Columbia University Press: New York; 17–34. Graf WL. 1988. Fluvial Processes in Dryland Rivers. Springer-Verlag: Berlin. Growns J, Marsh N. 2000. Characterisation of Flow in Regulated and Unregulated Streams in Eastern Australia. Cooperative Research Centre for Freshwater Ecology Technical Report 3/2000: Canberra, Australia. Gustard A. 1992. Analysis of river regimes. In The Rivers Handbook, Vol. 1, Calow P, Petts GE (eds). Blackwell: Oxford; 28–47. Harris NM, Gurnell AM, Hannah DM, Petts GE. 2000. Classification of river regimes: a context for hydroecology. Hydrological Processes 14: 2831–2848. Illies J, Botosaneanu L. 1963. Problemes et methodes de la classification et de la zonation ecologiqu des eaux courantes, considerees surtout du point de vue faunistique. Internationale Vereinigung fur Theoretishce und Angewandte Limnologie 12: 1–57. King JM, Louw D. 1998. Instream flow assessments for regulated rivers in South Africa using Building Block Methodology. Aquatic Ecosystem Health and Management 1: 109–124. Kingsford RT. 2000. Ecological impacts of dams, water diversions and river management on floodplain wetlands in Australia. Austral Ecology 25: 109–127. Kingsford RT, Thomas TRF. 1995. The Macquarie Marshes in arid Australia and their waterbirds: a 50-year history of decline. Environmental Management 19: 1–12. Knighton AD. 1987. River channel adjustment—the downstream dimension. In River Channels: Environment and Process, Richards K (ed.). Blackwell: Oxford; 95–128. Knighton AD, Nanson GG. 1994. Flow transmission along an arid zone anastomosing river, Cooper Creek, Australia. Hydrological Processes 8: 137–154. Lane SN, Richards KS. 1997. Linking river channel form and process: time, space and causality revisited. Earth Surface Processes and Landforms 22: 249–260. Leopold LB, Wolman MG. 1957. River channel patterns: braided, meandering and straight. United States Geological Survey Professional Paper: 282B. Mac Nally R, Quinn GP. 1998. Symposium introduction: the importance of scale in ecology. Australian Journal of Ecology 23: 1–7. Maheshwari BL, Walker KF, McMahon TA. 1995. Effects of regulation on the flow regime of the River Murray, Australia. Regulated Rivers: Research and Management 10: 15–38. O’Neill RV, DeAngelis DL, Waide JB, Allen TFH. 1986. A Hierarchical Concept of Ecosystems. Princeton University Press: New Jersey. Parker G. 1978. Self-formed straight rivers with equilibrium banks and mobile bed: Part 1. The sand-silt river; Part 2. The gravel river. Journal of Fluid Mechanics 89: 109–146. Pegg MA, Pierce CL. 2002. Classification of reaches in the Missouri and Lower Yellowstone Rivers based on flow characteristics. River Research and Applications 18: 31–42. Petts GE, Amoros C. 1996. The fluvial hydrosystem. In Fluvial Hydrosystems, Petts GE, Amoros C (eds). Chapman and Hall: London; 1–12. Phillips JD. 1995. Biogeomorphology and landscape evolution: the problem of scale. Geomorphology 13: 337–347. Pickup G, Rieger WA. 1979. A conceptual model of the relationship between channel characteristics and discharge. Earth Surface Processes 4: 37–42. Poff NL, Allan JD, Bain MB, Karr JR, Prestegaard KL, Richter BD, Sparks RE, Stromberg JC. 1997. The natural flow regime. BioScience 47: 769–784. Puckridge JT, Sheldon F, Walker KF, Boulton AJ. 1998. Flow variability and the ecology of large rivers. Marine and Freshwater Research 49: 55–72.
Copyright # 2003 John Wiley & Sons, Ltd.
River Res. Applic. 19: 443–457 (2003)
PATTERNS OF HYDROLOGICAL CHARACTER
457
Queensland Department of Natural Resources. 2000. Condamine-Balonne WAMP Environmental Flow Technical Report. Queensland Department of Natural Resources: Brisbane, Australia. Richter BD, Baumgartner JV, Wigington R, Braun DP. 1997. How much water does a river need? Freshwater Biology 37: 231–249. Schumm SA. 1988. Variability of the fluvial system in space and time. In Scales and Global Change, Rosswall T, Woodmansee RG, Risser PG (eds). Wiley: Chichester; 225–250. Schumm SA. 1991. To Interpret the Earth: Ten Ways to Be Wrong. Wiley: New York. Schumm SA, Lichty RW. 1965. Time, space and causality in geomorphology. American Journal of Science 263: 110–119. Sims N, Thoms MC, Levings PF, McGinness HM. 1999. Large Scale Vegetation Response to Wetting on the Lower Balonne Floodplain . Report to the Lower Balonne Floodplain Advisory Committee. Cooperative Research Centre for Freshwater Ecology: Canberra, Australia. Thoms MC, Sheldon F. 1996. The importance of channel complexity for ecosystem processing: an example of the Barwon–Darling River. In Proceedings of the First National Conference on Stream Management in Australia, Rutherfurd I, Walker M (eds). Monash University: Australia; 111–118. Thoms MC, Sheldon F. 2000a. Water resource development and hydrological change in a large dryland river: the Barwon–Darling River, Australia. Journal of Hydrology 228: 10–21. Thoms MC, Sheldon F. 2000b. Lowland rivers: an Australian introduction. Regulated Rivers: Research and Management 16: 375–383. Thoms MC, Sheldon F. 2002. An ecosystem approach for determining environmental water allocations in Australian dryland river systems: the role of geomorphology. Geomorphology 47: 153–168. Thoms MC, Hill SM, Spry MJ, Chen XJ, Mount TJ, Sheldon F. 2002. The geomorphology of the Darling Basin. In The Barwon Darling Catchment, Breckwodth R, Boden R (eds). Murray Darling Basin Commission: Canberra; 1–29. Vannote RL, Minshall GW, Cummins KW, Sedell JR, Cushing CE. 1980. The river continuum concept. Canadian Journal of Fisheries and Aquatic Sciences 37: 130–137. Ward JV. 1989. The four-dimensional nature of lotic ecosystems. Journal of the North American Benthological Society 8: 2–8.
Copyright # 2003 John Wiley & Sons, Ltd.
River Res. Applic. 19: 443–457 (2003)