IMPACT OF SPATIAL RESAMPLING METHODS ON THE RADIOMETRIC ACCURACY OF AIRBORNE IMAGING SPECTROMETER DATA* D.Schläpfer, M.Schaepman, and Peter Strobl* Remote Sensing Laboratories (RSL), Department of Geography, University of Zurich, CH-8057 Zurich, Switzerland Phone: +41 1 635 52 50, Fax: +41 1 635 68 46, E-mail:
[email protected] * German Aerospace Center (DLR), Remote Sensing Technology Institute, Wessling, Germany
ABSTRACT Missing data values in imaging spectrometer data are an issue of concern. Individual pixels or lines may be missing in the raw data due to bad pixels originating from the detector, readout errors, or even electronic failures. Secondly, spatial under- or oversampling of the image data may occur due to sensor movements, inaccurate registration, or variations of the scan frequency. The reconstruction of such missing values is a critical issue. Specifically in spectroscopy, any interpolation produces 'articifical' spectra which may be different from real measurements. Therefore nearest neighbour interpolations have been widely used to replace these values. An error analysis based on real imaging spectrometer data from various sensors over various land cover types is performed. The real measurements are replaced systematically by interpolated values and the average deviation between artificial and resampled spectra is taken as measure for the error. Nearest neighbour resampling, linear, bilinear interpolation, and triangulation methods are compared. It is found that linear interpolation methods are preferrable for the replacement of missing values in the calibration chain of airborne optical scanner systems as well as for the geocoding methodology of imaging spectrometer data.
1.0 INTRODUCTION The interpolation of missing spectra in imaging spectroscopy is an issue which is critical for three reasons: First, the missing pixels may be persistent in the imagery due to detector failures. Such pixels need to be replaced to increase the consistency of subsequent processing steps. Second, geocoding of airborne scanner data usually leaves ‘gaps’ in the image data on the ground which need to be filled by meaningful values (Schläpfer et al., 1998). Third, the spatial co-registration of all image pixels from band to band and between the two detector arrays is critical. Strategies are to be defined how to process such misregistrations or how to construct a sensor with minimal effects since no software can currently handle individually defective pixels in pushbroom intsruments efficiently.
*
Presented at the Fifth International Airborne Remote Sensing Conference and Exhibition, September 17th to 20th 2001, San Francisco, USA
The whole problem can be summarized in the term “spectral uniformity”, which describes the consistency in location and spectral sampling of every single pixel acquired by an imaging spectrometer (Mouroulis et al., 2000). The impact of spatial mis-registration on the spectral uniformity is investigated in this paper. Moreover, various interpolation methods are compared for their potential correcting the artefacts of spectral non-uniformity. Nearest neighbour techniques have been proposed so far for such replacements to avoid the construction of never measured (‘innatural’) spectra. The problem of applying nearest neighbour techniques is a loss in spatial accuracy. Therefore, it is investigated which errors are introduced to the data using other interpolation approaches.
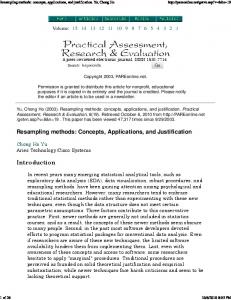
2.0 METHOD It is tested how resampling affects the spectral accuracy of spectra. A method based on real data sets has been chosen for proper representation of the errors involved with spatial resampling. Four types of masks are created which represent missing individual pixels, missing lines, or groups of missing lines respectively (see Figure 1). All masked pixels are then replaced by interpolated spectra from the ‘white’ neighbouring pixels. Four types of interpolation are compared (Burrough and McDonnell, 1997): • nearest neighbour (‘first come first serve’ - approach for pixels in same distance), • linear interpolation (x/y direction separately), • bilinear interpolation (strictly bilinear in two explicite directions), and • triangulation (multilinear interpolation). Triangulation may be using quintic polynoms instead of a multilinear approach for a better approximation of the missing values. Although the quintic interpolation is theoretically superior, it is only tested shortly due to its high computing demands. The systematically resampled spectra are then compared to the real spectra at the very same spatial position (xy) over masked image areas. The mean relative deviation e λ between the original pixel P xy and the interpolated value I xy is then taken as measure for the error which is involved by the interpolation method: xy – I xy . eλ = P ------------------P xy λ
(1)
For comparison, the maximum relative error is defined as mean deviation of the original image values under the mask to the average image spectrum:
mask 1
mask 2
mask 3
mask 4
Figure 1. Mask patterns used for spatial resampling. The black mask areas are replaced by interpolated spectra for comparison with original data.
xy – Im . e λ, ref = P ------------------P xy λ
(2)
If interpolation results are achieved close to this generic error, the interpolation obviously has failed to create an improved replacement of mis-registered image pixels. The derivation of geometric measures depends highly on the spatial pattern observed in the imaging spectrometer data. We therefore focus the analysis on real test data of available imaging spectrometer systems. This procedure is advantageous as no assumptions on the spatial distribution of distinct synthetic targets have to be taken. The obtained deviations indicate which radiometric error is introduced in the data if spatial mis-registration effects are corrected by interpolation. This result is equivalent to the error which remains in the data if no interpolation is applied and the spectral uniformity of a pixel is not given. For standard imagery such as the AVIRIS and the HyMap, the replacement of these pixels represents an interpolation of 1 pixel distance – the results need to be appropriately reduced to represent sub-pixel mis-registrations. If spatially oversampled data can be used (e.g. at a rate of 2), the same analysis represents 0.5 pixels interpolation and represents the case where intermediat values between pixels are interpolated.
3.0 DATA BASIS The error introduced by such resampling techniques shall be quantified using existing high quality imaging spectrometer data. Three exemplary data sets have been selected for that purpose. Their basic information is summarized in Table 1. The represented land covers are desert and mining with scattered vegetation for the AVIRIS scenes and agriculture and forestry in the HYMAP scene (compare Figure 2). A scene of the DAIS 7915 has been included in the analysis which intentionally was flown at a high oversampling rate over a typical mid-European landscape – this makes this scene specifially suited for comparison of interpolated values to real measurements. Table 1. Data basis for spatial resampling analysis with geometric description (GSD: Ground Sampling Distance, PSF: approximative geometric Point Spread Function at FWHM). Type
Target
Date
GSD
PSF
Flight Altitude
AVIRIS low altitude
Mining
3.10.1998
3.6 m
5m
4.0 km
AVIRIS high altitude
Desert
5.6.1998
20.2 m
28.3 m
20.9 km
Hymap
Agriculture
2.6.1998
2.8 m
3.6 m
3.2 km
DAIS
Settled
8.7.1997
4.5 m
12 m
4.1 km
The data sets are chosen with typical but very distinct surface cover characteristics . The AVIRIS scenes represent a natural landscape of scattered patterns with little anthropogenic influence. The HYMAP and the DAIS scenes on the other hand are totally human-made landscape with distinct fields of systematic pattern and settlement structures. The scenes are representative for a huge part of the applications in imaging spectroscopy. The calibrated (Level 1C) image data is used for the analysis. Potential resampling operations would have to be done on this level since interpolations are biased if done on data of most other processing levels. On raw data, values of differing calibration status would be directly compared whereas on geometrically processed data, the original data acquisition geometry is lost.
Figure 2. Test data sets (subsets) for the geometric resampling. From left to right: AVIRIS low altitude, AVIRIS high altitude, HYMAP, DAIS.
4.0 RESULTS 4.1.
RESULTS USING AVIRIS DATA
A first analysis involving all interpolation methods has been executed on a subset of the AVIRIS low altitude data (Green et al., 1998). Although quintic triangulation proved to be superior for this data by about 20 percent in comparison to linear triangulation, it can not been further considered due to its computing ressources requirements (processing time quintic triangulation: 2 hours for a sub-cube of 400x400x64 pixels, on an average speed machine). The errors of the four applied interpolation methods are between 5 and 20% for the replacement of single pixels and lines, dependent on the wavelength and the interpolation method (see Figure 3, bottom). The peak at lowest wavelengths is directly related to the high noise observed in these bands while the second peak at 680 nm is rather related to the maximal Chlorophyll absorption at this wavelength. Bilinear and triangulated interpolation both proved to be superior to nearest neighbour replacement techniques by a factor up to 2. The triangulation yields best results if only individual pixels have to be replaced while there is no significant improvement in comparison to linear interpolation for the replacement of whole lines as for masks 2 to 4. If pixels in a distance larger than the pixel size have to be replaced (i.e. for the black pixels of mask 4), the interpolation becomes very inaccurate. The errors are almost on the same level as if the average spectrum would have been taken as interpolated value. For all these cases, the nearest neighbour replacement is significantly worse than any other interpolation method. The error in nearest neighbor resampling is almost independent on the mask pattern. The triangulation error on the other hand is significantly lower for the replacement of pixels directly adjacent to the original values. However, the relative advantage of triangulation decreases drastically for pixels ‘in the second line’ (black pixels of mask 4 as of Figure 1). The analysis is now extended to AVIRIS high altitude data. The validation can be restricted to a reduced number of masks and methods for the intercomparison to the low altitude data. Bilinear interpolation can be skipped due to the mask patterns which only allow for interpolations in y-direction. Only mask 1 has been used for cross comparison of the results between low and high altitude imagery. Figure 4 depicts
maximum mask 4 mask 3
maximum
mask 2
mask 1
Figure 3. Resampling errors for AVIRIS low altitude data in comparison to the maximum error (most upper curve). The upper graphic referes to masks 3 and 4 while the lower graphic refers to masks 1 and 2. The lower lines per interpolation kind correspond to masks 1 and 3, respectively.
Figure 4. AVIRIS high altitude results for mask 2 and the whole wavelength range.
that the absolute deviations are reduced by about one third in comparison to the low altitude data. Nearest neighbour resampling is still viable although the linear interpolation yields better results for the whole wavelength range. The general lower level of errors while interpolating the high altitude data can be explained by the more homogeneous patterns in the imagery at 20 meters resolution in comparison to 4 meters. The scattered vegetation influenceing the low altitude data does no longer lead to evident signatures in the high altitude imagery. In general, the best interpolation method leads to an error level of 3-5% for high altitude data, while for low altitude data the error is in a range of 5-10%. This error level is attributed to the expected error for the replacement of individual AVIRIS pixels or an interpolation to 1 pixel distance.
4.2.
RESULTS USING HYMAP DATA
The same analysis has also been performed on the HyMap data set described above. No significant increase of the errors in comparison to the AVIRIS low altitude data is observed although the heterogeneity of the HyMap data is significantly higher. A very little differences between the various resampling methods is evident if only one line is replaced. This fact can be explained by the numerous quasi-homogeneous fields and the strict borders between fields in the test scene where nearest neighbour interpolations do not lead to significantly worse results than linear interpolation. The spectral pattern of the errors is highly comparable to the AVIRIS low altitude data. The dominant vegetation leads to a higher peak in the Chlorophyll absorption, while other artefacts are related to the sensor noise characteristics. For the resampling of the ‘second line’ (i.e. the black pixels of mask 4 in Figure 1) the linear interpolation again performs better than the nearest neighbour, while both interpolation methods are significantly better than a generic replacement of the pixels by the image mean. The observed levels of error are between 10 and 13% which is higher than for AVIRIS data. The order magnitude of this error consistent to what was found on the AVIRIS low altitude data although the scene is completely different for its spatial pattern as well as for the targets represented in the imagery. The high variability in the scene combined with the good spatial resolution of the HyMap data may have led to this result. We conclude on a good general qualitative validity of the results using this kind of error analysis.
Figure 5. Interpolation errors for HyMap data in an agricultural areas based on mask 4 (three lines missing).
4.3.
RESULTS USING DAIS DATA
The DAIS optical system is known for its high oversampling rate in both, spatial and spectral dimension (Strobl et al., 1997). A special data set (s. Figure 2) has been acquired by DLR Oberpfaffenhofen to investigate oversampling effects in DAIS imagery. If in this data set every second line is omitted, a normal, non-oversampled image can be approximated. The left-out lines inbetween can now be compared to the resampling results from its neighbours to analyse sub-pixel resampling artefacts. The magnitude of errors for such resampling may be derived by the methods described above. This kind of data analysis is best suited to derive magnitude of errors which will occur if frown or smile effects need to be resampled. The spatial dependence of the values can be visualized by the creation of variograms of the imagery (see Figure 6, left). The respective relative standard deviation describes the distance-dependent average deviation between compared pixel values. The relative difference is in the range of 10% for one pixel dis-
Figure 6. Left: DAIS variogram at 600 and 880 nm, plotted as distance dependent relative standard deviation ( γ ). Right: DAIS spatial interpolation errors equivalent for replacement of one spacial pixel (equivalent to a 0.5 pixels correction of frown distortions).
tance while it grows up to 30% for 5 pixels and more. The variogram shows for the given scene that the spatial dependencies are within up to 5 pixels. Longer distance show almost no further increase in variance and therefore the respecive distant pixel values are basically independent of the starting pixel. This relation also implies that interpolation only is meaningful for a distance of 1 to 5 DAIS pixels. For higher distances, any replacement method will only perform as well as an arbitrary average spectrum. The spatial interpolation error for one pixel distance (c.f., mask 2 of Figure 1) is depicted in Figure 6. The best-case deviations are in the range of ±5%. The interpolation can thus reconstruct the spectra only partially from the neighbour values although the whole surface has been registered continously. Assuming a data-intrinsic noise level of 2-3%, a residual of about 4 % must be attributed to the impact of interpolation. Nearest neighbour pixel replacement clearly produces worse results for this oversampled data set than linear interpolation.
5.0 CONCLUSIONS The results of these experiments are in contrast to an often-heard paradigma in imaging spectroscopy that no ‘artificial’ spectra shall be produced using linear interpolation (e.g.). A significant higher error in the spectra derived by nearest neighbour resampling is observable in comparison to other interpolation methods. This difference is higher for sensors having a broad PSF and over natural areas while for manmade landscapes and ‘sharp’ image pictures, nearest neighbour methods perform almost as good as interpolations. In average, no significant difference between the linear interpolation and the triangulation interpolation approach has been found. The triangulation has an advantage for the replacement of individual pixels while linear interpolations are preferred for the replacement of complete missing lines. The latter is explained by the higher weighting of the direct neighbours in linear interpolation. It is thus recommended to use linear interpolation methods if pixels are to be replaced within short distances and if mis-registrations are to be corrected. Furthermore it has been shown that the replacement of pixels outside the reach of the pixel PSF is very questionable and should be avoided wherever possible. We recommend to interpolate only to distances within the reach of a pixel PSF (i.e. 1-2 pixels) any higher distance interpolation is rather done by nearest neighbour or the respective pixels have to be left blank and clearly marked.
The herewith derived spectrally dependent errors are useful for the definition of specification for upcoming instruments such as APEX (Itten et al., 1997). Extensive analysis of oversampled data sets in both the spectral and the spatial domain will lead to results supporting the derivation of frown and smile. Recommendations of frown specification can already derived from the values given in this paper, while the correction of smile artefacts needs similar analysis in the spectral domain (see also Schläpfer et al., 1999). Another specification concerns the distribution of missing pixels. The above investigations have shown that interpolation of missing values comes close to a generic guess if distances higher than 2 pixels are interpolated. If gaps in the data acquisition occur, they therefore shall not be larger than 2 pixels in diameter. This constraint has two implications: stabilizing systems for an airborne instrument shall lead to as much stability that the sensor movement during the image scan process will not lead to undersampling of more than 2 pixel sizes distance. Furthermore, blind pixels on the detector and line failures shall be isolated (maximally 2 pixels diameter) – if they occur at all. The experiments in this study give an order of magnitude for the expected errors if interpolations need to be done due to spectral or spatial misregistrations or undersampling. The values have been derived from exemplary real imaging spectrometer data and thus are only of limited generic validity. Anyhow, due to the representative selection of scenes and sensors we do not expect other orders of magnitude of the errors if the same analyses would be applied for different sensor configurations.
6.0 ACKNOWLEDGEMENTS This work has been supported by the ESA/ESTEC contract 14906/00/NL/DC. NASA/JPL and the AVIRIS team is greatfully acknowledged providing the AVIRIS data.
7.0 REFERENCES Burrough P.A., and McDonnell R.A., 1997: Principles of Geographical Information Systems. Oxford University Press, pp. 333. Green R.O., Eastwood M.L., Sarture C.M., Chrien T.G., Aronsson M., Chippendale B.J., Faust J.A., Pavri B.E., Chovit C.J., Solis M., Olah M.R., and Williams O., 1998: Imaging Spectroscopy and the Airborne Visible/ Infrared Imaging Spectrometer (AVIRIS). Remote Sens. Environ., Elsevier, 65:227-248. Itten K.I., Schaepman M., De Vos L., Hermans L., Schlaepfer H., and Droz F., 1997: APEX-Airborne Prism Experiment: A New Concept for an Airborne Imaging Spectrometer. Proc. 3rd Intl. Airborne Remote Sensing Conference and Exhibition, ERIM, Copenhagen (DK), I:181-188. Mouroulis P., Green R.O., and Chrien T.G., 2000: Design of pushbroom imaging spectrometers for optimum recovery of spectroscopic and spatial information. Appl. Optics, OSA, 39(13):2210-2220. Schläpfer D., Börner A., and Schaepman M., 1999: The Potential of Spectral Resampling Techniques for the Simulation of APEX Imagery based on AVIRIS Data. Summaries of the Eighth JPL Airborne Earth Science Workshop, JPL, Pasadena (CA), 99-17:377-384. Schläpfer D., Schaepman M., and Itten K.I., 1998: PARGE: Parametric Geocoding Based on GCP-Calibrated Auxiliary Data. Descour, M.R. and Shen, S.S. (Eds.), Imaging Spectrometry IV, SPIE, San Diego, 3438:334344. Strobl P., Müller A., Schläpfer D., and Schaepman M., 1997: Laboratory Calibration and In-flight Validation of the Digital Airborne Imaging Spectrometer DAIS 7915. Alg. for Mult. and Hyp. Im. III, SPIE, Orlando, 3071:225-236.