Figure 2.4 Flow and scour around a bridge abutment and embankment in a ..... Figure 8.7 Trend for maximum velocity in the floodplain and main channel of the ...
Insights from Depth-Averaged Numerical Simulation of Flow at Bridge Abutments in Compound Channels
Reinaldo Morales, PhD Robert Ettema, PhD, PE Department of Civil and Architectural Engineering University of Wyoming Laramie, WY 82071
July 2011
Acknowledgements The authors thank the funding agencies supporting this study:
The Mountain-Plains Consortium, Project NDSU48510ETMA, Maximum velocity and Shear Stress in Flow Field around Bridge-Abutments in Compound Channels. Principal Investigator Robert Ettema National Cooperative Highway Research Program Project 24-20, Estimation Abutment Scour. Principal Investigator Robert Ettema
Disclaimer The contents of this report reflect the work of the authors, who are responsible for the facts and the accuracy of the information presented. This document is disseminated under the sponsorship of the Mountain-Plains Consortium in the interest of information exchange. The U.S. Government assumes no liability for the contents or use thereof. North Dakota State University does not discriminate on the basis of age, color, disability, gender expression/identity, genetic information, marital status, national origin, public assistance status, sex, sexual orientation, status as a U.S. veteran, race or religion. Direct inquiries to the Vice President for Equity, Diversity and Global Outreach, 205 Old Main, (701)231-7708.
ABSTRACT Two-dimensional, depth-averaged flow models are used to study the distribution of flow around spillthrough abutments situated on floodplains in compound channels and rectangular channels (flow on very wide floodplains may be treated as rectangular channels). The study leads to useful insights regarding distributions of flow velocity, unit discharge, and boundary shear stress at spill-through abutments. It also presents insights from extensive assessment of uncertainty associated with the use of depth-averaged modeling of flow at abutments. Of substantial use for design determination of abutment scour at bridge waterways is estimation of the magnitude of peak values of flow velocity, boundary shear stress, and unit discharge in the region where scour develops. The study, by showing how abutment flow fields adjust in response to variations of abutment length, floodplain width, and main channel dimensions, yields important trends regarding the magnitude of amplification factors for depth-averaged velocity, unit discharge, bed shear stress, and distance to peak unit discharge. Early studies are shown to provide rather limited and inadequate amplification values associated only with a narrow range of abutment and channel geometries examined. The present study comprises a much broader range of abutment lengths, channel shapes, and floodplain dimensions than heretofore reported in the literature. The study’s insights, from its assessment of uncertainty associated with the use of depth-averaged modeling of flow at abutments, yield a relationship for estimating the optimum mesh size for use with depth-averaged models. The relationship is applicable to other subsequent studies using depth-averaged models of flow around abutments or similar hydraulic structures. Prior studies addressing the effect of mesh size on numerical error have not provided a recommendation for an average optimum mesh size. The study also gives focused recommendations for topics requiring further investigation.
TABLE OF CONTENTS 1. INTRODUCTION ................................................................................................................................ 1
1.1
Problem Statement and Motivation ................................................................................ 1
1.2
Scope and Objectives ...................................................................................................... 1
1.3
Methodology ................................................................................................................... 2
1.4
Structure of Thesis .......................................................................................................... 2
2. BACKGROUND ................................................................................................................................... 5
2.1
Abutment Form, Layout, and Construction .................................................................... 5 2.1.1 2.1.2 2.1.3
Abutment Form ................................................................................................. 5 Abutment Layout .............................................................................................. 5 Abutment Dimensions and Construction .......................................................... 5
2.2
Flow Field ....................................................................................................................... 6
2.3
Scour Processes ............................................................................................................... 7 2.3.1 2.3.2 2.3.3 2.3.4
General Scour.................................................................................................... 7 Abutment Scour ................................................................................................ 7 Clear-Water and Live-Bed Scour...................................................................... 7 Scour Conditions............................................................................................... 8
3. LITERATURE REVIEW .................................................................................................................. 13
3.1
Introduction ................................................................................................................... 13
3.2
Abutments in Compound Channels .............................................................................. 14 3.2.1 3.2.2 3.2.3
3.3
Vertical Wall Abutments in Rectangular Channels ...................................................... 15 3.3.1 3.3.2
3.4
Laboratory Experiments.................................................................................. 14 Numerical Studies ........................................................................................... 14 Summary ......................................................................................................... 15
Laboratory Experiments.................................................................................. 15 Numerical Studies ........................................................................................... 16
Wing-Wall Abutments in Rectangular Channels .......................................................... 17
3.5
Cylindrical Piers in Rectangular Channels ................................................................... 17 3.5.1 3.5.2
3.6
Laboratory Experiments.................................................................................. 17 Numerical Studies ........................................................................................... 18
Studies about Mesh Size and Error in Numerical Flow Simulations............................ 19
4. TWO-DIMENSIONAL NUMERICAL MODEL ............................................................................ 21
4.1
Description of FESWMS .............................................................................................. 21
4.2
Governing Equations .................................................................................................... 21
4.3
4.2.1 The Continuity Equation ................................................................................. 22 Model Development...................................................................................................... 24 4.3.1 4.3.2 4.3.3 4.3.4 4.3.5
Channel Geometry .......................................................................................... 24 Boundary Conditions ...................................................................................... 25 Abutment Form and Layout ............................................................................ 26 Model Parameters ........................................................................................... 27 Mesh Type and Size ........................................................................................ 29
5. LABORATORY HYDRAULIC MODEL AND EXPERIMENTS ................................................ 33
5.1
Introduction ................................................................................................................... 33
5.2
Experimental Setup ....................................................................................................... 33 5.2.1 5.2.2
Test Facility .................................................................................................... 33 Abutment Model ............................................................................................. 34
5.3
Flow Setup .................................................................................................................... 34
5.4
Surface Velocity Measurements ................................................................................... 35 5.4.1 5.4.2 5.4.3 5.4.4 5.4.5 5.4.6 5.4.7 5.4.8
Benchmarks..................................................................................................... 35 Illumination ..................................................................................................... 35 Seeding ............................................................................................................ 35 Recording ........................................................................................................ 35 Image Processing and Transformation............................................................ 36 Grid Definition ................................................................................................ 36 Velocity Calculation and Filtering .................................................................. 36 Summary of LSPIV Parameters ...................................................................... 36
5.5
ADV Velocity Measurements ....................................................................................... 37
5.6
Uncertainty Assessment ................................................................................................ 37
6. UNCERTAINTY ASSESSMENT ..................................................................................................... 49
6.1
Introduction ................................................................................................................... 49
6.2
Methodology ................................................................................................................. 49
6.3
Uncertainty Due To Mesh Size ..................................................................................... 51 6.3.1 6.3.2
Qualitative Analysis ........................................................................................ 51 Quantitative Analysis ...................................................................................... 52
6.4
Uncertainty Due To Convergence Limit....................................................................... 55
6.5
Uncertainty Due To Relaxation Factor ......................................................................... 55
6.6
Summary ....................................................................................................................... 57
7. OPTIMIZATION OF MESH SIZE .................................................................................................. 65
7.1
Introduction ................................................................................................................... 65
7.2
Numerical Experiments ................................................................................................ 65
7.3
Results ........................................................................................................................... 66
7.4
Objective Function ........................................................................................................ 66
7.5
Data Analysis ................................................................................................................ 67
7.6
Recommended Optimum Mesh Size ............................................................................ 68
8. FLOW AROUND SPILL-THROUGH ABUTMENTS IN COMPOUND CHANNELS ............. 77
8.1
Introduction ................................................................................................................... 77
8.2
Validation of Numerical Model .................................................................................... 77
8.3
Results ........................................................................................................................... 78 8.3.1 8.3.2 8.3.3 8.3.4 8.3.5
Depth-Averaged Velocity ............................................................................... 78 Unit Discharge ................................................................................................ 80 Boundary Shear Stress .................................................................................... 81 Flow Distribution between Floodplain and Main Channel ............................. 82 Distance to Peak Unit Discharge .................................................................... 83
9. CONCLUSIONS AND RECOMMENDATIONS ......................................................................... 101
9.1
Uncertainty.................................................................................................................. 101
9.2
Flow Field ................................................................................................................... 102
9.3
Recommendations for Further Research ..................................................................... 103
REFERENCES ........................................................................................................................................ 105
LIST OF TABLES Table 3.1 Comparison of two studies with vertical wall abutments in rectangular channels ................... 16 Table 3.2 Summary of numerical studies on flow at cylindrical piers ...................................................... 18 Table 4.1 Channel dimensions used in the numerical models .................................................................. 25 Table 4.2 Channel dimensions used in the numerical models .................................................................. 26 Table 4.3 Channel dimensions used in the numerical models .................................................................. 26 Table 4.4 Manning’s roughness coefficient and kinematic eddy viscosity assigned to the boundary materials used in the numerical model ...................................................................................... 29 Table 5.1 Constants used in the uncertainty computations ....................................................................... 38 Table 5.2 Results of uncertainty assessment ............................................................................................. 39 Table 5.3 Sample computation for uncertainty assessment of the streamwise velocity component ......... 40 Table 5.4 Sample computation for uncertainty assessment of the transverse velocity component .......... 41 Table 6.1 Sample calculation for mesh uncertainty assessment under conditions of oscillatory convergence .............................................................................................................................. 53 Table 6.2 Sample calculation for mesh uncertainty assessment under conditions of monotonic convergence .............................................................................................................................. 54 Table 7.1 Discretization error and run-time for different mesh sizes ....................................................... 66 Table 7.2 Mean value and standard deviation for different variables with various mesh sizes ................ 68
LIST OF FIGURES Figure 2.1
The geometry and dimensions of a standard-stub abutment commonly used for spill-through abutments (prototype scale indicated). ............................................................... 9
Figure 2.2
The geometry and dimensions of a wing-wall abutment. The compacted earthfill embankment extends back from the abutment structure (prototype scale indicated). ........... 10
Figure 2.3
Flow through a short contraction. .......................................................................................... 11
Figure 2.4
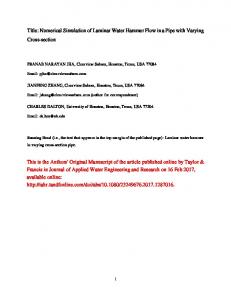
Flow and scour around a bridge abutment and embankment in a compound channel. ......... 11
Figure 2.5
Abutment-scour conditions: (a) Scour Condition A - hydraulic scour of the main-channel bed causes bank failure, which causes a failure of the face of the abutment embankment; (b) Scour Condition B - hydraulic scour of the floodplain causes failure of the face of the abutment embankment; (c) Scour Condition C – breaching of the approach embankment exposes the abutment column so that scour progresses as if the abutment column were a form of pier. ................................................... 12
Figure 4.1
Schematic showing the two channel types used in the numerical model.In the picture, the abutment form is spill-through, ant the abutment is sited on the floodplain (L ≤ Bf). ..... 30
Figure 4.2
Eddy viscosity computed from the equation proposed by Sukhodolov et al. (1998) compared with flume ADV data. In the legend, Y = Yorozuya (2005) and K = Kirkil (2004). .................................................................................................................. 31
Figure 4.3
Views of a hybrid mesh used in the models: (a) plan view; (b) enlarged isometric view of the area of interest..................................................................................................... 32
Figure 5.1
The water-sediment recirculating flume facility used for the experiments. .......................... 42
Figure 5.2
Laboratory flume layout. ....................................................................................................... 43
Figure 5.3
Cross sectional view of the flume. ......................................................................................... 44
Figure 5.4
Isometric view of the flume. .................................................................................................. 45
Figure 5.5
The abutment model. (Note: abutment length varies). .......................................................... 46
Figure 5.6
Head drop and discharge relationship for 0.20m-diameter orifice flow meter. ..................... 46
Figure 5.7
Camera view showing the location of the benchmarks posts for LSPIV measurements. The posts are located at the indicated points. ........................................................................ 47
Figure 5.8
Flow visualization around the abutment; (a) original camera image showing seeding process; (b) velocity vectors obtained after LSPIV processing. ............................................ 48
Figure 6.1
Contours of unit discharge and streamlines in a compound channel with four different mesh sizes: (a) 40cm mesh; (b) 20cm mesh; (c) 10cm mesh; (d) 5cm mesh. ....................... 58
Figure 6.2
Error contours in a compound channel with two different mesh sizes: (a) error in unit discharge with 10cm mesh; (b) error in unit discharge with 5cm mesh; (c) error in water surface elevation with 10cm mesh; (d) error in water surface elevation with 5cm mesh. .............................................................................................................................. 59
Figure 6.3. Contours of unit discharge and streamlines in a compound channel with different convergence limits (CL): (a) CL = 8E-4; (b) CL = 4E-4; (c) CL = 2E-4; (d) CL = 1E-4. ... 60 Figure 6.4
Error contours in a compound channel with two different convergence limits (CL): (a) error in unit discharge with CL = 0.0008; (b) error in unit discharge with CL = 0.0001; (c) error in water surface elevation with CL = 0.0008; (d) error in water surface elevation with CL = 0.0001. .................................................................................................................. 61
Figure 6.5
Contours of unit discharge and streamlines in a compound channel with different relaxation factors (RF): (a) RF = 0.8; (b) RF = 0.4; (c) RF = 0.2; (d) RF = 0.1. ................... 62
Figure 6.6
Error contours in a compound channel with two different relaxation factors (RF): (a) error in unit discharge with RF = 0.4; (b) error in unit discharge with RF = 0.1; (c) error in water surface elevation with RF = 0.4; (d) error in water surface elevation with RF = 0.1. ........................................................................................................................ 63
Figure 7.1
Schematic views of two mesh sizes (four sizes were used). .................................................. 70
Figure 7.2
Comparison of water depth contours, as obtained with meshes of two different sizes: 0.40m and 0.10m. .................................................................................................................. 71
Figure 7.3
Comparison of velocity contours, as obtained with meshes of two different sizes: 0.40m and 0.10m. .................................................................................................................. 72
Figure 7.4
Comparison of shear velocity contours, as obtained with meshes of two different sizes: 0.40m and 0.10m. .................................................................................................................. 73
Figure 7.5
Comparison of kinematic eddy viscosity contours, as obtained with meshes of two different sizes: 0.40m and 0.10m. .......................................................................................... 74
Figure 7.6
Normalized values of discretization error and run time. ........................................................ 75
Figure 7.7
Objective function (O.F.) and optimum mesh size. ............................................................... 76
Figure 8.1
Fully developed velocity profile at the beginning of the test section. ................................... 85
Figure 8.2
Measurements of kinematic eddy viscosity, t . The theoretical value is given by Eq. (4.14). .............................................................................................................................. 85
Figure 8.3
Comparison of model results and experimental ADV and LSPIV measurements at a cross section passing through the abutment centerline (refer to Figure 8.4 showing exact location)........................................................................................................................ 86
Figure 8.4
Location of the cross section of interest. ............................................................................... 87
Figure 8.5
Schematic of flow contraction and macro-turbulence generation associated with flow through a bridge waterway in a compound channel (main channel with floodplain). ........... 88
Figure 8.6
Depth-averaged velocities (m/s) in the region of interest for various values of L/Bf, with Bf/B = 0.70. .................................................................................................................... 89
Figure 8.7
Trend for maximum velocity in the floodplain and main channel of the contracted section for increasing L/Bf. Values of Bf/B ≤ 0.90. ................................................................ 90
Figure 8.8
Contours of discharge per unit width for different values of L/Bf, with Bf/B = 0.70. ........... 91
Figure 8.9
Comparison of unit discharge distribution trends with different abutment lengths for Bf/B = 0.7.......................................................................................................................... 92
Figure 8.10 Trends of unit discharge amplification in floodplain and main channel with varying L/Bf and Bf/B. ......................................................................................................................... 93 Figure 8.11 Bed shear stress around abutments of different lengths for the case of Bf/B = 0.70. ............. 94 Figure 8.12 Comparison of bed shear stress distribution with different abutment lengths for Bf/B = 0.70. ....................................................................................................................... 95 Figure 8.13 Trends for bed shear stress amplification in floodplain and main channel with varying L/Bf and Bf/B; o is the average bed shear stress in the floodplain or main channel for the approach flow upstream of the abutment. .............................................................................. 96 Figure 8.14 Trends of percentage of floodplain flow (FP) entering the main channel for different L/Bf and Bf/B. ......................................................................................................................... 97 Figure 8.15 Definition sketch for distance to peak unit discharge (Dtp); (a) the peak is located in the floodplain, (b) no clear peak location in the very short floodplain. ....................................... 98 Figure 8.16 Trends of distance to peak unit discharge (Dtp) for various abutment lengths. ..................... 99
LIST OF SYMBOLS Alphabetical Symbols B Bf Bf Bk Bm cf Ck D d50 Dtp g H L Limg Lobj n N P Pe pk q Q q1 qm qmax qx qy Rk rk
channel half width; floodplain half width; floodplain half width; bias limit; main channel half width; friction coefficient; correction factor; pier diameter; median particle size; distance to peak unit discharge; acceleration of gravity; depth of flow; length of abutment; width in the digital image (pixels); width in the object plane (physical distance); Manning’s roughness coefficient; number of images; precision limit; Peclet number; order of accuracy; flow rate per unit width; total flow rate; unit discharge in approach flow; net inflow or outflow per unit area (FESWMS); maximum flow rate per unit width; flow rate per unit width in the streamwise direction (FESWMS); flow rate per unit width in the transverse direction (FESWMS); convergence ratio; refinement ratio;
S
particle displacement (pixels); time; average velocity; shear velocity associated with the flow; uncertainty; maximum depth-averaged velocity; undisturbed approach depth average velocity in channel; local depth-averaged streamwise velocity; horizontal streamwise velocity fluctuation; magnitude of velocity vector; local depth-averaged transverse velocity;
t U u* Uk Umax Uo
u u' Vy
v
w' X Y yf ym
z zb
zw
vertical velocity fluctuation; channel coordinate in the streamwise direction; channel coordinate in the transverse direction depth of the approach flow in the floodplain; depth of the approach flow in the main channel; vertical distance measured from the initial bed level; bed elevation; water surface elevation.
Greek Symbols
h t x, y n
t
Smagorinsky constant; head drop across orifice plate; time interval between consecutive images; mesh element size in x and y direction, respectively (Eq. 4.12); coefficient in formula for cf.; Von Karman constant; mean value; kinematic eddy viscosity;
k b bx by max o xx, xy, yy
fluid density; standard deviation; sensitivity coefficients; bed shear stress; component of bed shear stress in the X direction; component of bed shear stress in the Y direction; maximum bed shear stress; bed shear stress in approach flow; shear stresses caused by turbulence;
1.
INTRODUCTION
1.1
Problem Statement and Motivation
A highway bridge spanning a waterway, typically has approach earthfill embankments leading to abutments that help support the bridge deck. The embankments and abutments shorten the necessary bridge span, but consequently contract the flow through the waterway and thereby increase the risk of abutment scour in the waterway. The safe design of bridge waterways is a long-standing engineering hydraulics problem that still poses several substantial design issues. A substantial set of issues concern the flow field at abutments. One issue, for example, concerns the magnitude of peak values of flow velocity, boundary shear stress, and unit discharge in the region where scour develops. Flow around an abutment is complex in nature, dominated by substantial flow contraction, and consisting of several recirculation zones and other vortical features interacting with the main flow. Though some of these features of abutment flow fields have been identified in laboratory tests and numerical simulations, there is a need to determine and quantify how abutment flow fields adjust in response to variations of abutment length, floodplain width and main channel dimensions. In particular, it is of interest to determine how such variations influence the peak values mentioned above. A better understanding of the overall flow behavior around bridge abutments is necessary to improve estimation of depth and location of maximum scour at abutments.
1.2
Scope and Objectives
This thesis uses a two-dimensional, depth-averaged flow model as well as a laboratory hydraulic model to obtain insights into the flow field around abutments situated on the floodplain of compound channels. By systematically varying selected geometric parameters, particularly abutment length, distinctive patterns and trends were identified in the spatial distribution of unit discharge, depth-averaged velocity and boundary shear stress around abutments. The findings provide useful insights as to how the flow field varies with abutment and channel geometries. As noted, of central importance is the amplification of flow velocity and boundary shear stress in the region of abutment scour. Moreover, the findings give guidelines regarding optimal use of depth-averaged models for simulating the flow around abutments. The main research objectives of the study address the following aspects of the flow around abutments: 1. The manner is when abutment length affects the flow distribution at a bridge waterway; 2. The influence of channel geometry on the flow field; and, 3. Distributions and information on unit discharge, depth-averaged velocity, and bed shear stress information needed for design considerations. Additional objectives of this study concern the evaluation of uncertainties associated with the use of a depth-averaged model, including the following considerations: 1. Identification of sources of uncertainty in depth-averaged numerical models of flow around hydraulic structures, such as abutments; 2. Quantification of uncertainty for each identified source of uncertainty; and, 3. Use uncertainty information to produce a guideline for the selection of an optimum mesh size to adequately and accurately simulate flows using depth-averaged flow models.
1
1.3
Methodology
As mentioned in Section 1.2, the study entailed numerical and laboratory flume models to examine the flow around an abutment in a compound channel. The numerical hydraulic model here employed is the Finite Element Surface Water Modeling System (FESWMS). FESWMS is a two-dimensional, depthaveraged, finite-element model developed for the Federal Highway Administration (FHWA) to simulate flows at bridge waterways, where complex hydraulic conditions limit the applicability of the traditional one-dimensional analysis. The flume experiments consisted of a series of measurements and observations using a fixed abutment placed on a non-erodible flat bed. For each experiment, abutment length, approach flow discharge, and water depth were held constant. Surface velocity data were obtained using Large Scale Particle Image Velocimetry (LSPIV) techniques that provided detailed instantaneous measurements for the entire flow field. Velocity data below the water surface were obtained by means of an Acoustic Doppler Velocimeter (ADV) placed in several locations at various water depths, obtaining as a result sufficient information to confirm the assumptions used in the depth-averaged model. At all the locations the time series of ADV measurements were recorded for at least three minutes or until stationary statistics were obtained. The experimental data were used to verify the accuracy of information obtained from FESWMS. Once calibrated, FESWMS was used to obtain information about variables not measured in the experiment, including bed shear stress, flow distribution, and flow structures between LSPIV data points.
1.4
Structure of Thesis
The background concepts related to flow around bridge abutments and scour are outlined in Section Two, which introduces important considerations such as abutment form, layout, how abutments are built, the scour processes, conditions for scour, and the flow field around the abutment. Section Three is a concise summary of prior studies reported in the literature on flow around bridge abutments and similar structures. This Section summarizes information about spill-through, wing-wall, and vertical-wall abutments, along with data from other abutment-like structures such as spur-dykes, groynes, and piers. Of particular interest in the review is information regarding the amplification of flow velocity and shear stress as flow passes around an abutment or similar flow obstruction. Also, a summary is given on previous studies of mesh size and discretization error, and flow distribution in compound channels. Section Four gives details regarding the development of the numerical model FESWMS, with special attention given to the selection of model parameters like Manning’s roughness coefficient and kinematic eddy viscosity. The use of the laboratory model is described in detail in Section Five, which includes information about the flume facility, flow calibration and setup, and surface water velocity measurements using LSPIV. Section Six is dedicated to the analysis of the uncertainties in the numerical results that are derived from the selection of model parameters and also from the mesh geometry. The uncertainty information is used in Section Seven to introduce the concept of the optimum mesh size for a depth-averaged numerical model. This concept is examined for flow around abutment. Prior studies do not explore this concept. A recommended guideline for selecting the mesh size based on important flow and geometric factors is given at the end of this Section.
2
Section Eight illustrates numerical results obtained in FESWMS for the cases of abutments on fixed beds before the development of a scour hole. Focus is given to values and spatial distribution of depth averaged velocity, unit discharge, and bed shear stress, as abutment length, channel, and floodplain dimensions vary. The main findings of the study are presented in Section Nine, which also indicates aspects of abutment flow fields in need of further research.
3
4
2.
BACKGROUND
2.1
Abutment Form, Layout, and Construction
Although the channel morphologies of most rivers may vary substantially from site to site, abutments have common characteristic features that can be used to define a suitably representative abutment form for estimating flow field at abutments set in a range of compound channel geometries. The common characteristic features of abutments are describable in terms of abutment form, general layout of approach embankment, and configuration of abutment construction. Each of these characteristics, combined with the channel geometry and the type of bed sediment, have great influence on the flow field around a bridge, and thereby also affect scour. 2.1.1
Abutment Form
There are three general forms of abutment: 1. Spill-through abutments (the most common form); 2. Wing-wall abutments; and, 3. Vertical-wall abutments. For spill-through abutments, the sides, as well as the face (or spill-slope), are sloped (typically at an angle flatter than the angle of repose of the material used in the earthfill); and the corners joining the sides and the face are usually rounded resembling a portion of a conical shape. Wing-wall abutments also have slopes on the sides of the approach embankment, but the abutment face is vertical and is flanked with wing-walls that retain the approach earthfill embankment. The angle between the face and the wing-wall is commonly 45°; although other angles also are used. Because the wing-wall meets abruptly with the face, they form a sharp corner, resulting in a flow less streamlined than the spill-through abutments. A vertical-wall abutment has vertical sides and a vertical face as well. The angle between the sides and the face is 90°, therefore this type of abutment is even less streamlined than the wing-wall abutment. As typical earthfill materials have an angle of repose much less than 90°, the entire embankment needs to be artificially retained (concrete walls, sheet piles, etc.). It is useful to note that a wing-wall abutment with wing-walls at a 90° angle to the face is a vertical-wall abutment. 2.1.2
Abutment Layout
The layout of a bridge abutment at a river crossing can be described in terms of the abutment’s length (L), the site’s floodplain width (Bf), and the half width of the channel (B). The following layouts are usual: 1. The abutment is located on the floodplain of a compound channel, such that L ≤ Bf. This layout is typical for spill-through abutments; 2. The abutment extends over the entire floodplain up to the main channel, such that L ≈ Bf. This layout is typical for wing-wall abutments in small streams; and, 3. The abutment is placed in a rectangular channel. This layout is not as common, and may be thought as a short abutment in a wide floodplain. 2.1.3
Abutment Dimensions and Construction
A typical bridge in the U.S. has a minimum of two 12 ft (3.66m) lanes, for a total road width of 24 ft (7.32m) plus two shoulders 8ft (2.44m) wide on each side giving a total top width of 40 ft (12.20m). The earthfill embankment has side slopes ranging from 2H:1V to 3H:1V, although the most common side slope is 2H:1V. 5
Abutments usually comprise a concrete support wall, or column, founded on a pile cap supported by piles or on a spread footing, and adjoin an earthfill approach embankment. Pile supports are more common than are footing supports, unless the abutment is founded directly on rock. Spill-through abutments are formed around a ―standard-stub abutment,‖ which comprises a concrete stub supported by a pile cap on two rows of circular piles. The design and dimensions of a standard-stub abutment commonly used are shown in Figure 2.1. Wing-wall abutments usually have similar foundation layouts as the standard-stub abutments, except that they include wing-walls extending from the central stub. Figure 2.2 shows the design and dimensions of a wing-wall abutment. The elevation of the pile cap and the detailed arrangement of piles may vary from bridge site to bridge site. At some sites, the pile cap is located at, or near, the top elevation of the floodplain, whereas at other sites the piles extend upward through the embankment earthfill. In this latter case, the piles directly support a cross beam, which in turn supports the beams of the bridge deck. Also, for some sites, wingwall abutments may be supported by sheet-piles driven in approximately the same plan layout as the abutment.
2.2
Flow Field
Flow through a bridge waterway contracted by a bridge abutment and its embankment is similar to flow around a short contraction, with the characteristic flow features illustrated in Figure 2.3. The flow width narrows and the flow accelerates through the contraction, generating macro-turbulence structures (eddies and various vortices spun from the contraction boundary) that shed, disperse, and decay within the flow. Flow contraction and turbulence at many bridge waterways, though, is further complicated by the shape and roughness of the channel in which the waterway is located. It is common for waterways to traverse a deeper main channel flanked by floodplains. Figure 2.4 Figure 2.4 depicts the flow field in the vicinity of a spill-through abutment located on the floodplain of a compound channel. Flow accelerates from the upstream approach to the most contracted section just downstream of the head of the abutment, followed by a deceleration of the flow. The flow field immediately downstream of the abutment comprises a flow separation region around which the streamwise flow gradually expands until becoming fully re-established across the channel. The upstream side of the abutment may develop a small eddy whose size depends on the length and alignment of the abutment. The curvature of the flow around the contraction can cause turbulence structures to form when the abutment foundation extends solidly into the floodplain or bed (i.e., like a caisson structure). Then, the flow may develop a localized spiral (vortex-like) motion which has a strong scouring action eroding a groove along its path. The vortex also generates a complex system of secondary vortices. Wong (1982), Tey (1984), Kwan (1988), and Kouchakzadeh (1996) provide additional information about the vortex system. Spill-through abutments, however, normally comprise an earthfill embankment placed upon the floodplain bed, and the vortex effect is diminished so as to be negligible (Ettema et al., 2009). A further complication for most bridge waterways is that they are erodible contractions. Flow may scour the boundary, possibly causing the contraction to fail and widen. Commonly, the bed of the main channel is much more erodible than the floodplain, because the bed is formed of loose sediment, while the floodplain is formed of more cohesive soil often protected by a vegetation cover.
6
2.3
Scour Processes
Though the present study does not directly address actual scour at abutments, it is useful to review the scour processes at abutments. Scour is the erosive action of the flow field entraining and carrying away sediment from the bed and banks of a stream. Two types of scour may occur at a bridge site: 1. General scour; and, 2. Abutment scour. These types are briefly described below. 2.3.1
General Scour
General scour, or general degradation, occurs even in the absence of hydraulic structures, and is not of prime interest for this study. General scour can be further divided in short-term scour, caused by floods, or long-term scour, related to geomorphic changes associated with imbalances of bed sediment supply, water flow, and channel slope. 2.3.2
Abutment Scour
Abutment form and layout in a channel develop a flow field essentially equivalent to flow through a short contraction in open channel flow. Consequently, the principal features of scour can be described as follow: 1. Abutment scour is closely influenced by flow distribution through the short contraction and by turbulence structures generated and dispersed by flow entering the short contraction; 2. For many, if not most, abutments, abutment presence contracts flow non-uniformly across a bridge waterway. However, in situations of short embankments, adjoining relatively wide channels, flow contraction scour decreases in accordance with two limits: a. If channel width is constant and embankment length decreases, scour depth at the abutment approaches zero; or, b. For a full abutment form of constant length in a channel of increasing width, scour depth at the abutment approaches a limiting value associated with scour around an abutment in a very wide channel. This scour depth may be estimated approximately in terms of local flow contraction around the abutment itself. This second limit can be difficult to simulate by means of hydraulic models replicating the full form and usual construction of actual spill-through and wing-wall abutments, because most laboratory flumes are insufficiently wide; 3. Provided that the approach embankment of an abutment does not breach, so that flow passes through it, abutment scour principally develops as a local amplification of contraction scour associated with flow through a long contraction; 4. Abutment scour typically entails hydraulic erosion followed by geotechnical failure of the mainchannel bank and earthfill embankment around the abutment column. Ettema et al. (2009) elaborate on abutment scour processes. 2.3.3
Clear-Water and Live-Bed Scour
In accordance with the conditions of bed material movement, the scour process is classified (e.g., ASCE, 2008) as: 1. Clear-water scour; or, 2. Live-bed scour. 7
Clear-water scour occurs when the velocity of the approach flow does not cause the bed shear stress to exceed the critical value for incipient motion of the sediment particles. In this condition, the streambed upstream the scour area remains fixed and the scour depth attains a maximum when the flow is no longer able to remove sediment from the scour area. Live-bed scour occurs when the velocity of the approach flow is such that the bed shear stress equals or exceeds the critical value for incipient motion of the sediment particles. There is continuous sediment transport from upstream into the scour hole and the scour depth fluctuates around a mean value due to the bed-form motion. The scour hole is generally deeper in a clear-water condition than in live-bed conditions. On the other hand, the scour hole develops more quickly under live-bed conditions than in clear-water conditions. 2.3.4
Scour Conditions
Several conditions of abutment scour develop in accordance with the flow field at an abutment, the physical characteristics of an abutment, and the waterway in which it is located. For spill-through abutments, three primary scour conditions develop in accordance with the locations of greatest erodibility of flow and least erosion resistance of the channel boundary, as outlined in Figure 2.5: 1. Scour Condition A. Scour of the main-channel bed, when the floodplain is less erodible than the bed of the main channel. Figure 2.5a illustrates this failure process, which involves scour leading to potential geotechnical failure of the main-channel bank and the embankment. Hydraulic scour of the main-channel bed causes the bank to become geotechnically unstable and collapse. The collapsing bank undercuts the abutment embankment, which in turn collapses locally. Soil, and possibly riprap, from the collapsed bank and embankment slide into the scour hole. 2. Scour Condition B. Scour of the floodplain around the abutment. This condition also is equivalent to scour at abutment placed in a rectangular channel, if the abutment is set back from the main channel. As the amount of bed-sediment transport on a floodplain usually is quite low, this scour condition usually occurs as clear-water scour. Figure 2.5b shows that the floodplain scours around the abutment, and especially slightly downstream of it. The scour hole locally destabilizes the embankment side slope, causing embankment soil, and possibly riprap, to slide into the scour hole. 3. Scour Condition C. Scour Conditions A and B may eventually cause the approach embankment to breach near the abutment, thereby fully exposing the abutment column. For this condition, scour at the exposed stub column essentially progresses as if the abutment column were a pier, as illustrated in Figure 2.5c. For the same reasons as given for Condition B, this scour condition usually occurs as clear-water scour. These scour conditions may occur for wing-wall abutments. However, a couple of additional erosion processes can result in failure of the main-channel bank and the approach embankment: 1. The local flow field generated at the corners of the abutment can cause local scour at those locations; and, 2. Exposure of the piles beneath the abutment pile cap can cause riverbanks and embankment soil to be eroded out from beneath the pile cap. A scour event (or series of events) at an abutment may involve a sequence of all three scour conditions. When an abutment is close to the main channel, Condition A may develop relatively quickly, with Condition B occurring at a slower rate. Either, or together, Scour Conditions A and B may eventually cause the approach embankment to undergo a slope-stability failure. If the embankment extensively washes out, so as to expose the abutment structure, scour may then develop at the abutment structure as if the abutment were a form of pier (Condition C). Accordingly, an important design consideration is that the stub or wing-wall abutment should not fail when exposed; i.e., the foundations of the wing-wall should be deep enough so that the wing-wall does not fail when exposed to a pier-like scour condition.
8
Figure 2.1 The geometry and dimensions of a standard-stub abutment commonly used for spill-through abutments (prototype scale indicated).
9
Figure 2.2 The geometry and dimensions of a wing-wall abutment. The compacted earthfill embankment extends back from the abutment structure (prototype scale indicated).
10
Figure 2.3 Flow through a short contraction.
Figure 2.4 Flow and scour around a bridge abutment and embankment in a compound channel.
11
(a)
(b)
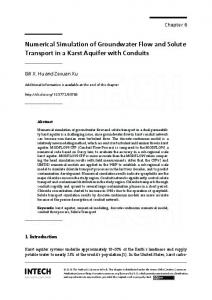
(c) Figure 2.5 Abutment-scour conditions: (a) Scour Condition A — hydraulic scour of the main-channel bed causes bank failure, which causes a failure of the face of the abutment embankment; (b) Scour Condition B — hydraulic scour of the floodplain causes failure of the face of the abutment embankment; (c) Scour Condition C — breaching of the approach embankment exposes the abutment column so that scour progresses as if the abutment column were a form of pier.
12
3.
LITERATURE REVIEW
3.1
Introduction
This Section is a concise review of the recent knowledge regarding the flow field around bridge abutments, and flow-field implications for the scour processes described in Section 2. A principal purpose of the review is to summarize the findings available in prior publications so as to delineate the necessary insights to be provided by this study. A particular focus of this review is to provide prior information on the amplification of flow velocity and boundary shear stress associated with the flow around an abutment, especially spill-through abutments. As a point of reference, it is useful to note that flow velocity around a circular cylinder in potential flow has an amplification factor of two (e.g., White, 2010). The review includes an evaluation of flow field data obtained from experiments with laboratory hydraulic models and numerical models. The flow structures described in Section 2, Section 2.2 are discussed in this Section. As abutments are geometrically similar to other structures in terms of shape as well as their effect in contracting flow at a channel reach, flows around spur-dykes, groynes, vanes, and cylindrical piers are also considered. These hydraulic structures extend out from the bank of the channel, narrowing it, in a similar manner as do abutments. Several observations from literature on abutment flow and scour are readily apparent: 1. Most laboratory studies on abutment scour do not provide detailed information characterizing the flow field (i.e., velocities, shear stress) in the scour region; 2. Only a few numerical studies on flow and scour around abutments have been done using threedimensional computational fluid dynamics models. Each investigated only one abutment geometry; 3. Numerous studies have examined the flow distribution in compound channels. However, they have focused mainly on meandering effects and sediment transport without addressing the influence of abutments; and, 4. Practically all numerical and laboratory studies were carried out using channels of rectangular cross section. Other than site-specific modeling of flow at an abutment in a compound channel, there has been no study that systematically examines the influence of abutment-site parameters on abutment flow field. One study, by Molinas and Hafez (2000), presents a limited amount of flow field data associated with an abutment of varying length in a rectangular channel of fixed width. An overall conclusion from these observations is that there is a need for the flow field information sought from the present study. There are practical benefits to using two-dimensional depth-averaged models, like FESWMS, to develop an overall parametric understanding of the flow field and scour around bridge abutments. Such models likely will continue to be extensively used for scour-depth estimation. Three-dimensional numerical models are typically complex in nature, entail long durations to run, and are expensive to utilize, and only a small number of users can apply them. Also, it is presently difficult to apply three-dimensional flow data for the purpose of scour depth estimation. The flow field data compiled in this Section are organized with regard to the overall cross-sectional shape of the channel where the abutment is located, namely rectangular channels and compound channels. Thereafter, the data are classified in accordance with abutment form (i.e., spill-through abutments and vertical-wall abutments), and consideration is briefly given to flow around piers.
13
Though evidently no study has dealt comprehensively with the flow distribution at abutments (of variable length) in compound channels, numerous previous studies have addressed the problem of flow distribution in channels of compound cross-section. Different methods were used (laboratory experiments, field surveys, and numerical modeling), to investigate flows in various channel configurations; e.g., Wormleaton and Hadjipanos (1985), Cesare (1991), Gogus and Al-Khatib (1995), Rameshwaran and Naden (2003), Patra et al. (2004), McEwan and Ikeda (2009), and Hu et al. (2010).
3.2
Abutments in Compound Channels
A preliminary search in the Compendex® database reveals a very limited number of published studies in the subject of flow around abutments located in the floodplain of a compound channel. Over the last three decades, less than two dozen articles or reports have been dedicated to understand this complex flow. This section briefly covers the state-of-the-art knowledge in this area, and ends with a summary of findings. 3.2.1
Laboratory Experiments
The extent of laboratory experiments on flow at abutments in compound channels is quite modest, and recently developed. Atayee (1993) performed laboratory experiments with abutments in floodplains of compound channels. However, these experiments were specifically aimed at obtaining a relationship for riprap protection around abutments; i.e., computing the minimum required diameter of riprap stone. Sturm and Janjua (1994) and later Melville (1995) investigated the flow and scour around abutments placed in the floodplain of a compound channel. In all cases the goal was to recommend a scour estimation equation based on a discharge contraction ratio, therefore, local maximum velocity or bed shear stress were not reported. Later, Kouchakzadeh and Townsend (1997), Richardson and Trivino (2002), Sturm (2006), Melville et al. (2006a), and Melville et al. (2006b) performed several experiments in compound channels using wingwall and spill-through abutments. Unfortunately, all these studies follow the trend of relating bulk flow variables to scour depth, and thus they were carried out with no intention of measuring local flow variables. An exception to the aforementioned trend is found in Yorozuya (2005), which comprises experiments with wing-wall and spill-through abutments in rectangular and compound channels. Although the main objective of his study was to develop a scour depth estimation method, considerable effort was spent collecting surface flow velocities in the entire area surrounding the abutment, which were later used to calibrate empirical parameters of the equation. 3.2.2
Numerical Studies
A very limited number of studies have numerically studied the flow in compound channels including the presence of bridge abutments. Bates et al. (1997) carried out a study using finite-element flow models in compound channel flow. Though the model included several man-made structures like spur dykes and bridge abutments, the study did not concern itself with the local flow around them. Biglari and Sturm (1998) performed a numerical simulation of the flow around a single configuration of vertical-wall abutment in a compound channel. They report a value of 1.60 for velocity amplification factor around the abutment; i.e., amplification of approach flow velocity.
14
3.2.3 Summary In summary, the laboratory and numerical experiments have yielded useful insights on scour development, but have not produced a comprehensive parametric examination of flow field variation with varying abutment and channel dimensions. The limited number of studies of flow around abutments in compound channels makes it necessary to look also at studies of abutments in rectangular channels and other abutment-like structures, such as spur dykes and groynes.
3.3
Vertical Wall Abutments in Rectangular Channels
3.3.1
Laboratory Experiments
Most early laboratory experiments examining flow and scour around bridge abutments concentrated on relating bulk flow variables to resulting maximum scour depths (Laursen, 1951; Schneible, 1954; Laursen, 1960; Laursen, 1963; Venkatadri et al., 1965; Herbich, 1967; Froehlich, 1989). The present review provides sample insights into typical studies, but does not aim to fully assess all studies on vertical wall abutments. An experimental study to describe the influence of the vortex system on the local scour process around vertical wall abutments was performed by Lim (1997). He determined that when contraction effects are negligible, the downflow associated with the vortex system was the dominating element in the scour mechanism, impinging and eroding sediment from the bed acting as a vertical jet. As shown by Ettema et al. (2009), flow contraction effects, however, are normally a major feature of flow around abutments in river channels. An experimental study with a somewhat different focus on flow around short vertical wall abutments of different lengths was done by Molinas et al. (1998). Their study was mainly concerned with shear stress measurements, and gave no attention to other flow variables such as velocity or unit discharge. It was found that the maximum shear stress varies with the abutment length relative to channel width; in other words, the greater the contraction of flow, the greater the shear stress on the bed around the wall. The measurements they obtained revealed that the maximum shear stress could be as much as ten times the shear stress in the approach flow. Oliveto and Hager (2002) also studied experimentally the flow around vertical wall abutments in rectangular channels. In their study, the approach velocity, abutment length, and water depth were varied so as to create a wide range of flow conditions. The shape and size of the scour hole is directly related to the high spatial complexity of elements comprising the vortex system, namely, the horseshoe vortex along the base, the surface vortex due to stagnation flow, the tornado vortices along the sides, and, in the case of piers, the rear vortices induced by the von Karman vortex street. Acoustic Doppler Velocimeter (ADV) velocity measurements around a vertical wall abutment placed on a rectangular channel were taken by Barbhuiya and Dey (2004) and also by Duan (2009). Both studies presented velocity measurements at various cross sections, making a uniform grid. Bed shear stress was derived from velocity fluctuations near the bed. Table 3.1 compares and summarizes the experimental conditions and results of their experiments.
15
Table 3.1 Comparison of two studies with vertical wall abutments in rectangular channels Barbhuiya and Dey (2004) Duan (2009) Flow depth, H (m)
0.200
0.215
Channel width, 2B (m)
0.900
0.600
Approach velocity, Uo (m/s)
0.294
0.225
Abutment length, L (m)
0.120
0.200
Umax/Uo
1.6
2.3
τmax/τo
3.3
3.0
Weitbrecht et al. (2008) performed experiments in a groyne field. Groynes of various lengths were replicated using vertical flat plates. The modeled groynes were similar to narrow vertical wall abutments. These experiments are focused on mass exchange between groyne field compartments, and therefore the concentration distribution of tracer material takes a central place in the author’s discussion. Rather surprisingly, little detail is given about the flow field, even though velocity distribution plays an important role in advective mass transport. Only qualitative information is given on flow around a pair of groynes. Flow velocity data pertains only to an overall contraction of flow through the channel with the groyne field. 3.3.2
Numerical Studies
One of the first numerical simulations of flow around an abutment-like structure was presented by Tingsanchali and Maheswaran (1990), who performed a 2-D depth-averaged computation of the flow field around a short groyne in a rectangular channel. Their study concluded that, when groyne length (L) relative to channel width (Bf) is L/Bf = 0.16, the maximum depth-averaged velocity increases to 1.55 times the velocity of the approach flow; similar to the finding by Barbhuiya and Dey (2004). Correspondingly, Tingsanchali and Maheswaran (1990) evaluated the maximum shear stress to be 4.9 times the average value in the approach flow upstream of the groyne. A later study by Ouillon and Dartus (1997) provides useful insights derived from a 3-D numerical simulation of flow in a rectangular channel fitted with a short groyne for which L/Bf = 0.10. Their study usefully depicts how the local velocity and bed shear stress increase in the vicinity of flow contraction around a groyne. The velocity is magnified by 16% while the bed shear stress doubled. Their study also addresses the relative error between the simulation and the experiment used in the validation. The maximum relative error in velocity is estimated to be 12%. Further, their study points out the significant errors that can be obtained in 3-D simulations if a rigid (typically flat) lid is used to simulate the water surface. When it comes to the flow field, there are significant differences between using the actual (nonhorizontal) water surface and a flat lid. Some flow variables may differ by as much as 30% for the flow conditions they modeled. Molinas and Hafez (2000) performed a 2-D numerical investigation of the flow surrounding vertical wall abutments and groynes located in rectangular channels. Here the flow field was not obtained from solving the depth-averaged equations of motion, but instead was computed using the Navier-Stokes equations reduced to two-dimensions, analyzing flow at a plane passing through the location of average velocity. The study involved abutments of various lengths in a channel of prescribed single width, and was validated through experimental measurements. It was found that the amplification of the maximum value of depth-averaged velocity with respect to the approach velocity varies significantly with abutment length
16
(L/Bf). For the shortest abutment (L/Bf = 0.08) the amplification was 1.05, while for the longest abutment (L/Bf = 1.3) it was 1.50, which suggests a boundary shear stress amplification of about 2.25. More recently, Chrisohoides et al. (2003) and Koken and Constantinescu (2008) developed and experimentally validated three-dimensional flow models to analyze the flow field around vertical wall abutments of short length placed in rectangular channels. Both studies provide insightful depictions of the turbulence quantities in the flow, notably, velocity and pressure fluctuations, instantaneous vorticity, and turbulence kinetic energy. Neither study, however, attempts to estimate expressly the mean maximum velocities or boundary shear stress associated with flow around the abutments. Although not explicitly stated, the amplification of maximum boundary shear stress over the shear stress in the approach flow may be inferred from the reported data. The amplification factor can be estimated to be 11.6 using data from Chrisohoides et al. (2003), and 7.8 using data from Koken and Constantinescu (2008). These values are higher than those reported by earlier studies. The difference could be attributed to the finer detail of flow and turbulence structures simulated in the 3-D CFD models.
3.4
Wing-Wall Abutments in Rectangular Channels
Wing-wall abutments are more bluff than spill-through abutments, and therefore may possibly produce different amplification values. Ahmed and Rajaratnam (2000) measured velocities and bed shear stress at several locations adjacent to a hydraulic model of a wing-wall abutment placed in a rectangular channel. The abutment model employed in this study was short compared with the channel width (L/Bf = 0.08). They found that the maximum velocity had an amplification factor of 1.10 compared with the velocity of the approach flow. The magnitude of the bed shear stress increased to 3.63 times the value in the approach flow. Teruzzi et al. (2009) performed a 3-D numerical simulation of the flow around a wing-wall abutment in a flat rectangular channel. The protrusion ratio for the abutment was L/Bf = 0.20 corresponding to a short abutment in a wide channel. Special attention was given to the bed shear stress and its relation to scour. The study reports that the maximum bed shear stress is 13 times greater than the corresponding value in the uniform approach region. The difference in the bed shear stress amplification reported by both studies is attributable to several possible factors, including the values of L/Bf used. Further work is needed to provide a systematic explanation of bed shear stress amplification.
3.5
Cylindrical Piers in Rectangular Channels
3.5.1
Laboratory Experiments
As flow contracts as it passes around bluff bodies like cylindrical circular piers, it is useful to look at the literature on flow around piers. A representative sample of studies is summarized here. During the last few decades a myriad of studies have investigated the flow and local pier scour using a flume experiments (Kothyari et al. 1992, Sheppard et al. 2004, M. Moncada et al. 2007, Raikar and Dey 2009, and Lee and Sturm 2009). Although a wide range of flow velocities and water depths were tested, commonly no details are given regarding maximum velocity or bed shear stress in the vicinity of the pier. In the vast majority of those studies, the objective was to develop scour prediction equations based upon bulk flow variables. Therefore, no emphasis was placed on reporting local flow conditions in the immediate vicinity of the structure.
17
Sarker (1998), however, performed experiments using ADV to measure local velocities around a circular pier on a scoured bed in a rectangular channel. In spite of that, this paper is limited to reporting velocities along the pier symmetry line in the streamwise direction, only partially depicting the flow field. Along the symmetry line there is a stagnation region in front of the pier and a wake region behind it. The maximum velocity around the pier does not occur in neither of those regions. Others, like Barbhuiya and Dey (2004), using a half pier placed on one side of the channel, and Unger and Hager (2007), using a full pier at midway of the channel width, paid great attention to some local flow features around cylindrical piers, especially the horseshoe vortex and the downflow. Unfortunately, these studies give little or no detail about velocity or bed shear stress magnification caused by the presence of the pier. Only a handful of experimental studies cover the subject of maximum local velocity and bed shear stress around a pier. Among them, Johnson and Ting (2003) and Sadeque et al. (2008), using different approach velocities, water depths, and pier diameters, determined that the maximum velocity occurs at a distance of one-half diameter away from the streamwise symmetry line and one half diameter downstream from the spanwise symmetry line. They also reported that the maximum velocity near the cylinder amplified the approach flow velocity by a factor of 2.5, while the maximum bed shear stress was 5.5 times that of the approach flow. 3.5.2
Numerical Studies
In recent years, an increasing number of studies have used 3-D numerical models to examine flow at piers in rectangular channels. The use of these models enables them to reveal flow features in more channels. These models often involve millions of computational cells, and therefore are demanding on computer power and time. As a result, the number of pier geometries evaluated in each study has always been limited to one. Table 3.2 summarizes the relevant findings. These studies analyzed only cases with simple geometries of isolated cylindrical piers located in a wide rectangular channel. Due to the complex nature of the flow and the great deal of attention given to turbulence quantities, these studies only reported explicitly either a value of velocity or boundary shear stress amplification. However, from the velocity amplification given in Ge et al. (2005) a value of 1.4 can be estimated for bed shear stress amplification. Table 3.2 Summary of numerical studies on flow at cylindrical piers Author Number of cells D/(2B) Salaheldin et al. (2004) Ge et al. (2005) Zhao and Huhe (2006) Kirkil et al. (2008)
Umax/Uo
τmax/τo
Unknown
0.12
Not Given
3.0
1.0×10⁶
0.07
1.18
Not Given
1.4×10
6
0.08
Not Given
5.5
4.0×10
6
0.06
Not Given
11.5
In Table 3.2, the ratio of pier diameter (D) to channel width (2B, B is the half channel width) is analogous to the ratio of abutment length (L) to floodplain width (Bf). The degree of waterway obstruction used in studies of pier flow is always small and their results can only be compared with those of very small abutments in wide floodplains, where L/Bf < 0.15.
18
3.6
Studies about Mesh Size and Error in Numerical Flow Simulations
A series of numerical experiments were performed to investigate the effect of several parameters on the accuracy of depth-averaged simulation results. The main goal of these experiments was to determine and recommend an optimum mesh size to use in two-dimensional depth-averaged models. Numerous studies using such models have been carried out for a variety of purposes from simple flow computation to environmental management. However, their validation has relied on scarce sets of field and laboratory measurements. Furthermore, the great level of complexity inherent to natural environments makes it difficult to draw single recommendations regarding an optimum mesh size. Most numerical studies have only focused on estimating the error due to model parameters like mesh size. Even when a grid sensitivity analysis or a mesh convergence study is performed, the principal outcome is typically the average estimated error, which then is regarded as an indicator of the model’s predictive efficiency. The literature on the use of depth-averaged flow models like FESWMS contains no previous study addressing simulation time as a variable to obtain an optimum mesh size. The flow around a groyne field was studied by Tingsanchali and Maheswaran (1990) using a 2-D numerical model 4m long and 0.9m wide, resembling the scale of a laboratory flume experiment. Their study addresses the importance of having a high density grid to achieve better accuracy. Numerical results compared with laboratory measurements indicate an average percentage error in the measured velocity of only 6%. Subsequently, Bates and Anderson (1996) used a depth-averaged model to analyze its sensitivity to changes in parameters such as bed topography, boundary conditions, etc. Their study, focused on an 11km-long reach of the Culm River, located in Devon, UK, shows quantitatively that decreasing mesh density (i.e., increasing nodal spacing) has a detrimental effect on simulation accuracy. Results from the numerical simulation were compared with field measurements of depth-averaged velocity and revealed average error band in the estimated velocity of ±10%. Pasternack et al. (2006) also reports on the simulation errors attained by the use of a low-density grid. After comparing the simulation results with field depth-averaged velocity measurements, the average error in velocity prediction was estimated at 29%. Since only differences between predicted and measured values are reported, this study does not include any specific parametric recommendation for improving the accuracy of model predictions. An early argument for the existence of an optimum mesh size for 2-D depth-averaged simulations was made by Hardy et al. (1999). After evaluating several mesh sizes, Hardy et al. propose that there is a certain mesh size beyond which further refinement does not significantly improve simulation accuracy. However, no attempt was made to recommend a guideline for appropriate mesh sizing. Recently, Hobbs (2005) performed a mesh sensitivity analysis for 2-D modeling of flow in a steep gradient stream. Hobbs (2005) recommended the use of a cell-based Peclet number for estimating the optimum mesh size for a depth-averaged simulation. His recommended range is
10 Pe
U x
t
30
19
Eq. (3.1)
where Pe is Peclet number, U is average velocity, Δx is mesh size, and t is kinematic eddy viscosity. However, the optimization proposed by Hobbs (2005) aims only at attaining a stable model, no consideration is given to discretization errors from using this recommendation, and no mention is made about minimizing computer run time. Analysis conducted as part of the present study (see Section 7) evaluates the use of the cell-based Peclet number to estimate an optimum mesh size.
20
4.
TWO-DIMENSIONAL NUMERICAL MODEL
4.1
Description of FESWMS
The Finite-Element Surface Water Modeling System (FESWMS) is a computer program originally developed for the Federal Highway Administration (FHWA) to model two-dimensional, depth-averaged flows at bridge waterways, where complex hydraulic conditions limit the applicability of the traditional one-dimensional analysis of flow through bridge waterways. Froehlich (2002) describes the considerations leading to the development of FESWMS. The program is capable of simulating steady as well as unsteady water flows in rivers confluences, river bends, around abutments, piers, estuaries, and coastal waters. FESWMS is currently used by DOT (Department of Transportation) engineers and their consultants in numerous states across the United States. It is useful here to outline briefly the numerical basis of FESWMS, as Section 6 discusses uncertainties incurred when using the method. In general terms, the finite-element method is a numerical technique used to solve differential equations commonly found in many fields of engineering. The modeled area is subdivided into smaller triangular or quadrilateral elements with nodes along their boundaries forming a mesh. The continuous quantities defined in the governing equations are approximated by discrete variables at each node; this process is called discretization. The Galerkin (weighted residuals) method is used to solve the system of governing differential equations at each node (Froehlich 2002), using the following procedure: 1. Approximations of the variables in each element are substituted in the governing equations; 2. The equations are usually not fully satisfied by these approximations, such that residual quantities form; 3. The residuals are multiplied by weighting functions and then integrated over the solution domain; 4. The summation of the weighted residuals is forced to equal zero; 5. The equations for all the local elements are assembled to form a complete global system of algebraic equations; 6. The global system of algebraic equations is solved using Gaussian elimination so as to obtain solutions at each node; and, 7. The solutions between nodes are then approximated using interpolation functions that are similar to the weighting functions. To improve the stability of the numerical solution, the code FESWMS uses mixed interpolation, which means the interpolation functions are not of the same degree for all the variables. For instance, water surface elevations are interpolated linearly using only the nodes on the vertices of the element. In contrast, unit flow rates are interpolated using quadratic functions based on the solution for all the nodes in the element.
4.2
Governing Equations
Under the assumptions of incompressible flow, negligible vertical acceleration, insignificant thermal effects, and hydrostatic conditions, the full Navier-Stokes system of equations reduces to three equations: 1. Continuity equation; 2. x-momentum equation; and, 3. y-momentum equation.
21
Here, the x and y directions are streamwise and spanwise, respectively. Typically these equations are written in terms of the depth-averaged velocities and pressure as unknowns Ferziger and Peric (2001). In FESWMS, the unit flow rates take the place of the depth-averaged velocities and the water depth replaces the pressure in the governing equations. The following two sub-sections explain in detail each term in the equations. 4.2.1
The Continuity Equation
The depth-averaged continuity equation in FESWMS is
zw qx q y qm t x y
Eq. (4.1)
where: zw is water surface elevation; t is time; q x is unit discharge in the streamwise direction (x-direction);
q y is unit discharge in the transverse direction (y-direction); and, qm is net inflow or outflow per unit area. 4.2.2
The Momentum Equations
The momentum equations along the x and y directions, in weak conservation form, are qx t
2 qx
x H
gH 2
zb 1 ( H xx ) ( H xy ) gH x bx x y 0
Eq. (4.2)
( H yx ) ( H yy ) zb 1 by 0 gH 2 y x y
Eq. (4.3)
qx q y 2 y H
and, q y t
qx q y
2 qx
x H y H
gH 2
where:
q x is unit discharge in the streamwise direction (x-direction); q y is unit discharge in the transverse direction (y-direction); t is time; zb is river bed elevation;
H is water depth at a node; g is acceleration of gravity;
is density of water; bx is bed shear stress in the x direction; by is bed shear stresses in the y direction; and,
22
xx , xy , yx , and yy are shear stresses caused by turbulence. The bed shear stresses are defined as 1 2
zb 2 zb 2 qx qx2 q y2 bx c f 1 H2 x y
Eq. (4.4)
and, 1 2
z 2 z 2 q y qx2 q y2 by c f 1 b b H2 x y
Eq. (4.5)
where:
c f gn2n2 H
13
is friction coefficient;
n is Manning’s roughness coefficient; and, n is dimensional coefficient equal to 1.0 in SI units and 1.486 in US units. The magnitude of the bed shear stress, b , is then the resultant vector of the two components
b bx 2 by 2
Eq. (4.6)
The turbulent shear stresses are calculated using Boussinesq’s eddy viscosity hypothesis assuming that the stresses are proportional to velocity gradients;
u u x x
xx t
u v y x
xy yx t
v v y y
yy t
Eq. (4.7)
Eq. (4.8)
Eq. (4.9)
where:
u qx / H is depth-averaged velocity in the streamwise direction; v q y / H is depth averaged velocities in the transverse direction; and,
t is kinematic turbulent eddy viscosity which is assumed to be isotropic. The procedures for selecting values of Manning’s roughness coefficient and the kinematic eddy viscosity are discussed in more detail in section 4.3.
23
4.3
Model Development
The comprehensive nature of this study made it impossible to use a single model to evaluate the range of abutment lengths being investigated. FESWMS models had to be built for each abutment length and floodplain width considered. Nevertheless, it is possible to characterize the main features that define the geometry of the model and boundary conditions applied to it. Models were developed for two channel types, namely rectangular channels (simulating a very wide floodplain) and compound channels, which comprise a main channel flanked by floodplains. All the models were run in steady state mode for the case of a flat (not deformed) bed before scour occurs. Furthermore, each individual model had specific requirements regarding abutment form (spill-through) and layout (length). The boundary conditions were selected taking into consideration the channel type and the conditions for sediment movement in the channel. The process of developing one numerical model can be described in terms of the following set of tasks: 1. Definition of channel geometry; 2. Definition of boundary conditions; 3. Selection of abutment form and layout; 4. Selection of model parameters, o Manning’s roughness; o Kinematic eddy viscosity; and, 5. Selection of mesh type and size. The same series of tasks was repeated to build each of the numerical models used in this study. 4.3.1
Channel Geometry
Although only two different basic channel geometries were used in this study (rectangular channel and compound channel) and for all geometries, the area of main modeling interest is limited to only a few meters upstream and downstream of the abutment, the overall length of the channel simulated varied with abutment length. Due to specific needs of each geometry, the extent of such region could range from 5m to 15m in the streamwise direction. In the spanwise direction, the area of interest comprised the entire channel width, which in due course could range from 4m to 16m. Figure 4.1 displays a sample of the different channel geometries. The size of the complete numerical model was extended even further so that the upstream and downstream boundaries would not interact with the solution in the area of interest. Having the boundaries in close proximity to regions with high velocity gradients may cause numerical instabilities, leading to large errors in the solution or, ultimately, divergence. Froehlich (2002) recommends extending the boundaries farther away from the areas where an accurate solution is needed. Detailed information about the dimensions used in each model is given in Table 4.1. The location of the upstream boundary was selected so that uniform flow conditions were established upon entering the area of interest. The downstream reach needed to be sufficiently long in order to ensure that the wake formed downstream of the abutment is fully contained within the limits of the numerical model, thereby avoiding possible instabilities due to reversed flow across the downstream boundary.
24
Table 4.1 Channel dimensions used in the numerical models Width Area of Interest Channel Type (m) (m)
Length (m)
Rectangular
16.0
Total = 15.0 U/S = 7.5 D/S = 7.5
Total = 45.0 U/S = 17.0 D/S = 28.0
Compound Channel Bf/B=0.30
Total = 4.0 Main Channel = 2.8 Floodplain = 1.2
Total = 5.0 U/S = 2.2 D/S = 2.8
Total = 30.0 U/S = 12.0 D/S = 18.0
Compound Channel Bf/B=0.50
Total = 4.0 Main Channel = 2.0 Floodplain = 2.0
Total = 5.0 U/S = 2.2 D/S = 2.8
Total = 30.0 U/S = 12.0 D/S = 18.0
Compound Channel Bf/B=0.70
Total = 4.0 Main Channel = 1.4 Floodplain = 2.6
Total = 5.0 U/S = 2.2 D/S = 2.8
Total = 30.0 U/S = 12.0 D/S = 18.0
Compound Total = 4.0 Total = 5.0 Total = 30.0 Channel Main Channel = 0.52 U/S = 2.2 U/S = 12.0 Bf/B=0.90 Floodplain = 3.48 D/S = 2.8 D/S = 18.0 Note: U/S and D/S refer to upstream and downstream of the abutment centerline, respectively 4.3.2
Boundary Conditions
Two types of boundary conditions are used in the numerical models: specified discharge and specified water-surface elevation. In accordance with the subcritical flow conditions prevailing in the models, the specified discharge was assigned to the upstream boundary and the water-surface elevation was assigned to the downstream boundary. The absolute values to be used in each model depend on the overall channel geometry. Table 4.2 gives a summary of the boundary conditions applied in the different models. The discharge selected in the rectangular channel is associated with clear-water scour, while the discharge in the compound channel is intended to produce active sediment transport (live-bed scour) in the main channel and clear-water conditions in the floodplain. The water-surface elevation at the downstream boundary was selected so that the water surface in the area of interest approximates the water surface profile reported in Yorozuya (2005).
25
Table 4.2 Channel dimensions used in the numerical models U/S Boundary, D/S Boundary Channel Type Q (m3/s) WS El. (m) Rectangular
0.80
0.105
Compound Channel Bf/B=0.30
0.30
0.290
Compound Channel Bf/B=0.50
0.30
0.290
Compound Channel Bf/B=0.70
0.30
0.290
Compound Channel Bf/B=0.90
0.30
0.290
4.3.3
Abutment Form and Layout
Abutment models initially were created in two different forms: spill-through and vertical-wall. However, it was decided to focus on spill-through abutments, because the main flow responses to waterway geometry could be obtained with this common abutment form. Also, laboratory experiments by Yorozuya (2005) show no significant difference in scour depth for the two abutment forms. As explained in Section 2, Section 2.1, the layout of a bridge abutment may be defined in terms of the abutment length (L), the floodplain width (Bf), and the half channel width (B). The majority of the cases have the abutment sited either on the floodplain of a compound channel (L < Bf < B) or on a rectangular channel so as to simulate a short abutment placed on a wide floodplain (L Bf). Table 4.3 summarizes the range of values used in the numerical experiments. Table 4.3 Channel dimensions used in the numerical models Abutment Length Floodplain Width Channel Type L (m) Bf (m)
Channel Width B (m)
Rectangular (flat bed)
0.80 – 9.60
16.00
16.00
Compound Channel Bf/B = 0.30
0.42 – 1.08
1.20
4.00
Compound Channel Bf/B = 0.50
0.30 – 1.80
2.00
4.00
Compound Channel Bf/B = 0.70
0.44 – 2.90
2.60
4.00
Compound Channel Bf/B = 0.90
0.52 – 2.09
3.48
4.00
26
4.3.4
Model Parameters
Integral to the conceptual formulation of FESWMS are two important parameters that affect the outcome of the model: Manning’s roughness coefficient, n, and kinematic eddy viscosity, . Although those parameters are not explicitly mentioned in the governing equations, they quickly come into the picture as fundamental parts of the shear stress terms in the momentum equations. (Hobbs 2005) performed a sensitivity analysis of depth-averaged models with regard to n, and . He determined that model results t
t
are very sensitive to changes in those parameters. Therefore, n and should be estimated accurately. t
4.3.4.1 Manning’s Roughness Coefficient Methods for determining Manning’s roughness are well established in the literature (e.g., Chow 1959, Chang 1988, Rice et al. 1998) and tested successfully in field and laboratory applications. Two material types are defined in the model: sand and riprap rock. The Strickler formula (Equation 4.10) relating bed roughness and Manning’s roughness coefficient was used to compute n for the sand bed where d 50 is used in meters. When the mean diameter d 50 = 0.50x10⁻³m, n = 0.013; i.e., from,
n 0.0474 d50
1/ 6
Eq. (4.10)
A further equation, Equation 4.11, proposed by Anderson et al. (1970) is valid for stone size up to 0.3m (1.0ft) and channel slopes less than 0.01, and was applied to calculate n for the riprap apron where d50 is now used in feet.
n 0.0395 d50
1/ 6
Eq. (4.11)
When the mean diameter d 50 = 0.010m (0.033ft), n = 0.025. 4.3.4.2 Kinematic Eddy Viscosity In contrast with Manning’s roughness coefficient, the available approaches to estimate t have much larger uncertainty, and thus are a significant consideration in constructing the numerical model. Three different methods were evaluated for determining t : Smagorinsky (1963), Fischer (1979), and Sukhodolov et al. (1998). The first two methods are included in the FESWMS computational code. Equation 4.12 proposed by Fischer (1979) relates t to the shear velocity ( u* ) and the flow depth (H), both quantities can be computed locally at every node that allows having a different eddy viscosity value suited to the specific flow condition at each location. Fischer’s formula, however, is only accurate within a factor of 3;
t 0.6 0.3 u* H
Eq. (4.12)
The formula developed by Smagorinsky (1963), given in Equation 4.13, has all the advantages of the Fischer’s formula and has additional improvements. Eddy viscosity is also computed locally for each node based upon velocity gradients and the turbulence length scale (i.e., mesh element size). 27
2
u v 1 u v t xy x y 2 y x 2
2
Eq. (4.13)
In spite of these advantages, the Smagorinsky formula has substantial drawbacks: 1. The Smagorinsky constant is not well defined, Wilcox (1993) places between 0.1 and 0.24; John (2003) states that lies in a range between 0.01 and 0.1. Therefore, t could vary in a factor of 10 or more; 2. One single is not able to represent most flows. The use of advanced techniques is required for dynamic adjustment of the Smagorinsky constant; and, 3. According to Wilcox (1993) and John (2003), this method introduces too much diffusion ( t ) into the flow in order to stabilize numerical computations. Equation 4.14, found in Sukhodolov et al. (1998), is also an improvement from Fischer’s formula since it not only allows for spatial variability of t but also describes the vertical behavior of t at each location; i.e.,
t u* z 1
z H
Eq. (4.14)
where = 0.41 (Von Karman constant), and z is the vertical distance from the channel bed. For a logarithmic velocity profile, the average velocity is located at approximately at 0.4H above the bottom, which gives t 0.0984u* H 0.10u* H . This result gives values of eddy viscosity up to 9 times lower than those suggested by Fischer’s formula. ADV velocity measurements from Kirkil (2004) and Yorozuya (2005), were processed to compute t from the velocity fluctuations, using the following equation:
t
u ' w ' du / dz
Eq. (4.15)
where u ' and w ' are the horizontal streamwise and vertical velocity fluctuations, respectively. These ADV measurements cover a variety of flow conditions from zones where velocity gradients are small (approach channel) to areas with large velocity gradients such as the wake of a pier. The results from this analysis are displayed in Figure 4.2. The scatter observed in Figure 4.2 is partially attributed to the relatively short length of the time series (approximately 1500 values) and its subsequent lack of stationarity. However, based on the results from Figure 4.2, it was determined that the formula proposed by Sukhodolov et al. (1998) was applicable to the conditions in this study. The applicability of Eq. (4.14) is verified in Section 8, using additional ADV measurements collected in the flume described in Section 5. The FESWMS model additionally requires the use of a base eddy viscosity defining a positive non-zero lower limit; this minimum eddy viscosity was defined as 0.001m2/s. Table 4.4 gives a summary of the material properties adopted for the numerical model.
28
Table 4.4 Manning’s roughness coefficient and kinematic eddy viscosity assigned to the boundary materials used in the numerical model Material Type n t
4.3.5
Sand
0.013
0.001 0.10u* H
Riprap Rock
0.025
0.001 0.10u* H
Mesh Type and Size
Structured and unstructured meshes were used in preliminary runs before selecting the final grid design to be used in the simulations. Structured grids lead to a regular matrix of equations that can be solved faster than those obtained for unstructured grids. However, various studies (e.g., Ferziger and Peric 2001) state that unstructured grids are best adapted to finite element methods because of their flexibility to fit any shape and because there is no limit in the number of neighbor elements or nodes. The mesh type and size of the mesh elements selected in this study represent the best compromise between accuracy of the solution and computational time. Small size elements produce large matrices, which in turn lead to very slow convergence and long running times. Typically, the use of smaller elements is preferred in order to improve the accuracy of the numerical solution; however, it is important to mention that size alone is not sufficient to ensure a successful run with an adequate convergence level. The shape of the element is also vital for this effect; small, but thin and elongated elements, may cause numerical instabilities and, consequently, errors in the results or divergence. One way to satisfy both the time and accuracy requirements is by means of a hybrid mesh. A structured mesh with larger elements is used outside the area of interest where flow is more uniform and not much detail is needed; and an unstructured mesh with smaller elements of adequate shape is used inside the area of interest where more detail is needed to capture the highly non-uniform flow behavior. Figure 4.3 shows a typical mesh used in this study. The actual mesh size used in the models was selected following the recommendations determined from the analysis described in Section 7, Section 7.6.
29
Figure 4.1
Schematic showing the two channel types used in the numerical model.In the picture, the abutment form is spill-through, and the abutment is sited on the floodplain (L ≤ Bf).
30
1.0 Eqn Sukhodolov Y - U/S K - U/S K - wake
0.8
0.6
z/H 0.4
0.2
0.0 0.00
0.02
0.04
0.06
0.08
0.10
0.12
0.14
0.16
t /(u* H)
Figure 4.2 Eddy viscosity computed from the equation proposed by Sukhodolov et al. (1998) compared with flume ADV data. In the legend, Y = Yorozuya (2005) and K = Kirkil (2004).
31
(a)
(b)
Figure 4.3 Views of a hybrid mesh used in the models: (a) plan view; (b) enlarged isometric view of the area of interest.
32
5.
LABORATORY HYDRAULIC MODEL AND EXPERIMENTS
5.1
Introduction
A series of laboratory experiments were carried out using a hydraulic model of bridge abutments to illuminate and quantify the influence of abutment length on the complex flow field around a model spillthrough abutment, and to provide data with which to validate the results obtained from the numerical model FESWMS. Large-Scale Particle Image Velocimetry (LSPIV) was used to visualize and measure the flow field around an abutment. The velocity distribution at the free surface was obtained using LSPIV, leading to estimates of depth-averaged velocity, unit discharge, and bed shear stress. Also, acoustic Doppler velocimetry (ADV) measurements were taken at various locations in the flow field approaching and around the model abutment. These ADV measurements additionally served to obtain information on flow distribution over the fluid column, and then verify the accuracy of the LSPIV results. Taken together, the information obtained from the laboratory hydraulic model provided necessary insights to augment the numerical model insights as to the flow-field characteristics at an abutment.
5.2
Experimental Setup 5.2.1
Test Facility
The experiment setup was located in the Water Resources Laboratory at the University of Wyoming. The flume, shown in Figure 5.1, is an open channel with a compound cross section. The channel dimensions are 3.66m (12 ft) in width, fitted with a 2.44m (8 ft) wide floodplain, 18.29m (60 ft) in length and 1.22m (4 ft) in maximum depth. The floodplain bed is elevated 0.15m (0.5 ft) above the flume bottom, which is also the main channel bed. The beginning of the test area is located 7.32m (24 ft) downstream of the flume’s inlet and extends over 4.88m (16 ft) long. The slope in the flume is 0% (horizontal bottom). The layout of the flume is shown in Figure 5.2. The cross-section and isometric view are displayed in Figure 5.3 and Figure 5.4. The flume comprised the following zones along its length: 1. The first 1.00m (3.3 ft) contains a diffuser pipe that delivers water coming from the pump. Enclosing this area is a flow straightener formed by uniformly spaced vertical elements and a 2mm screen. The purpose of the flow straightener is twofold: (a) to dissipate some of the kinetic energy of the water as it comes out of the diffuser pipe, and (b) to distribute the flow across the flume’s entrance. 2. After the flow straightener, there is a 1.22m (4 ft) long area containing an arrangement of brick blocks carefully placed in a staggered pattern to facilitate the development of fully turbulent flow through the flume. 3. A 5.09m (16.7 ft) approach flow section further causes the flow to become hydraulically fully developed upon entering the test area. 4. A 4.88m (16 ft) test area with a structure, a spill-through abutment, is fixed to one side of the channel. 5. The test area is separated from the outlet by a 4.88m (16 ft) long section terminated with a sharp crested weir, the height of which can be adjusted manually in order to control the water surface elevation in the test area. The weir also prevents reflecting waves and pump-originated vorticity from propagating upstream of the weir into the test area. 33
6. A final 1.22m (4 ft) zone that collects and conveys the flow to the pump intake pipe. The flow was provided by means of a pump controlled by a variable-frequency drive operated to produce the desired discharge with a regular velocity distribution of the flow upon entering the test area. The maximum discharge attainable with the pump is 0.208m3/s (7.35 ft3/s or 3,300 gal/min). 5.2.2
Abutment Model
The abutment model was constructed of wood and sheet-metal, covered with a layer of epoxy paint; it was held in position by internal weighting and vertical struts. The abutment’s location in the flume is shown in Figure 5.2 and its form and main dimensions are shown in Figure 5.5. The main dimensions of the abutment are as follows: 1. Top width: 0.40m; 2. Bottom width: 1.20m; 3. Height: 0.20m; and, 4. Length: varying from 0.60m to 2.44m. The top width of the abutment represented a 1:30 length scale of a two-lane road (12m, or two 12 ft lanes plus 8 ft shoulders). The abutment’s lengths were chosen in order to achieve specific degrees of floodplain coverage and flow contraction in the vicinity of the abutment.
5.3
Flow Setup
The flow is measured by means of a 0.20m (8 in) diameter orifice plate meter located in the pipe 12m (40 ft) downstream of the pump. The relationship between volumetric discharge and head drop across the orifice was obtained through calibration using weighing tanks located in the laboratory. Two weighing tanks with a capacity of 9.5m3 each were alternately filled and emptied as the flow passed through the orifice plate and the pressure drop was measured. The tanks were filled and then drained by means of pneumatically activated butterfly valves 0.25m (10 in) in diameter. The pressure drop across the orifice plate was measured using a SETRA® Differential Pressure Transducer Model 230 with a range of 5 psi and intervals of 0.01 psi. The weight was measured using HBM U1T load cells. All the pressure and weight measurements were recorded using a LabView® control system. The result of the orifice calibration is displayed in Figure 5.6. The discharge-head drop relationship for the 8-in-diameter flow meter follows the equation
Q 0.1109 h
Eq. (5.1)
where, Q is the discharge in m3/s and, Δh is the head drop in m. For this study, the approach flow depth in the main channel was established at 0.30m with an average velocity U = 0.29m/s. As noted earlier, the blocks on the approach to the test section were arranged so as to trip the flow boundary layer, and thereby create a fully turbulent velocity profile for the flow approaching the abutment. The ADV velocity profiles were found to conform to the general profile associated with flow in a fully developed turbulent boundary layer.
34
5.4
Surface Velocity Measurements
The Large-Scale Particle Image Velocimetry (LSPIV) technique was used to visualize and measure the free surface flow field around the abutment. LSPIV measurements entail the following steps: 1. Setup benchmarks or reference points; 2. Setup illumination; 3. Seeding; 4. Recording; 5. Image processing and transformation; 6. Grid definition; and, 7. Velocity calculation and filtering; The usual full process is described by several prior studies, notably Fujita et al. (1998) and Muste et al. (2004a). 5.4.1
Benchmarks
Six benchmark posts were located in the flume such that the top of each post would coincide with the water surface when positioned on the flume bed. These benchmark posts were positioned in a rectangle that would encompass the entire flow-field in the areas of interest, which included area both upstream and downstream of the abutment. Care was exercised to align these benchmarks in a precise fashion, as indicated by Figure 5.7, because small misalignments could translate into large velocity errors. 5.4.2
Illumination
To illuminate the flow-filled area of interest, eight halogen lights (500-1000 watts) were positioned above the water surface on the sides of the flume. A great deal of effort went into careful positioning of the lights to achieve an optimum lighting effect, reducing bright spots and glare seen by the camera while ensuring that enough light reached every part of the investigation area. Other problems with lighting effects were meticulously isolated and eliminated over the course of these experiments. 5.4.3
Seeding
Two types of seeding material were used for the tests: white foam (corn starch) pellets shaped like cylinders, approximately 30mm long and 10mm in diameter, and soap bubbles, about 15mm in diameter, on average. Seeding material was placed first in the recirculation zone of the flume, and then a steady amount of seeding was spread well upstream of the abutment, and a recording was made as this seeding material traveled through our area of interest. Figure 5.8(a) illustrates the seeding process during one of the tests. 5.4.4
Recording
Image recording was performed using a Sony® digital HD video camera recorder model HDR-HC9 HDV1080i fitted with a polarized filter in order to sharpen the image and diminish the effect of glare. Due to the space limitations of the flume and overall test facility, the camera could not be positioned in an ideal location directly overhead looking down at a right angle. Instead, the camera had to be placed downstream of the abutment and some image transformations needed to be performed during the LSPIV process. With the benchmarks posts in place, the camera was placed and aligned in such a manner as to encompass all of these benchmark posts, and then the camera position was locked in place for the remainder of the test. 35
When the benchmarks posts had been recorded in their proper places and removed from the flume, the pump was turned on to generate the desired flow. After the model had run for enough time to allow the flow features to stabilize (at least 1 hour), the free surface LSPIV was recorded. 5.4.5
Image Processing and Transformation
Using Adobe® Premiere Pro CS3, the appropriate segment of film, including the shots of our benchmark areas, was downloaded onto a computer. The film segment was then digitized into hundreds of separate images at a rate of 30 frames per second of film. Then, using an image of the benchmark condition, processed in the Matlab Large Scale Image Velocimetry software (Mat_LSPIV®), it was possible to magnify, rotate, convert to grayscale and perform a complete transformation on the selected images from the inclined view to an orthogonal view of the flume. 5.4.6
Grid Definition
The software package for Mat_LSPIV enabled the super-positioning of a grid over the photos so as to search for familiar patterns of seeding particles in the interrogation area from one image to the next. This searching feature was controlled by changing the size of the interrogation area and search area, based upon expectations of the average fluid velocity throughout the test section. Depending on the inputted searching parameters, this software can yield different results for the same set of images, but by optimizing these parameters, the correlations and the confidence in the velocities determined in each of the individual grid points can be increased. 5.4.7 Velocity Calculation and Filtering Having defined the grid, interrogation radius, and searching area, the Mat_LSPIV software starts an iterative search looking for similar seeding patterns between two consecutive photos. When the pattern identified in the first image is found in the second image, the displacement can be estimated. Knowing the time interval between frames, the velocity was then computed. This operation was repeated for each pair of consecutive images, and the average velocity values for each grid point was determined after filtering. Two types of filters were applied: a high-pass filter for the correlation and a band-pass filter for the velocities. The correlation high-pass filter was used to discard from the average calculation points with low correlation and thus, greater uncertainty. The velocity band-pass filter was used to disregard unrealistic velocity estimations; i.e., computed velocity is too high, too low, or contrary to the observed direction of the flow at the point. The final outcome of this process is a time-averaged set of surface velocity vectors. Figure 5.8(b) displays these velocity vectors around the abutment. 5.4.8
Summary of LSPIV Parameters
Summarized below are the parameters used in the LSPIV process: Ground reference points: 6 Transformation Parameterization Xmin: 91.5 Xmax: 98.5 Ymin: 97.6 Ymax: 101.3 Resolution: 0.005 PIV Parameters Interrogation Area: 32 pixels × 32 pixels 36
Sim: 16 pixels (distance from the center to the top of the searching area) Sip: 16 pixels (distance from the center to the bottom of the searching area) Sjm: 16 pixels (distance from the center to the right of the searching area) Sjp: 16 pixels (distance from the center to the left of the searching area) Minimum Correlation: 0.6 Grid Area Steps in streamwise direction: 24 Steps in spanwise direction: 16 The foregoing values are useful as reference for future work using the flume and the LSPIV procedures.
5.5
ADV Velocity Measurements
A series of ADV measurements were taken at different elevations on vertical lines at several locations. These measurements were aimed both at verifying that the flow was fully developed upon entering the test area, and relatedly at obtaining values of kinematic eddy viscosity. A downward looking ADV, manufactured by SonTek®, was used to measure the instantaneous velocity components in three dimensions at a rate of 25Hz. The measurement volume is located 100mm below the tip of the probe; therefore, velocity measurements at less than 100mm below the free surface were not possible. The velocity components were recorded for at least three minutes to ensure the averages are statistically stationary; i.e., the averages are independent of sampling time. The measured data were filtered by minimum correlation first and then using a spike removal algorithm called ―phase-space threshold despiking‖ built in the WinADV® post-processing software.
5.6
Uncertainty Assessment
An uncertainty assessment was undertaken following the guidelines given in the American Institute of Aeronautics and Astronautics standard (AIAA 1995). Gui et al. (2001) and Muste et al. (2004b) extensively discuss the application of this uncertainty assessment standard. The analysis was performed using images already transformed from the inclined view to the orthogonal view (directly above the flow field), but as such it does not address the effect of distortion due to image transformation. In consequence, the overall uncertainty may be slightly higher than the computed. For a surface two-dimensional LSPIV measurement, the average velocity at each grid point is computed as follows (Gui et al., 2001):
u
Lobj , x Limg , x t
Sx
Eq. (5.2)
Sy
Eq. (5.3)
and,
v
Lobj , y Limg , y t
37
where Lobj is the width of the camera view in the object plane and in the direction of the velocity component, Limg is the width of the digital image in the direction of the velocity component, S is the component of the average particle displacement in the x or y direction, and t is the time interval between images. The bias limit for the two velocity components is computed using:
B2 L2obj BL2obj L2img BL2img 2t B2t S2 BS2
Eq. (5.4)
where Bk and k ( k Lobj , Limg , t , S ) are, respectively, the bias limit and sensitivity coefficient of the variable in the corresponding direction. Table 5.1 summarizes the constants and bias limits used in the uncertainty assessment of LSPIV laboratory measurements. Table 5.1 Constants used in the uncertainty computations Bias Limits Direction
Limg (pixels)
Lobj (m)
t (s)
BLobj
BLimg
Bt
BS
(m)
(pixels)
(s)
(pixels)
X
609.3
620
0.033
0.1
1
0.001
0.001
Y
274.3
280
0.033
0.1
1
0.001
0.001
The sensitivity coefficients for the streamwise (and similarly for the transverse with the corresponding change in variables) direction are defined as
L
obj , x
L
img , x
u 1 Sx Lobj , x Limg , x t
Lobj , x 1 u Limg , x t L2img , x
t
S x
Eq. (5.5)
Eq. (5.6)
Lobj , x 1 u Sx t Limg , x t 2
Eq. (5.7)
Lobj , x u S x Limg , x t
Eq. (5.8)
S x
38
The component of the particle displacement varies with location; therefore, the uncertainty is also a function of location. Table 5.3 and Table 5.4 present sample calculations of uncertainty at various locations. However, this does not preclude the calculation and further use of a representative average uncertainty for the area of principal interest. The precision limit for the average value of a sample of size N is
P
t N
Eq. (5.9)
where t is the confidence coefficient (equaling 2 for a 95% confidence interval in a large sample) and is the standard deviation of the sample of N images. The uncertainty of the LSPIV measurements is
U k B2 P2
Eq. (5.10)
The results for average and maximum uncertainty of the streamwise and transverse velocity components are given in Table 5.4. Table 5.2 Results of uncertainty assessment Streamwise Velocity
Transverse Velocity
u
v
Average Uncertainty (%)
3.79
5.58
Maximum Uncertainty (%)
18.99
19.83
The uncertainties in Table 5.2 are typical for LSPIV work. These values are comparable to those reported in Fujita et al. (1998), Gui et al. (2001), and Muste et al. (2004b).
39
Table 5.3 Sample computation for uncertainty assessment of the streamwise velocity component Location (cm)
Velocity (cm/s)
Disp. (cm)
Sensitivity Coefficients
L
L
Bias Lim
t
S
-0.08725
-1624.48
0.083600
-0.08216
1.449
0.070183
33.283
1.132
45.0126
1.531
Uncertainty
Bu
Uu
U u (%)
29.51177
0.186953
0.263604
0.489
-1529.65
29.51177
0.17632
0.248612
0.490
-0.06897
-1284.16
29.51177
0.148889
0.209934
0.493
0.054829
-0.05388
-1003.22
29.51177
0.117766
0.166051
0.499
0.074155
-0.07288
-1356.83
29.51177
0.156993
0.221359
0.492
X
Y
u
Sx
0.473
2.900
53.8906
1.833
0.088782
0.626
2.900
50.7573
1.726
0.778
2.900
42.6096
0.930
2.900
1.082
2.900
obj , x
img
,x
x
Note: This estimate does not account for the effect of distortion after image transformation.
40
Table 5.4 Sample computation for uncertainty assessment of the transverse velocity component Location (cm)
Velocity (cm/s)
Disp. (cm)
Sensitivity Coefficients
L
L
Bias Lim
t
S
-0.02280
-191.707
0.015444
-0.01513
0.125
0.013406
1.9725
0.067
1.0235
0.035
X
Y
v
Sy
0.473
2.900
6.3884
0.217
0.023273
0.626
2.900
4.2272
0.144
0.778
2.900
3.6632
0.930
2.900
1.082
2.900
Uncertainty
Bv
Uv
U v (%)
29.4187
0.041931
0.059123
0.925
-127.216
29.4187
0.035477
0.050022
1.183
-0.01313
-110.431
29.4187
0.034084
0.048058
1.312
0.007186
-0.00704
-59.1908
29.4187
0.030831
0.043472
2.204
0.003754
-0.00368
-30.9206
29.4187
0.029811
0.042033
4.107
obj , y
img
,y
Note: This estimate does not account for the effect of distortion after image transformation.
41
y
Figure 5.1 The water-sediment recirculating flume facility used for the experiments.
42
Figure 5.2 Laboratory flume layout.
43
Figure 5.3 Cross sectional view of the flume.
44
Figure 5.4 Isometric view of the flume.
45
Figure 5.5 The abutment model. (Note: abutment length varies).
Figure 5.6 Head drop and discharge relationship for 0.20m-diameter orifice flow meter.
46
Figure 5.7 Camera view showing the location of the benchmarks posts for LSPIV measurements. The posts are located at the indicated points.
47
(a)
(b)
Figure 5.8 Flow visualization around the abutment; (a) original camera image showing seeding process; (b) velocity vectors obtained after LSPIV processing.
48
6.
UNCERTAINTY ASSESSMENT
6.1
Introduction
This Section addresses the uncertainty in the outcome of numerical simulations in depth-averaged flow models like FESWMS. The effects of possible error sources like grid size and iterative parameters are quantified using methods well documented in the literature (e.g., Stern et al. 2006). The purpose of this Section is two-fold: 1. To obtain data for use in the estimation of an optimum mesh size discussed in Section Seven; and, 2. To provide data needed to validate the numerical model (see Section Eight). In engineering and science, there is a consensus regarding the formal meaning of uncertainty. The American Institute of Aeronautics and Astronautics (AIAA 1998), an organization that has spent substantial effort defining standards for estimating uncertainty in numerical flow simulations, defines uncertainty as ―a potential deficiency in any phase or activity of the modeling process that is due to the lack of knowledge.‖ Some of these deficiencies are attributable to assumptions made during the model development; i.e., steady state and two-dimensional flow. Such assumptions approximate reality in a simplified manner neglecting other phenomena believed to be of lesser importance. The analysis presented in this Section is concerned with the uncertainty assessment of the following parameters used in the depth-averaged hydraulic model: 1. Mesh size; 2. Convergence limit; and, 3. Relaxation factor.
6.2
Methodology
The procedure adopted here is explained in more detail in Stern et al. (2006). It was originally developed for use in Computational Fluid Dynamics applications related to ship hydrodynamics, but it has been utilized extensively for several other fluid flow situations; e.g., pipe flow, flow around spheres, flows with free surfaces, etc. The method described in Stern et al. (2006) provides the following advantages: 1. Incorporates in its formulation knowledge from numerical simulations, analytical solutions, and experimental results; 2. Introduces the concept of a correction factor to the numerical approximate solutions based on analytical benchmarks; and, 3. Every step throughout the process is firmly grounded on a well-defined mathematical background. During the present uncertainty assessment, only one parameter was varied while the others were kept constant. For instance, when the effect of mesh size is studied, the relaxation factor and convergence limit are held constant while the mesh size is the only changing parameter. The overall procedure can be summarized in the following steps: 1. Select the variable to be used in the uncertainty assessment, e.g., water depth, velocity, and unit discharge; 2. Select a refinement ratio rk . The refinement ratio is the quotient of the largest value of the studied parameter and the intermediate value of the same parameter. It is also the quotient of the intermediate value of the parameter and the smallest value of the same parameter. For example, if 49
the parameter is mesh size and rk =2, then, if the coarse mesh has elements of 0.40m, the medium mesh has elements of 0.20m, and the fine mesh has elements of 0.10m; 3. Select values of the output variable at a given location for the coarse, medium, and fine parameter; 4. Read S k 1 , S k 2 , and S k 3 from the FESWMS simulation results. They are the values of the selected output variable for the smallest, medium, and largest parameter, respectively; 5. Compute the change between medium and fine parameter k 21 Sk 2 Sk1 , and the change between coarse and medium parameter k 32 Sk 3 Sk 2 ; 6. Compute the convergence ratio Rk k 21 / k 32 and determine the type of convergence or if there is divergence as a. If 0 Rk 1 there is monotonic convergence b.
If 1 Rk 0 there is oscillatory convergence
c.
If Rk 1 there is divergence
7. In cases with monotonic convergence, a. Compute the following:
pk
Ck
ln k 32 / k 21
rkpk 1 rkpkest 1
* RE k1
Eq. (6.1)
ln rk
Eq. (6.2)
k 21
Eq. (6.3)
rkpk 1
where, pkest is the estimate for the limiting order of accuracy of the numerical model. It is
pk Ck * RE
k1
b.
established by the approximations used in the model; here pkest 1 for first order approximation; is the calculated order of accuracy based on the solution obtained from the numerical simulation; is the correction factor that accounts for the effect of higher order terms, thus improving the first term error estimate; and, is the first term estimate for error based on the generalized Richardson extrapolation.
Calculate the uncertainty, U k , of the fine parameter:
9.6 1 C 2 1.1 * k REk 1 Uk * 2 1 Ck 1 RE k1
1 Ck 0.125 1 Ck 0.125
50
Eq. (6.4)
8. In cases with oscillatory convergence, compute the uncertainty using
U k 0.5 Smax Smin
Eq. (6.5)
where, Smax is the a maximum simulation result, taken from S k1 , S k 2 , and S k 3 ; and,
Smin is the minimum simulation result, taken from S k1 , S k 2 , and S k 3 9. For both cases, monotonic and oscillatory convergence, the uncertainty can be expressed in relative terms as a percentage using
U k (%)
6.3
Uk 100 Sk1
Eq. (6.6)
Uncertainty Due To Mesh Size
An assessment is conducted to estimate the uncertainty resulting from the selection of mesh element size. The mesh size is an important factor to determine the number of elements in the numerical model, which has an effect not only on the accuracy of the solution but also on the computer running time needed to complete the simulation. The mesh size may also affect the stability and convergence of the solution. Large elements may not capture accurately the channel bed geometry, and the shape of hydraulic structures may be deformed in the model. Important existing bed features may be smoothed out or removed completely, while other dunes and nick points may be artificially created due to improper element size. Also, essential flow information may be lost in areas of high velocity gradients. Very small elements can induce numerical instabilities causing the simulation to crash and fail. Also, even if the model is stable, very small elements may prevent the system from achieving the desired convergence level due to elements alternating between wet and dry conditions. The assessment of uncertainty due to mesh size is carried out in two parts: one for qualitative, and other for quantitative analysis. By combining these two approaches it is possible to obtain a better description of the effect of mesh size on the uncertainty of simulation results. 6.3.1
Qualitative Analysis
Before going into the numerical estimation of the uncertainty attributed to mesh size, it is useful to analyze the results in a qualitative manner in order to identify circumstances that otherwise would not be recognized. Erroneous flow patterns, irregularities in the solution, and discrepancies in the magnitude and location of maximum values are among the events that can be easily seen in a qualitative analysis. Results of the numerical simulation for the compound channel with different mesh sizes are shown in Figure 6.1. In this case, the ratio of floodplain width to channel half width, Bf/B, is 0.70 and the ratio of abutment length to floodplain width, L/Bf, is 0.30. It is observed that the effect of having a coarse mesh is more noticeable in the vicinity of the abutment, especially in the wake region downstream. Little or no effect is visible in the compound channel where the unit discharge estimation is consistent for all the mesh sizes studied.
51
In Figure 6.1(a), where the mesh size is 40cm (same as the road deck width), the following effects can be observed: 1. The abutment shape is distorted; 2. The location of the wet/dry boundary around the abutment is incorrect; 3. Irregular flow distribution upstream of the abutment; 4. The flow does not separate at the abutment face; 5. There is no recirculation downstream of the abutment; 6. There is a low velocity region downstream of the abutment where the flow should be accelerating due to the contraction; and, 7. The streamlines show an undulating pattern, which is not expected for a flat bed. When the mesh size is decreased to 20cm or half the road deck width, as shown in Figure 6.1(b), the abutment shape is improved, giving a slightly better approximation for the location of the wet/dry boundary. The flow irregularities upstream of the abutment persist, though they are reduced. There is flow separation at the abutment face, and consequently a recirculation zone is formed downstream of the abutment. The low velocity region is still present in the area of flow contraction. However, its extent is considerably reduced. The oscillations in the streamlines become smaller and are limited to a modest area near the abutment. Figure 6.1(c) displays the unit discharge distribution obtained with a mesh size of 10cm or one-fourth the road deck width. With this mesh size all the erroneous features in Figure 6.2(a) and (b) completely disappear. The abutment shape is well represented, the wet/dry boundary is accurately approximated, the flow distribution is smooth upstream of the abutment, the wake downstream is well formed, there are no slow velocity pockets within the contracted flow area, and there are no strange oscillations in the streamlines. The solution obtained with the finest mesh is depicted in Figure 6.1(d) where the element size is 5cm. No significant difference is evident between the results with the 10cm mesh and the 5cm mesh. At this point, a quantitative analysis is needed to complete the uncertainty assessment for grid size. The qualitative analysis was performed also on a rectangular channel simulating the case of a very wide floodplain. The results obtained for a rectangular channel are essentially similar to those obtained in a compound channel. The only difference occurs at the interface from floodplain to main channel; that feature simply does not exist in the rectangular channel model. 6.3.2
Quantitative Analysis
This quantitative analysis addresses key points differentiating results that, at first glance, appear essentially similar. The discretization error distribution, convergence type and average uncertainty are topics discussed in this section. The contours of discretization error distribution in the area of interest for a compound channel with a spill-through abutment with ratio of length to floodplain width of 0.3 (L/Bf = 0.3), are displayed in Figure 6.2. Figure 6.2(a) and (b) illustrate the errors in unit discharge obtained using a 10cm mesh and a 5cm mesh, respectively. The highest discretization errors are concentrated in two zones: 1. In the areas surrounding the abutment; and, 2. In the interface between the floodplain and the main channel. It is observed in Figure 6.2Figure 6.2(a) that the contracted flow area directly in front of the abutment displays discretization errors in unit discharge in the order of 1.0E-2m2/s (1.0×10⁻²m2/s) for the 10cm mesh. As shown in Figure 6.2(b), with the 5cm mesh the discretization error in the same region is reduced 52
one order of magnitude to about 1.0E-3m2/s, although a small zone near the downstream corner of the abutment still shows errors in the order of 1E-2m2/s. Figure 6.2(c) and (d) present the discretization error in water surface elevation with meshes of 10cm and 5cm in size. Once again the zones with large discretization errors are mostly found near the abutment. The discretization error in the computed water surface elevation is one order of magnitude lower than that obtained when computing the unit discharge. It is seen in Figure 6.2(c) that, when the mesh size is 10cm, the discretization error in water surface elevation directly in front of the abutment is 1E-3m. In Figure 6.2(d), with 5cm elements, the discretization error in water surface elevation immediately in front of the abutment is 1E-4m. Table 6.1 Sample calculation for mesh uncertainty assessment under conditions of oscillatory convergence ELEMENT SIZE (m) Location X(m)
Uk
Fine
Medium
Coarse
Sk1
Sk 2
Sk 3
0.10m
0.20m
0.40m
3.33
0.154710
0.158570
0.154342
-0.9129
2.11
1.366
3.46
0.154918
0.158746
0.153645
-0.7505
2.55
1.646
3.58
0.155057
0.158897
0.152948
-0.6454
2.97
1.918
3.71
0.155153
0.159018
0.152251
-0.5711
3.38
2.181
3.84
0.155203
0.159109
0.151534
-0.5155
3.79
2.440
3.97
0.155247
0.159118
0.150810
-0.4660
4.15
2.676
4.10
0.155262
0.159118
0.150086
-0.4269
4.52
2.909
4.23
0.155196
0.159108
0.149343
-0.4006
4.88
3.146
4.35
0.155112
0.159073
0.148580
-0.3774
5.25
3.382
4.48
0.155007
0.158980
0.147817
-0.3558
5.58
3.601
4.61
0.154885
0.158829
0.147066
-0.3353
5.88
3.797
4.74
0.154703
0.158674
0.146350
-0.3222
6.16
3.983
4.87
0.154558
0.158498
0.145635
-0.3062
6.43
4.161
5.00
0.154331
0.158303
0.144919
-0.2967
6.69
4.336
Rk
3
(10 )
Uk (%)
The uncertainty calculations described in Table 6.1 and Table 6.2 were performed over the entire area of interest in the compound channel and the rectangular channel. The output variables selected for the analysis are the unit discharge and the water surface elevation. Results are essentially similar for the compound and rectangular channels. The average absolute uncertainty for unit discharge is 0.0072m2/s when using the 10cm mesh and 0.0023m2/s when using the 5cm mesh. These uncertainty values in relative terms translate to 4.70% for the 10cm mesh and 2.57% for the 5cm mesh. For the water surface elevation, the average absolute uncertainty is 0.0014m with the 10cm mesh and 0.0003m with the 5cm mesh. The average uncertainty in relative terms is 0.45% for the 10cm mesh and 0.10% for the 5cm mesh.
53
Table 6.2 Sample calculation for mesh uncertainty assessment under conditions of monotonic convergence ELEMENT SIZE (m) Location X(m)
Fine
Medium
Coarse
Sk1
Sk 2
Sk 3
0.05m
0.10m
0.20m
4.36
0.154110
0.154668
0.158505
4.49
0.153947
0.154521
4.62
0.153822
4.74
k 21
k 32
Rk
pk
1 Ck
0.000558 0.003837
0.1454
2.7814
4.875
0.158387
0.000574 0.003865
0.1485
2.7511
0.154384
0.158292
0.000561 0.003908
0.1435
0.153625
0.154230
0.158097
0.000604 0.003867
4.87
0.153370
0.154046
0.157849
5.00
0.153209
0.153814
0.00
0.142046
0.13
* RE
Uk
U k (%)
9.50E
0.00102
0.663
4.732
1.00E
0.00105
0.681
2.7999
4.964
9.41E
0.00103
0.669
0.1564
2.6763
4.392
1.12E
0.00110
0.715
0.000675 0.003803
0.1775
2.4940
3.633
1.46E
0.00120
0.785
0.157600
0.000604 0.003786
0.1597
2.6458
4.258
1.15E
0.00109
0.715
0.142319
0.143461
0.000273 0.001141
0.2395
2.0616
2.174
8.61E
0.00046
0.324
0.142366
0.142690
0.143940
0.000323 0.001250
0.2585
1.9517
1.868
1.13E
0.00053
0.375
0.26
0.142766
0.143029
0.144434
0.000263 0.001404
0.1874
2.4156
3.335
6.07E
0.00047
0.326
0.38
0.143062
0.143447
0.144966
0.000385 0.001519
0.2534
1.9803
1.945
1.31E
0.00064
0.447
0.51
0.143485
0.143889
0.145546
0.000403 0.001657
0.2437
2.0366
2.102
1.30E
0.00068
0.472
0.64
0.143956
0.144343
0.146104
0.000386 0.001761
0.2195
2.1871
2.554
1.09E
0.00066
0.462
0.77
0.144319
0.144796
0.146592
0.000476 0.001795
0.2654
1.9132
1.766
1.72E
0.00078
0.541
0.90
0.144815
0.145249
0.147264
0.000433 0.002015
0.2153
2.2152
2.643
1.19E
0.00075
0.517
1.03
0.145306
0.145793
0.147921
0.000486 0.002128
0.2287
2.1284
2.372
1.44E
0.00083
0.571
54
k1
6.4
Uncertainty Due To Convergence Limit
An assessment is conducted to estimate the uncertainty resulting from the selection of the convergence limit. The convergence limit is the maximum allowable difference between results of successive iterations, and it is an important factor to determine the stop time of a numerical simulation. Having convergence limits at very low values may prevent the system from achieving the desired convergence; e.g., if the model contains elements that continuously alternate between wet and dry modes the convergence limit may not be reached. Larger convergence limits may lead to the accumulation of truncation errors during the iterative process. The present evaluation entailed several runs using different convergence limits ranging from 0.0001 up to 0.0016. The mesh size is 10cm, and the relaxation factor is taken as 0.1. Figure 6.3 shows the contours of unit discharge in the area of interest for a compound channel with a spill-though abutment with a ratio of length to floodplain width of 0.3, L/Bf = 0.3 and ratio of floodplain width to half channel width of 0.7, Bf/B = 0.7. The analysis was also performed in a rectangular channel obtaining basically the same results as in the compound channel. The absolute effect of convergence limit is not visible from the unit discharge contours and the streamlines. The overall flow pattern is well depicted and only minor variations can be observed in the vicinity of the abutment. The contours of discretization error distribution in the area of interest are displayed in Figure 6.4. Figure 6.4(a) and (b) illustrate the discretization errors in unit discharge obtained using convergence limits of 0.0008 and 0.0001, respectively. It is observed in Figure 6.4(a) that the contracted flow area directly in front of the abutment displays discretization errors in unit discharge of 1E-4m2/s when the convergence limit is 0.0008. As shown in Figure 6.4(b), with the convergence limit at 0.0001, the error in the same region is reduced by two orders of magnitude to 1E-6m2/s. Figure 6.4(c) and (d) present the discretization error in water surface elevation with convergence limits of 0.0008 and 0.0001. The largest discretization errors are located in the vicinity of the abutment. It is seen in Figure 6.4(c) that when the convergence limit is 0.0008 the error in water surface elevation directly in front of the abutment is 1E-4m. In Figure 6.4(d), with the convergence limit at 0.0001, the error in water surface elevation immediately in front of the abutment is 1E-6m. It is noted that the overall effect of a greater convergence limit, which reduces the simulation running time, is not only accumulated but also compounded throughout the iterative process. Therefore, an increase of one order of magnitude in the convergence limit may result in a dramatic increase of the discretization error by two or three orders of magnitude. However, given the absolute values of discretization error presented in this section, the effect of convergence limit can be neglected in this study.
6.5
Uncertainty Due To Relaxation Factor
An assessment is conducted to estimate the uncertainty resulting from the selection of the relaxation factor. The relaxation factor is a conditioning technique intended to either: 1. Increase stability of a numerical simulation using relaxation factors of less than 1.0. This is called under-relaxation; or, 2. Increase the convergence speed of a numerical simulation using relaxation factors greater than 1.0. This is called over-relaxation.
55
The relaxation factor accomplishes its purpose by adjusting the diagonal dominance of the matrix, and by controlling the magnitude of the change between successive iteration steps. The 2-D depth-averaged hydraulic model FESWMS uses only under-relaxation, therefore the following discussion refers purely to relaxation factors of less than unity. The use of small relaxation factors produces a stable system by conditioning the matrix so as to increase its diagonal dominance. On the other hand, since the relaxation factor is small, so are the changes between successive iteration steps, thus increasing the time needed to reach the desired convergence. Larger relaxation factors typically mean shorter running times needed to achieve convergence. However, large relaxation factors also mean a matrix with lower stability by decreasing the diagonal dominance. In such cases, the advantage of faster convergence can be quickly erased by numerical instabilities that may cause the model to crash. Also, larger relaxation factors may produce undesirable oscillations in the iteration process by increasing the magnitude of the change between successive steps. Such oscillations, even in a stable model, may prevent the model from converging successfully. The present assessment entailed several runs using different relaxation factors ranging from 0.1 up to 0.8. The mesh size is 10cm, and the convergence limit is taken as 0.0001. Figure 6.5 shows the contours of unit discharge in the area of interest for a compound channel with a spill-though abutment with a ratio of length to floodplain width of 0.3, L/Bf = 0.3 and a ratio of floodplain width to half channel width of 0.7, Bf/B = 0.7. The assessment was also carried out in a rectangular channel getting mainly the same results as in the compound channel. The effect of the relaxation factor is not evident from the unit discharge contours and the streamlines. The overall flow pattern, at first glance, is well depicted and only very minor variations are observed in the vicinity of the abutment. The contours of discretization error distribution in the area of interest are displayed in Figure 6.6. Figure 6.6(a) and (b) illustrate the discretization errors in unit discharge obtained using relaxation factors of 0.4 and 0.1, respectively. The areas surrounding the abutment contain the largest discretization errors. It is observed in Figure 6.6(a) that the contracted flow area directly in front of the abutment displays discretization errors in unit discharge of 1E-5m2/s when the relaxation factor is 0.4. As shown in Figure 6.6(b), with the relaxation factor at 0.1, the discretization error in the same region did not significantly change and remained around 1E-5m2/s. Figure 6.6(c) and (d) present the discretzation error in water surface elevation with relaxation factors of 0.4 and 0.1. It is seen in Figure 6.6(c) that, when the convergence limit is 0.4, the discretization error in water surface elevation directly in front of the abutment is 1E-5m. In Figure 6.6(d), with the relaxation factor at 0.1, the error in water surface elevation immediately in front of the abutment did not change significantly and remained around 1E-5m. The discretization error due to relaxation factor is much smaller than that due to the mesh size and about the same order of magnitudes as the convergence limit. So long as the model is stable and capable of reaching convergence, the relaxation has very little effect on uncertainty.
56
6.6
Summary
The average uncertainty for unit discharge is 4.70% for the 10cm mesh, and 2.57% for the 5cm mesh. For water surface elevation, the average uncertainty is 0.45% for the 10cm mesh and 0.10% for the 5cm mesh. Water depth is not very sensitive to changes in mesh size. This agrees with the finding of Lai (2010) regarding the calibration of water depth with coarse meshes. Conversely, unit discharge has 10 times more uncertainty than water surface for the same mesh size. However, matching the water surface elevation is still a method widely accepted and used to calibrate numerical models in spite of the fact that doing this by no means guarantees high accuracy in the other output variables. It is noted that the overall effect of a greater convergence limit, which reduces the simulation running time, is not only accumulated but also compounded throughout the iterative process. Therefore, an increase of one order of magnitude in the convergence limit may result in a dramatic increase of the discretization error by two or three orders of magnitude. However, the uncertainty in unit discharge, due to the increase in convergence limit, still remains in the negligible range of 1E-6m2/s to 1E-4m2/s. The discretization error due to relaxation factor is much smaller than that due to the mesh size and about the same order of magnitudes as the convergence limit. So long as the model is stable and capable of reaching convergence the relaxation has very little (almost insignificant) effect on uncertainty. In conclusion, the size of mesh elements plays the most important role in determining the uncertainty in the results from depth-averaged models. Analysis conducted in Section 7 shows how information from an uncertainty analysis is used to estimate an optimum mesh size that minimizes the numerical discretization errors.
57
(a)
(b)
(c) (d) Figure 6.1 Contours of unit discharge and streamlines in a compound channel with four different mesh sizes: (a) 40cm mesh; (b) 20cm mesh; (c) 10cm mesh; (d) 5cm mesh.
58
(a)
(b)
(c) (d) Figure 6.2 Error contours in a compound channel with two different mesh sizes: (a) error in unit discharge with 10cm mesh; (b) error in unit discharge with 5cm mesh; (c) error in water surface elevation with 10cm mesh; (d) error in water surface elevation with 5cm mesh.
59
(a)
(b)
(c) (d) Figure 6.3 Contours of unit discharge and streamlines in a compound channel with different convergence limits (CL): (a) CL = 8E-4; (b) CL = 4E-4; (c) CL = 2E-4; (d) CL = 1E-4.
60
(a)
(b)
(c) (d) Figure 6.4 Error contours in a compound channel with two different convergence limits (CL): (a) error in unit discharge with CL = 0.0008; (b) error in unit discharge with CL = 0.0001; (c) error in water surface elevation with CL = 0.0008; (d) error in water surface elevation with CL = 0.0001.
61
(a)
(b)
(c) (d) Figure 6.5 Contours of unit discharge and streamlines in a compound channel with different relaxation factors (RF): (a) RF = 0.8; (b) RF = 0.4; (c) RF = 0.2; (d) RF = 0.1.
62
(a)
(b)
(c) (d) Figure 6.6 Error contours in a compound channel with two different relaxation factors (RF): (a) error in unit discharge with RF = 0.4; (b) error in unit discharge with RF = 0.1; (c) error in water surface elevation with RF = 0.4; (d) error in water surface elevation with RF = 0.1.
63
64
7.
OPTIMIZATION OF MESH SIZE
7.1
Introduction
A series of numerical experiments were performed to investigate the effect of several parameters on the accuracy of depth-averaged simulation results. The main goal of these experiments was to determine and recommend an optimum mesh size to use in two-dimensional, depth-averaged models. Numerous studies using such models have been carried out for a variety of purposes from simple flow computation to environmental management. However, their validation has relied on scarce sets of field and laboratory measurements. Furthermore, the great level of complexity inherent to natural river channels makes it difficult to draw single recommendations regarding an optimum mesh size. When conducted, most error analyses of numerical models have only focused on estimating the error due to mesh size. Even when a grid sensitivity analysis or a mesh convergence study is performed, the principal outcome is typically taken to be the average estimated error, which then is regarded as an indicator of the model’s predictive efficiency. The literature on the use of depth-averaged flow models like FESWMS contains no previous study addressing simulation time as a variable to obtain an optimum mesh size. Additional details about previous studies are presented in Section 3.6.
7.2
Numerical Experiments
The present numerical experiments were performed using FESWMS, a computer program that makes use of the Galerkin finite-element method to solve the two-dimensional, depth-averaged, continuity and momentum Navier–Stokes equations written in terms of unit discharge. Section 4 provides background on the FESWMS numerical model. The simulation model used in the present study replicated half of a compound channel consisting of a floodplain with an adjacent half of the main channel. The floodplain width is 2.80m and the half of the main channel width is 1.20m for a total half channel width of 4.00m. The length of the simulated channel is at least seven times the channel half width and the abutment model is located in the middle third of the model length. The model length and abutment location are selected so that the region of interest is sufficiently far away from the boundaries to eliminate numerical instabilities caused by undesirable interactions between the region of interest and the boundaries, i.e., reversed flow at the downstream boundary and spanwise (lateral) velocity components at the upstream boundary. The average flow depths are 0.30m and 0.15m in the main channel and in the floodplain, respectively. The total discharge in the channel is 0.30m3/s. The study entailed a series of simulation runs using the same general layout for the channel while changing the size of the mesh elements. Figure 7.1 shows two examples of the different meshes used in the study. As explained, the changes in mesh size affect the values of the different output variables and, using this information, a recommendation of an optimum mesh size can be made. In total, four different meshes were used with elements having side lengths of 0.40m, 0.20m, 0.10m, and 0.05m. A numerical discretization error was found for each of the grids. Also, the computer run time recorded after convergence was achieved in the model. For consistency, all the runs were performed in a machine with an Intel® Pentium® 4 CPU 3.20GHz and 1.75GB RAM.
65
7.3
Results
The simulation results for water depth, velocity magnitude, shear velocity, and kinematic eddy viscosity are given below. Representative contours of water depth for two different mesh sizes are displayed in Figure 7.2. While no significant change is observed in the main channel region, confirming the finding that water depth is not very sensitive to mesh size, some differences are noticed in the floodplain around the abutment. The streamlines, however, tell a different story. It is observed that the coarse mesh is not sufficient to accurately capture the flow separation and the recirculation that occurs around the abutment. Figure 7.3 shows a comparison of velocity contours between a coarse mesh (0.40m) and a finer mesh (0.10m). Unlike the contours of water depth, the velocity contours display dramatic differences. In the 0.10m mesh simulation, the contours present fewer irregularities and the location of the maximum velocity region in the main channel is slightly shifted downstream. The differences in the floodplain near the abutment remain present, but probably the most visible difference is the absence of a well-defined wake region in the model with the coarse mesh. Figure 7.4 shows the contours of shear velocity, which are essentially similar in behavior to those of velocity magnitude. The comparison of kinematic eddy viscosity is shown in Figure 7.5. It can be seen that the use of the coarser mesh produces artificially high values of eddy viscosity in the recirculation region downstream of the abutment. Throughout most of the floodplain region, the eddy viscosity values obtained with the coarse mesh are 25% to 50% higher than with the 0.10m mesh. Values of mesh size, discretization error, and computer run-time are summarized in Table 7.1. It is important to note that the run time increases as the discretization error is decreased. Also, the increase in computer run-time is much larger than the corresponding reduction in discretization error. Reducing the discretization error by a factor of 2 may increase the run-time by a factor of 4 to 8. Table 7.1 Discretization error and run-time for different mesh sizes Mesh size (m) Discretization error, q (m2/s)
7.4
Run time (s)
0.40
0.0176
24
0.20
0.0088
187
0.10
0.0048
522
0.05
0.0011
2,017
Objective Function
The main purpose of determining an optimal mesh size is to minimize the numerical discretization error while at the same time minimizing the run-time. These are opposing optimization targets, since a coarse mesh minimizes the run-time but increases the discretization error. Conversely, a fine mesh minimizes the discretization error as the run-time greatly increases. To establish an unbiased basis for selecting the optimum mesh size, an objective function is needed. The discretization error and the run-time are normalized using their corresponding maximum values. By normalizing in this way, the coarse mesh is penalized with a high value in terms of discretization error, and at the same time is rewarded with a low value in terms of the run-time. Figure 7.6 shows these trends.
66
The objective function can be written as
O.F .
e emax
t tmax
Eq. (7.1)
where O.F. represents the objective function, e is the discretization error, emax is the maximum discretization error for the set of meshes evaluated, t is the run time, and tmax is the maximum run time for the set of meshes studied. The results of these normalizations provide the values of the objective function for each mesh size. The minimum value of the objective function gives the optimum mesh size. For the current model of flow around a spill-through abutment in a compound channel, the optimum mesh size is found to be 0.10m, as indicated in Figure 7.7.
7.5
Data Analysis
A statistical analysis was performed on several output variables for different mesh sizes. This type of analysis highlights the variables that are more suitable to be used in the formulation for a recommended optimum mesh size. The mean, , and the standard deviation, , of estimated values are defined as
1 N
N
x
Eq. (7.2)
1 N 2 xi N i 1
Eq. (7.3)
i 1
i
and,
The results for velocity magnitude ( Vt ), shear velocity ( u* ), kinematic eddy viscosity ( t ), and cellbased Peclet number (Pe) are outlined in Table 7.2. The Peclet number is defined here as
Pe
Vt x
Eq. (7.4)
t
where, Vt is the magnitude of the velocity vector, x is the characteristic length scale or local mesh size, and t is the kinematic eddy viscosity. The Peclet number represents the ratio of the rate of transport by advection (fluid motion, velocity) to the rate of transport by diffusion (gradients, eddy viscosity). It is clear in Table 7.2 that the cell-based Peclet (Pe) number is the output variable with the greatest sensitivity to changes in mesh size. Also, it is noted that two of the three quantities involved in the calculation of the Peclet number, i.e., velocity and eddy viscosity, not only have non-uniform distributions, but also vary widely with location, making their estimation difficult over the entire flow field in the area of interest. It is therefore concluded that the Peclet number should not be used as the sole criterion to determine an optimum mesh size. However, it may still be valuably used as a starting point in an effort to estimate an optimum mesh size as described in Section 7.6.
67
Table 7.2 Mean value and standard deviation for different variables with various mesh sizes Mesh size ( x ), m 0.40 0.20 0.10 0.05 Variable
Vt u*
t Pe
Vt x
t
Vt / u*
0.38
0.36
0.36
0.36
0.11
0.14
0.13
0.13
0.020
0.019
0.019
0.019
0.005
0.007
0.006
0.006
0.00043
0.00042
0.00041
0.00041
0.00022
0.00025
0.00023
0.00023
400
201
102
52
95
47
27
27
18.7
18.9
18.7
18.6
1.0
1.0
1.0
1.0
7.6 Recommended Optimum Mesh Size The findings from the present flow simulations show the optimum mesh size to be 0.10m for the range of cases studied herein (see Figure 7.7). This result is not intended to serve as an absolute optimum value for all cases; instead, its purpose is to help identify the values of flow parameters which then may be used in other cases. From Table 7.2, for a mesh size of 0.10m, the average Peclet number is 102. Because the Peclet number depends on local velocity magnitude and eddy viscosity, flow properties that vary from point to point in the model, it is challenging to estimate accurately the local values for the Peclet number (values at each cell). Nevertheless, it is possible to account for such spatial variability by making use of non-dimensional relationships that have stable averages and small standard deviations. According to Sukhodolov et al. (1998), the kinematic eddy viscosity at 0.4 of the water depth above the channel bottom (level at which the average velocity can be measured) is found from
t u* H
0.1
Eq. (7.5)
where u* is the shear velocity, and H is the water depth.
Pe
Vt x
t
102
68
Eq. (7.6)
After rearranging Eq. (7.5) and substituting the kinematic eddy viscosity into Eq. (7.6) the result is
Vt x 102 0.1u* H
Eq. (7.7)
Vt 18.7 u*
Eq. (7.8)
Also, Table 7.2 shows that,
By replacing Eq. (7.8) into Eq. (7.7), and rearranging terms, a relationship to estimate an optimum mesh size may be obtained as
x 0.55 H
Eq. (7.9)
Equation 7.9 above implicitly forces the local Peclet number to be about 100 by relating the local mesh size to the local water depth at a point. A quick estimation of the water depth can be easily obtained from known relationships for 1-D open channel flow and the bed topography before the 2-D model is run. In this manner, it is possible to select the optimum (or close to optimum) mesh size while also enhancing the accuracy of the simulation results. This outcome provides useful guidance for the present study and generally for subsequent studies using depth-averaged models of flow around abutments and similar hydraulic structures.
69
0.40m mesh
0.10m mesh Figure 7.1 Schematic views of two mesh sizes (four sizes were used).
70
0.40m mesh
0.10m mesh Figure 7.2 Comparison of water depth contours, as obtained with meshes of two different sizes: 0.40m and 0.10m.
71
0.40m mesh
0.10m mesh Figure 7.3 Comparison of velocity contours, as obtained with meshes of two different sizes: 0.40m and 0.10m.
72
0.40m mesh
0.10m mesh Figure 7.4 Comparison of shear velocity contours, as obtained with meshes of two different sizes: 0.40m and 0.10m.
73
0.40m mesh
0.10m mesh Figure 7.5 Comparison of kinematic eddy viscosity contours, as obtained with meshes of two different sizes: 0.40m and 0.10m.
74
Discretization error
Run time Figure 7.6 Normalized values of discretization error and run time.
75
Figure 7.7 Objective function (O.F.) and optimum mesh size.
76
8.
FLOW AROUND SPILL-THROUGH ABUTMENTS IN COMPOUND CHANNELS
8.1
Introduction
This Section presents insights from the depth-averaged numerical modeling of the flow conditions around spill-through abutments located in the floodplain of compound channels consisting of a main channel and an associate shallow floodplain. The insights comprise distributions of depth-averaged velocity, unit discharge, and shear stress for flow around abutments of varying length. They show that the amplification of velocity, unit discharge, and bed shear stress depend not only on abutment length but also on the relative width of a floodplain compared to half channel width; i.e., no simple, single amplification factor existS for velocity or other flow variables.
8.2
Validation of Numerical Model
The necessary task of validating the numerical model was completed using benchmark experimental data before the FESWMS model was used to produce results for interpretation. The validation used data obtained from measurements taken in the laboratory model described in Section Five. The data were collected using the ADV and LSPIV techniques for measuring flow velocities. ADV Velocity measurements were taken at prescribed depths and regular intervals along the water column in order to obtain a detailed depiction of the velocity profile. Measurements were recorded with sufficient time allowed to ensure that the average does not change with time, i.e., the mean is stationary. Figure 8.1 shows a fully developed turbulent velocity profile taken at the beginning of the test section. Therefore, the assumption of fully developed turbulent flow entering the test section is confirmed. The ADV measurements also serve to test the validity of the theoretical approximation of kinematic eddy viscosity. Figure 8.2 compares the measurements of kinematic eddy viscosity taken in the laboratory flume with values obtained from theoretical Equation 4.14. Based on the results displayed in Figure 8.2, it is concluded that Equation 4.14 is indeed applicable to the current study; or, in other words, the flow field of the model abutment conforms to fully turbulent boundary layer flow. Depth-averaged velocities were obtained from ADV velocity profiles measured at different locations. An example profile is shown in Figure 8.1. The flow velocity at the water surface is measured using the LSPIV technique described in Section 5. Knowledge of the velocity profile enabled estimation of the depth-averaged velocity from measurements of velocity taken at the water surface. The numerical model (FESWMS) directly gives the depth-averaged velocity as an output. Figure 8.3 displays a comparison of model results and experimental measurements obtained from ADV and LSPIV. This comparison is performed at the most geometrically contracted section passing through the abutment centerline. Figure 8.4 shows the exact location of the cross-section of interest. The region where no experimental measurements are reported corresponds to the frontal slope (or spill-slope) of the spill-through abutment where the shallow depth impedes the use of the ADV and the high gradients limit the applicability of LSPIV. The uncertainty analyses previously performed can now be used to examine the validity of the numerical model. In Section 5, the uncertainty of the LSPIV velocity measurements was found to be 6.8% of the measured value; this is well within prevailing uncertainty limits for LSPIV (e.g., Muste, 2004b). In Section 6, the uncertainty of the depth-averaged velocity in the numerical model was computed as 4.5%
77
of the local value. Since the uncertainty in LSPIV is larger than that of the numerical model, the value of LSPIV uncertainty is used for validation of the numerical model. For the numerical simulation to be validated, the numerical results have to be within the uncertainty band of the LSPIV measurements. Figure 8.3 shows that ADV measurements compare closely with the LSPIV measurements, and that the numerical output is located inside the limits of the LSPIV uncertainty band. The numerical model is therefore taken to be validated.
8.3
Results
The main results concerning depth-averaged velocity, unit discharge, and bed shear stress are presented in the following sections. These results were produced using the validated two-dimensional depth-averaged model. 8.3.1
Depth-Averaged Velocity
Flow velocity is expected to increase around an obstruction in regions where the flow contracts. Initial approximations assume one-dimensional uniform velocity distribution throughout the cross section, i.e., a cross-sectional average is assumed. However, these approximations underestimate the actual maximum depth-averaged velocity around the abutment for the following reasons: 1. Velocity in the contracted section is not one-dimensional, especially in the area immediately surrounding the abutment where there is a strong lateral velocity component that significantly increases the magnitude of the velocity vector; 2. Velocity distribution is not uniform in the contracted section. In the immediate vicinity of the abutment there are higher localized flow accelerations; 3. Streamlines are more contracted around the abutment than anywhere else in the flow. Narrow spacing in streamlines is an indication of higher local velocity; and, 4. There is a separation gap in front of the abutment that contracts the flow even further. The results from the numerical model FESWMS, augmented by LSPIV and ADV measurements, provide insights into the distribution of depth-averaged velocity and unit discharge, showing how these flow quantities attain maximum values close to the abutment and for a distance out from the abutment. Figure 8.6 displays contours of depth-averaged velocity in the region of interest for different abutment lengths. It is observed how the velocity distribution is non-uniform at the contracted section and how the recirculation zone caused by flow separation continues to contract the flow even downstream of the abutment. The depth-averaged velocities increase over the entire cross section when the abutment length is increased, because of the contraction effect. However, the increases in velocity are more noticeable near the front of the abutment because of the higher local acceleration of the flow as it comes out of the quasistagnant region that surrounds the upstream slope and enters the contracted section (see Figure 8.5 for a sketch of the overall flow field). The remaining width of the floodplain is unable to quickly spread the flow uniformly in the contracted section within the short span of the contraction (abutment width). Although a part of the flow does reach the edge of the floodplain, and another finite amount even leaves the floodplain to enter the main channel, there is considerable local flow concentration in the region in front of the abutment. The main channel provides some degree of relaxation for the increased flow, spreading it more uniformly across the main channel width. Velocities immediately at the upstream slope (stagnation region) and the downstream slope (recirculation wake region) of the abutment are low and become lower with increasing abutment lengths. On the other 78
hand, the areas near the front of the abutment, especially upstream of the abutment’s centerline axis, display slight increases in velocity as the semi-impounded water in the stagnation region releases in to the main stream. Figure 8.7 displays the trend of velocity amplification in the floodplain and main channel of the contracted section caused by the presence of abutments of various lengths. Figure 8.7 indicates that the velocities in both floodplain and main channel are consistently magnified with increasing abutment length relative to floodplain width, L/Bf. This insight confirms what was observed in Figure 8.6 regarding increasing depth-averaged velocities when the abutment length is increased. Also, it is found that the channel cross-sectional shape, Bf/B, plays an important role in determining the amount of velocity amplification for a given L/Bf value. The velocity amplification increases with an increasing ratio of floodplain width to half channel width (Bf/B). This trend occurs because the flow is effectively more contracted, and the flow is forced to take a tighter bend around the abutment. This finding is a significant advancement upon the findings reported by prior studies. Figure 8.7 also shows data values of rectangular channels representing a limiting case in which Bf/B = 1.0. Rectangular channels are not as common as compound channels, however, they may be thought as a special case of a compound channel with a very wide floodplain. The rectangular channel model is sometimes useful to simulate cases of small abutments located in large floodplains. According to Figure 8.7, the applicability of the rectangular channel model of floodplains is limited to channels with Bf/B > 0.70 and L/Bf < 0.20. Under these conditions the rectangular channel model conservatively over-estimates the velocity amplification by about 15%. The over-estimation is attributed to limitations of the rectangular channel model in regard to flow redistribution in the contracted section; e.g., floodplain flow never leaves the floodplain. Additionally, Figure 8.7 shows data from Molinas and Hafez (2000) in a rectangular channel with short abutments. For their numerical experiments, L/Bf ≤ 0.3 with Bf/B = 1.0, i.e., a rectangular channel. The data from Molinas and Hafez (2000) agree well with the results obtained from the current study for the cases of very short abutments with L/Bf < 0.15. However, as L/Bf increases, the data from Molinas and Hafez (2000) deviate from the trend reported here for rectangular channels. An analysis of their data reveals that u / u* = 9.3, whereas in the present study u / u* ≈ 20 for fully developed turbulent flow in the laboratory flume and in the numerical model. This unusually low value of u / u* suggests that fully developed flow conditions were not completely achieved in the Molinas and Hafez (2000) study. Their data, therefore, are not representative of flow in actual river channels. In summary, the present study reveals the following insights: 1. Data from the current study show a significant increase in the peak value of maximum depthaveraged velocity (also unit discharge and bed shear stress) as L/Bf increases for a fixed value of Bf/B. This is an expected finding because of increased flow contraction as L/Bf increases; 2. The velocity amplification found in the current study covers a much greater range of abutment lengths than that found in the only previous study, that by Molinas and Hafez (2000); and, 3. It is observed in Figure 8.7 Figure 8.7that the velocity amplification factor is always greater in the floodplain than in the main channel of a compound channel. The ratio (Vmax)f/(Vmax)m ≈ 2, which intriguingly coincides with the ratio of main channel flow depth to floodplain flow depth, ym/yf = 2, used in this study.
79
8.3.2
Unit Discharge
The variation of discharge per unit width of bridge waterway (unit discharge) at the bridge centerline accounts for the combined net effect of velocity and water depth changes. The distribution of unit discharge conveniently characterizes the flow allocation around an abutment. Velocity and water depth have opposite behaviors for a channel of fixed slope conveying a given discharge. Velocity increases produce a drawdown in water depth, while lowered velocities near stagnation regions are accompanied by rises in water depth. Unit discharge increases with increasing abutment length in a manner similar to that described for the depth-averaged velocity. However, the reduction in velocity around the upstream face of the abutment is considerably larger than the decline in unit discharge at the same location. For instance, while the depth-averaged velocity may drop by a factor of 20 from 0.40m/s in the approach flow to 0.02m/s near the upstream abutment slope, the unit discharge changes only by about a factor of 2 from 0.05m2/s in the approach flow to 0.02m2/s at the upstream face of the abutment. Figure 8.8 displays contours of unit discharge for few abutment lengths (L/Bf = 0.17 to 1.00) when the ratio of floodplain width to channel half width is 0.70, i.e., Bf/B = 0.70. It is observed in the contours how the unit discharge peaks at two zones: in the floodplain near the frontal slope of the abutment and in the main channel near the modeled channel centerline. These variations are evident in Figure 8.9, which presents cross-sections of unit discharge distributions. This subsection discusses the systematic variation of these peaks. For short abutments in compound channels, unit discharge increases to a local peak in front of the abutment and then gradually drops to a value closer to the one-dimensional floodplain average for the contracted section (see Figure 8.9, with L/Bf = 0.17). As the abutment length increases so does the unit discharge at every point through the bridge waterway. The existence of the local maximum near the abutment front slope is caused by the locally contracted passage of flow around the abutment’s upstream face. The floodplain flow blocked by the abutment is redistributed across the floodplain at the bridge. Some of the flow leaves the floodplain and enters the main channel, further redistributing flow over the entire contracted section. The part of the flow staying on the floodplain does not distribute itself uniformly over the short distance of contracted floodplain; some flow is heavily concentrated near the abutment front slope. The other peak in unit discharge occurs in the main channel in close proximity to the simulated channel center line. The main channel peak unit discharge represents the global maximum for the range of geometries studied. There is also a more uniform flow distribution across the main channel at the contracted section as the abutment length is increased. This occurs because the abutment forces some of the flow to be deflected towards the main channel long before the flow enters the contracted section. Figure 8.8 shows how a fraction of the floodplain flow starts entering the main channel at a distance of approximately one abutment length upstream of the abutment centerline. This fact allows the main channel flow some transition distance to redistribute itself, resulting in a more uniform distribution at the contracted section. It is important to note that the available transition distance for the floodplain flow is about an order of magnitude less than that of the main channel. Figure 8.9 shows that, when the abutment length increases, the absolute increase in unit discharge is of the same order of magnitude in both the floodplain and in the main channel. The main channel unit discharge achieves an asymptotic value around the center of the main channel. Some variations in unit discharge are observed in the main channel region adjacent to the floodplain edge. These variations, representing interactions between floodplain and main channel flow, are small for short abutments and become larger for longer abutments. 80
It is observed in Figure 8.9 that when the abutment occupies 70% of the floodplain length, i.e., L/Bf = 0.70, the extent of interaction between floodplain and main channel flows becomes noticeable. This interaction is observed as a gradient in the local unit discharge accounting for a 13% reduction from the main channel peak value. The unit discharge gradient is accompanied by irregular shifts from the normal flow distribution seen for short abutments. Figure 8.9 also illustrates, for short abutments, that the unit discharge increases in the main channel starting at the floodplain edge and then quickly attains a maximum value around halfway through the main channel width. This maximum value for short abutments is relatively close to the approach unit discharge in the main channel. As abutments become longer, the maximum unit discharge in the main channel continues to increase, however, it does so in a slightly slower manner mainly because of the increasing influence of the abutment on the main channel flow. Figure 8.10 displays the trends for unit discharge magnification in the floodplain and main channel of the bridge waterway for varying ratios of abutment length to floodplain width (L/Bf) and floodplain width to channel half width (Bf/B). It is observed that, as the floodplain becomes wider compared with the channel half width, there is a greater level of unit discharge amplification in the floodplain as well as in the main channel. The rectangular channel represents the limiting case in which the floodplain occupies the entire channel half width, i.e. Bf/B = 1.0. Figure 8.10 also shows that, for the same channel aspect ratio (Bf/B) and the same degree of flow obstruction (L/Bf), the amplification factor for unit discharge is always greater in the floodplain than it is in the main channel. It is important to note that when the floodplain is short, i.e. Bf/B = 0.3, the unit discharge increase in the main channel is only about 10% of the approach main channel average even when the abutment covers 90% of the floodplain width. Under the same conditions of Bf/B and L/Bf, the increase of unit discharge in the floodplain is in the order of 40% of the approach floodplain average. 8.3.3
Boundary Shear Stress
Like unit discharge, boundary shear stress also takes into account the influence of changing water depth and velocity, but also indicates the hydrodynamic force water exerts on the flow boundary. However, unlike the unit discharge which depends directly on velocity and water depth, bed shear stress varies with the square of velocity. Therefore, velocity is the dominant factor determining the absolute value of the boundary shear stress, water depth has a smaller impact, and the terrain slope has perhaps the least significance especially if the bed slope is mild. Figure 8.11 presents the contours of boundary shear stress around abutments of various lengths sited on the floodplain of a channel with a ratio of floodplain width to channel half width equal to 0.70, i.e., Bf/B = 0.70. It is observed that the bed shear stress increases in the contracted region around the abutment because of the increased flow velocity there. However, the maximum shear stress occurs slightly upstream of the abutment centerline on the rounded upstream corner. The rapid acceleration of flow and thereby increased velocity coming out of the stagnation region, the water depth and the steeper abutment slope combine to increase the local shear stress in this small region. It is not surprising, therefore, that this region coincides with the locus of scour initiation. Another characteristic of this high shear region is that it is located in close proximity to the point where the flow begins to separate; it is a region of high turbulence where the velocity fluctuations and the associated turbulent stresses may increase the resultant boundary shear stress because of the existence of non-negligible vertical stresses. Under such conditions, the results obtained from a depth-averaged model may under-estimate the total bed shear stress because of their intrinsic assumption of negligible vertical effects. 81
Since the abutment slopes are typically well protected, and to maintain consistency among results, the current study analyzes more closely the values of shear stress on the floodplain and main channel bed along a cross-section passing through the abutment centerline. Figure 8.12 displays the distribution of shear stress around abutments of different lengths for the case of Bf/B = 0.70. The following features are observed: 1. For abutments with L/Bf < 0.40, the maximum bed shear stress occurs in the main channel because of the greater flow concentration in the main channel; 2. The local maxima in the vicinity of the abutment is of the same order of magnitude as the maximum value in the main channel; and, 3. For longer abutments with L/Bf > 0.7, the maximum bed shear stress for the cross-section occurs in the immediate vicinity of the abutment and the peak is about 25% higher than the highest value in the main channel. Figure 8.13 shows the trends of bed shear stress amplification in the floodplain and main channel for various ratios L/Bf and Bf/B. In all the model combinations studied herein, the bed shear stress in the floodplain and main channel increase primarily with increasing abutment length. This trend is attributed to the overall amplification in the magnitude of the velocity vector. Data from Molinas et al. (1998) on small abutments on rectangular channels (or very wide floodplains) confirm that, for increasing L/Bf, the bed shear stress amplification factor increases. It is also seen in Figure 8.13 that, for increasing ratios Bf/B, the bed shear stress amplification factor at the same L/Bf consistently increases, approaching the limit for a very wide floodplain given by the rectangular channel. The magnification of bed shear stress is greater in the floodplain than in the main channel. While in the floodplain an abutment with L/Bf = 0.40 may give an amplification of about 3, the same abutment would cause an amplification of only about 1.4 in the main channel. If the floodplain is short (Bf/B < 0.3), the amplification in the main channel is small (about 1.3) even if the abutment covers most of the floodplain width, L/Bf = 0.90. The same abutment would increase the bed shear stress in the floodplain by a factor of 2.5, nearly twice as much as the amplification in the main channel. 8.3.4
Flow Distribution between Floodplain and Main Channel
A compound channel comprises a main channel with an adjoining floodplain. The total flow in a compound cross-section may be thought as the summation of the flow in each subsection. The way whereby the flow is distributed in the floodplain and main channel after the abutment is placed provides some insight into the flow interaction between the shallow floodplain and the deeper main channel. Typical models of floodplain flow have commonly assumed a rectangular cross-section. While a rectangular channel model may provide acceptable results for a limited combination of abutment lengths and floodplain widths, it is important to keep in mind that such models lack the ability to consider interactions of any kind between floodplain and main channel. The fact that the rectangular channel model imposes a condition in which all the flow stays within the floodplain boundaries may lead to overprediction of the flow quantities, e.g., velocity, unit discharge, and shear stress. A thorough analysis was performed to assess the influence of abutments on the flow distribution in compound channels for various abutment lengths and floodplain widths. Figure 8.14 displays the trends of percentage of floodplain flow entering the main channel for various ratios of abutment length to floodplain width (L/Bf) and floodplain width to channel half width (Bf/B).
82
The trends shown in Figure 8.14 indicate that, regardless of the floodplain size (expressed in the ratio Bf/B), all the trend lines converge at about 100% for higher values of L/Bf. These trends mean that ultimately all of the floodplain flow goes to the main channel if the abutment is very long. It is not always required for the abutment to occupy the entire floodplain width in order to push all the floodplain flow into the main channel. The presence of the separation gap adjacent to the frontal slope of the abutment (spill-slope) pushes the main flow some distance away from the abutment toe. Therefore, with L/Bf = 0.95, almost 100% of the floodplain flow is forced into the main channel. When the floodplain is very large compared with the main channel (Bf/B = 0.90) and the abutment is short (L/Bf < 0.30), only a small portion of the flow leaves the floodplain. This result happens because there is sufficient space in the floodplain to redistribute the flow without yielding it to the main channel, and also because the main channel has limited discharge capacity and is unable to accept much more flow. Figure 8.14 supports to some extent the idea of using a rectangular cross-section to simulate floodplain flow by confirming that the amounts of flow entering the main channel are sometimes negligible. For instance, when L/Bf = 0.15 and Bf/B = 0.90, only less than 2% of the floodplain flow leaves the floodplain. Nevertheless, it is important to keep in mind that even with small abutments there is always a fraction of the flow that leaves the floodplain, and that this fraction may not be neglected all the time. For a medium size floodplain (Bf/B = 0.50) when L/Bf = 0.30, about 15% of the floodplain flow leaves the floodplain. Also, for the same obstruction ratio, L/Bf, the amount of flow leaving the floodplain, is almost doubled when the ratio of floodplain width to channel half width (Bf/B) changes from 0.90 to 0.70. This indicates that even though the floodplain may be relatively large, a substantial percentage of the floodplain flow may enter the main channel. For Bf/B = 0.70 and L/Bf = 0.30, about 11% of the floodplain flow leaves the floodplain. 8.3.5
Distance to Peak Unit Discharge
The distance to peak unit discharge is the length that encompasses the zone in which the effect of the abutment on the flow can be most perceived. This distance is determined by measuring the length from the abutment toe to the point of maximum unit discharge in the floodplain, measured along the abutment centerline in the most geometrically contracted section of bridge waterway (see Figure 8.15 for definition sketch). The case shown in Figure 8.15(a) corresponds to a peak unit discharge well located within the floodplain limits. Figure 8.15(b) displays what occurs in short floodplains where, due to the complex interaction with main channel flow, the peak unit discharge is flatter and extends to the floodplain edge. Knowledge of this distance is important for preliminary assessments of scour and its corresponding countermeasures, abutment and pier interaction, bridge pier location, etc. Figure 8.16 displays the trends for distance to peak unit discharge for abutments of various lengths and floodplains of different widths. There are two trends shown: one for the best fit of all data, and one for the envelope of all data. The envelope is a curve defined as
Dtp
B L 0.3 0.7 Bf L y f Bf
Eq. (8.1)
where Dtp is distance to peak unit discharge, L is abutment length, yf is approach flow depth in the floodplain, B is half channel width, and Bf is floodplain width. Equation 8.1 provides a conservative estimate for the distance to peak unit discharge. The term L y f expresses, in a simplified way, the size of the cross-sectional area of flow from the floodplain that passes around the abutment. 83
There are three points marked as outliers in Figure 8.16. These points correspond to the case of abutments sited on small floodplains. A wider main channel tends to attract more flow from the adjoining relative narrow floodplain. Under this condition the impoundment effect created by the presence of the abutment is greatly diminished. When the floodplain flow directly upstream of the abutment enters the contracted section it immediately finds a short length of unobstructed floodplain. The influence of the accelerated flow extends beyond the floodplain edge for a distance that cannot be easily quantified (Figure 8.15b). Also, Figure 8.14 confirms that when the floodplain is short, amounts in excess of 20% of the floodplain flow leave the floodplain even when the abutments extend less than 50% of the floodplain width. There is some scatter in the data shown in Figure 8.16. The scatter may be attributed to the aforementioned complexities of the flow in this region involving interactions between abutment, floodplain, and main channel. As an added feature it is important to note that the floodplain peak in unit discharge is in close proximity to the shear layer where the reverse flow over the frontal slope of the abutment meets the forward flow of the main stream. It is a region well known for its high velocity gradients and intense unsteadiness that may not be fully resolved using a steady-state model. However, the FESWMS steady-state, depth-averaged hydraulic model of the flow around abutments in compound channels does provide a reasonably good approximation for the magnitude and location of peak unit discharge in the bridge waterway (see Figure 8.3).
84
Figure 8.1 Fully developed velocity profile at the beginning of the test section.
Figure 8.2 Measurements of kinematic eddy viscosity, t . The theoretical value is given by Eq. (4.14).
85
Figure 8.3 Comparison of model results and experimental ADV and LSPIV measurements at a cross section passing through the abutment centerline (refer to Figure 8.4 showing exact location).
86
Figure 8.4 Location of the cross section of interest.
87
Figure 8.5 Schematic of flow contraction and macro-turbulence generation associated with flow through a bridge waterway in a compound channel (main channel with floodplain).
88
L/Bf=0.17
L/Bf= 0.40
L/Bf = 0.70 L/Bf = 1.00 Figure 8.6 Depth-averaged velocities (m/s) in the region of interest for various values of L/Bf, with Bf/B = 0.70.
89
Figure 8.7 Trend for maximum velocity in the floodplain and main channel of the contracted section for increasing L/Bf. Values of Bf/B ≤ 0.90.
90
L/Bf=0.17
L/Bf=0.40
L/Bf=0.70 L/Bf=1.00 Figure 8.8 Contours of discharge per unit width for different values of L/Bf, with Bf/B = 0.70.
91
Figure 8.9 Comparison of unit discharge distribution trends with different abutment lengths for Bf/B = 0.7.
92
Figure 8.10 Trends of unit discharge amplification in floodplain and main channel with varying L/Bf and Bf/B.
93
L/Bf=0.17
L/Bf=0.40
L/Bf=0.70 L/Bf=1.00 Figure 8.11 Bed shear stress around abutments of different lengths for the case of Bf/B = 0.70.
94
Figure 8.12 Comparison of bed shear stress distribution with different abutment lengths for Bf/B = 0.70.
95
Figure 8.13 Trends for bed shear stress amplification in floodplain and main channel with varying L/Bf and Bf/B; o is the average bed shear stress in the floodplain or main channel for the approach flow upstream of the abutment.
96
Figure 8.14 Trends of percentage of floodplain flow (FP) entering the main channel for different L/Bf and Bf/B.
97
(a)
(b)
Figure 8.15 Definition sketch for distance to peak unit discharge (Dtp); (a) the peak is located in the floodplain, (b) no clear peak location in the very short floodplain.
98
Figure 8.16 Trends of distance to peak unit discharge (Dtp) for various abutment lengths.
99
100
9.
CONCLUSIONS AND RECOMMENDATIONS
The major contributions of this study are extensive insights obtained using a two-dimensional, depthaveraged flow model to examine the distribution of flow around spill-through abutments situated on floodplains in compound channels. By systematically varying selected geometric parameters, particularly abutment length, distinctive patterns and trends were identified in the spatial distribution of unit discharge, depth-averaged velocity and boundary shear stress around abutments. Particularly useful insights are obtained regarding peak values of flow velocity and shear stress in the vicinity of abutments. The quest for such values has been a primary concern for abutment scour depth estimation. The insights provide useful information as to how the flow field varies with abutment and channel proportions. Moreover, the insights give guidelines regarding optimal use of depth-averaged models for simulating the flow around abutments. A further contribution is the evaluation of the sources of uncertainty associated with using a depth-averaged numerical model. The model used in the study was calibrated and validated using measurements from laboratory hydraulic models of spill-through abutments. The principal conclusions drawn from the study are grouped as follows: 1. Evaluation of uncertainty in the use of a depth-averaged numerical model of flow around an abutment; and, 2. Trends in the main features of flow around abutments located in the floodplain of compound channels. Included here are values for the amplification of approach-flow velocity and boundary shear stress in the vicinity of abutments.
9.1
Uncertainty
The following points are the principal conclusions obtained from the work performed during the uncertainty assessment: 1. Three sources of uncertainty were identified and studied, notably mesh size, relaxation factor, and convergence limit. The findings show that mesh size induced the largest uncertainty in the outcome of the depth-averaged numerical flow model; 2. The quantitative uncertainty analysis indicates that sub-optimal selection of mesh size produces the greatest errors in unit discharge. Mesh size variations do not cause significant changes in the estimates of water surface elevation, and the resulting uncertainty values are low. However, the uncertainty in unit discharge estimation using the same mesh size is always higher (sometimes as much as ten times more) than that of the water surface elevation; 3. This study shows for the first time how the insights from an uncertainty analysis can be used, and are effectively used, to determine an approximate optimum mesh size for a depth-averaged numerical simulation. Early studies addressing the effect of mesh size on numerical error did not attempt to produce a recommendation for an average optimum mesh size; and, 4. Further, this study found that the average optimum mesh size for a two-dimensional, depthaveraged model can be related to the local water depth using the relationship
x 0.55 H
Eq. (7.9)
where H is flow depth at a location in the channel and x is the mesh size recommended for that particular location.
101
9.2
Flow Field
The following main insights relate to flow field trends, features, and changes caused by the presence of an abutment in a compound channel: 1. Increases in velocity are more noticeable near the front of the abutment because of the higher local acceleration of the flow as it passes from the upstream side of the abutment into the contracted section; 2. Unit discharge peaks at two zones: in the floodplain near the frontal slope of the abutment and in the main channel near the modeled centerline. The absolute increase in unit discharge is of the same order of magnitude in both the floodplain and in the main channel; however, for the same channel aspect ratio (Bf/B) and the same degree of flow obstruction (L/Bf), the amplification factor is always greater in the floodplain and less in the main channel. The velocity amplification factor is always greater for flow over the floodplain than in the main channel of a compound channel by approximately a factor of two; 3. The maximum shear stress occurs slightly upstream of the abutment centerline on the sloped round corner near the point of flow separation. This finding coincides with observations that abutment scour usually begins at this location (e.g., Ettema et al., 2009); 4. For increasing values of Bf/B (floodplain width with respect to half channel width), the bed shear stress amplification factor at the same L/Bf (abutment length relative to floodplain width) consistently increases, approaching the limit for a very wide floodplain given by the rectangular channel. The magnification of bed shear stress is greater in the floodplain than in the main channel, because flow concentration is greatest on the floodplain; 5. A rectangular channel model for floodplain flow may provide acceptable results for a limited combination of abutment lengths and floodplain widths. Nonetheless, it is important to keep in mind that such models lack the ability to consider interactions of any kind between the floodplain and main channel. Care should be exercised when using rectangular channels to model wide floodplains; 6. Even with small abutments there is always a fraction of the flow that leaves the floodplain and enters the main channel. The fraction may not always be negligible. The amount of flow leaving the floodplain depends on the size of the obstruction and the relative size of the floodplain compared with the half channel width; and, 7. An envelope relationship is suggested for estimating the distance from the abutment toe to the location of peak unit discharge along the cross section passing through the abutment centerline using Equation 8.1; i.e.,
Dtp
B L 0.3 0.7 Bf L y f Bf
Eq. (8.1)
where Dtp is distance to peak unit discharge, L is abutment length, yf is approach flow depth in the floodplain, B is half channel width, and Bf is floodplain width.
102
9.3
Recommendations for Further Research
The following recommendations are made for future work on flow at abutments: 1. Extend the present study by investigating the flow around abutments in compound channels once a scour hole has fully developed; 2. Analyze the cases when, on a short floodplain, a spill-through abutment extends into the main channel; 3. Compare results from depth-averaged models against more advanced three-dimensional models; 4. Perform additional evaluation and verification of Eq. (7.9) ( x 0.55H ) for estimating the optimum mesh size in 2-D depth-averaged flow models; and, 5. Quantify in more detail the flow features at the interface between floodplain and main channel.
103
104
REFERENCES Ahmed, F. and N. Rajaratnam, 2000. Observations on Flow around Bridge Abutment. Journal of Engineering Mechanics, 126(1), 51-59. AIAA, 1995. Assessment of Experimental Uncertainty with Application to Wind Tunnel Testing, AIAA Standard S-071-1995, Washington, DC, United States: American Institute of Aeronautics and Astronautics. AIAA, 1998. Guide for the Verification and Validation of Computational Fluid Dynamics Simulations, AIAA Guide G-077-1998, Washington, DC, United States: American Institute of Aeronautics and Astronautics. ASCE, 2008. Sedimentation Engineering: Theories, Measurements, Modeling and Practice: Processes, Management, Modeling, and Practice 1st ed. M. H. Garcia, ed., Preston, VA: American Society of Civil Engineers. Atayee, A., 1993. Study of riprap as scour protection for spill-through abutments. Transportation Research Record, (1420), 40-48. Barbhuiya, A.K. and S. Dey, 2004. Turbulent flow measurement by the ADV in the vicinity of a rectangular cross-section cylinder placed at a channel sidewall. Flow Measurement and Instrumentation, 15(4), 221-237. Bates, P. and M. Anderson, 1996. A preliminary investigation into the impact of initial conditions on flood inundation predictions using a time/space distributed sensitivity analysis. CATENA, 26(1-2), 115134. Bates, P.D., M.G. Anderson, J. Hervouet, and J.C. Hawkes, 1997. Investigating the Behaviour of TwoDimensional Finite Element Models of Compound Channel Flow. Earth Surface Processes and Landforms, 22(1), 3-17. Biglari, B. and T.W. Sturm, 1998. Numerical Modeling of Flow around Bridge Abutments in Compound Channel. Journal of Hydraulic Engineering, 124(2), 156-164. Cesare, M.A., 1991. First-Order Analysis of Open-Channel Flow. Journal of Hydraulic Engineering, 117(2), 242-247. Chang, H.H., 1988. Fluvial Processes in River Engineering, Malabar, Florida: Krieger Publishing Company. Chow, V., 1959. Open Channel Hydraulics, New York, USA: McGraw-Hill Book Company. Chrisohoides, A., F. Sotiropoulos, and T.W. Sturm, 2003. Coherent Structures in Flat-Bed Abutment Flow: Computational Fluid Dynamics Simulations and Experiments. Journal of Hydraulic Engineering, 129(3), 177-186. Duan, J.G., 2009. Mean Flow and Turbulence around a Laboratory Spur Dike. Journal of Hydraulic Engineering, 135(10), 803-811. Ettema, R., T. Nakato, and M. Muste, 2009. Scour at Bridge Abutments. Web Report for Project 24-20, National Cooperative Highway Research Program, Washington, DC, United States.
105
Ferziger, J.H. and M. Peric, 2001. Computational Methods for Fluid Dynamics 3rd ed., Springer. Froehlich, D., 2002. User’s manual for FESWMS Flo2DH : two-dimensional depth-averaged flow and sediment transport model, McLean VA: Federal Highway Administration. Froehlich, D.C., 1989. Local scour at bridge abutments. Proceedings of the 1989 National Conference on Hydraulic Engineering, August 14, 1989 - August 18, 1989, 13-18. Fujita, I., M. Muste, and A. Kruger, 1998. Large-scale particle image velocimetry for flow analysis in hydraulic engineering applications. Journal of Hydraulic Research, 36(3), 397-414. Ge, L., S.O. Lee, F. Sotiropoulos, and T. Sturm, 2005. 3D Unsteady RANS Modeling of Complex Hydraulic Engineering Flows. II: Model Validation and Flow Physics. Journal of Hydraulic Engineering, 131(9), 809-820. Gogus, M. and I. Al-Khatib, 1995. Flow-Measurement Flumes of Rectangular Compound Cross Section. Journal of Irrigation and Drainage Engineering, 121(2), 135-142. Gui, L., J. Longo, and F. Stern, 2001. Towing tank PIV measurement system, data and uncertainty assessment for DTMB Model 5512. Experiments in Fluids, 31(3), 336-346. Hardy, R.J., P.D. Bates, and M.G. Anderson, 1999. The importance of spatial resolution in hydraulic models for floodplain environments. Journal of Hydrology, 216(1-2), 124-136. Herbich, J., 1967. Prevention of Scour at Bridge Abutments. Proc 12th Congr Int Ass Hydraulic Res, September 11, 1967 - September 14, 1967, 2, 74-87. Hobbs, B., 2005. Two-dimensional numerical simulation of flow in a steep-gradient stream : implications for sediment transport and habitat conditions. MS Thesis. Department of Civil & Environmental Engineering, The University of Iowa. Hu, C., Z. Ji, and Q. Guo, 2010. Flow movement and sediment transport in compound channels. Journal of Hydraulic Research, 48(1), 23. John, V., 2003. Large Eddy Simulation of Turbulent Incompressible Flows: Analytical and Numerical Results for a Class of LES Models 1st ed., Springer. Johnson, K.R. and F.C.K. Ting, 2003. Measurements of Water Surface Profile and Velocity Field at a Circular Pier. Journal of Engineering Mechanics, 129(5), 502-513. Kirkil, G., 2004. Similitude of Coherent Eddies in Flume Experiments on Bridge Scour. MS Thesis. Department of Civil & Environmental Engineering, The University of Iowa. Kirkil, G., S.G. Constantinescu, and R. Ettema, 2008. Coherent Structures in the Flow Field around a Circular Cylinder with Scour Hole. Journal of Hydraulic Engineering, 134(5), 572-587. Koken, M. and G. Constantinescu, 2008. An investigation of the flow and scour mechanisms around isolated spur dikes in a shallow open channel: 1. Conditions corresponding to the initiation of the erosion and deposition process. Water Resources Research, 44, W08406. Kothyari, U.C., R.C.J. Garde, and K.G.R. Raju, 1992. Temporal Variation of Scour Around Circular Bridge Piers. Journal of Hydraulic Engineering, 118(8), 1091-1106.
106
Kouchakzadeh, S., 1996. The local scouring phenomenon at bridge abutments terminating in the floodplain zone. PhD Thesis. Ottawa, Canada, Dept. of Civil Engineering, University of Ottawa. Kouchakzadeh, S. and R. Townsend, 1997. Maximum scour depth at bridge abutments terminating in the floodplain zone. Canadian Journal of Civil Engineering, 24(6), 996-1006. Kwan, T., 1988. A study of abutment scour. Report No. 451. Auckland, New Zealand, Dept. of Civil Engineering, University of Auckland. Lai, Y.G., 2010. Two-Dimensional Depth-Averaged Flow Modeling with an Unstructured Hybrid Mesh. Journal of Hydraulic Engineering, 136(1), 12-23. Laursen, E., 1951. Progress report of model studies of scour around bridge piers and abutments, Washington, DC, United States: National Research Council. Laursen, E., 1960. Scour at bridge crossings. ASCE -- Proceedings -- Journal of the Hydraulics Division, 86(HY2, Part 1), 39-54. Laursen, E., 1963. Analysis of relief bridge scour. ASCE -- Proceedings -- Journal of the Hydraulics Division, 89(HY3, Part 1), 93-118. Lee, S.O. and T.W. Sturm, 2009. Effect of Sediment Size Scaling on Physical Modeling of Bridge Pier Scour. Journal of Hydraulic Engineering, 135(10), 793-802. Lim, S., 1997. Equilibrium Clear-Water Scour around an Abutment. Journal of Hydraulic Engineering, 123(3), 237-243. McEwan, I. and S. Ikeda, 2009. Flow and sediment transport in compound channels : the experiences of Japanese and UK research, Madrid: IAHR International Association of Hydraulic Engineering and Research. Melville, B., S. van Ballegooy, S. Coleman, and B. Barkdoll, 2006a. Countermeasure Toe Protection at Spill-Through Abutments. Journal of Hydraulic Engineering, 132(3), 235-245. Melville, B., S. van Ballegooy, S. Coleman, and B. Barkdoll, 2006b. Scour Countermeasures for WingWall Abutments. Journal of Hydraulic Engineering, 132(6), 563-574. Melville, B.W., 1995. Bridge Abutment Scour in Compound Channels. Journal of Hydraulic Engineering, 121(12), 863-868. Molinas, A. and Y.I. Hafez, 2000. Finite Element Surface Model For Flow Around Vertical Wall Abutments. Journal of Fluids and Structures, 14(5), 711-733. Molinas, A., K. Kheireldin, and B. Wu, 1998. Shear Stress around Vertical Wall Abutments. Journal of Hydraulic Engineering, 124(8), 822-830. Moncada M., A.T., J. Aguirre Pe, P. Bolívar, J.C. and N. Flores, E.J., 2007. Estudio experimental sobre proteccion contra la socavacion en pilas circulares. Revista Tecnica. Available at: http://find.galegroup.com/gtx/infomark.do?&contentSet=IACDocuments&type=retrieve&tabID=T002&prodId=AONE&docId=A193835272&source=gale&srcprod= AONE&userGroupName=wylrc_uwyoming&version=1.0. Morales, R., 2006. A large-scale hydraulic model of riprap-apron performance at a bridge abutment on a floodplain. MS Thesis. Department of Civil & Environmental Engineering, The University of Iowa. 107
Muste, M., Z. Xiong, A. Bradley, and A. Kruger, 2004a. Large-scale particle image velocimetry - A reliable tool for physical modeling. Joint Conference on Water Resource Engineering and Water Resources Planning and Management 2000: Building Partnerships. Minneapolis, MN, United States: American Society of Civil Engineers. Muste, M., Z. Xiong, J. Schöne, and J. Zhongwei Li, 2004b. Validation and Extension of Image Velocimetry Capabilities for Flow Diagnostics in Hydraulic Modeling. Journal of Hydraulic Engineering, 130(3), 175-185. Oliveto, G. and W.H. Hager, 2002. Temporal Evolution of Clear-Water Pier and Abutment Scour. Journal of Hydraulic Engineering, 128(9), 811-820. Ouillon, S. and D. Dartus, 1997. Three-Dimensional Computation of Flow around Groyne. Journal of Hydraulic Engineering, 123(11), 962-970. Pasternack, G.B., A.T. Gilbert, J.M. Wheaton, and E.M. Buckland, 2006. Error propagation for velocity and shear stress prediction using 2D models for environmental management. Journal of Hydrology, 328(1-2), 227-241. Patra, K.C., S.K. Kar, and A.K. Bhattacharya, 2004. Flow and Velocity Distribution in Meandering Compound Channels. Journal of Hydraulic Engineering, 130(5), 398-411. Raikar, R. and S. Dey, 2009. Maximum scour depth at piers in armor-beds. KSCE Journal of Civil Engineering, 13(2), 137-142. Rameshwaran, P. and P.S. Naden, 2003. Three-Dimensional Numerical Simulation of Compound Channel Flows. Journal of Hydraulic Engineering, 129(8), 645-652. Rice, C.E., K.C. Kadavy, and K.M. Robinson, 1998. Roughness of Loose Rock Riprap on Steep Slopes. Journal of Hydraulic Engineering, 124(2), 179-185. Richardson, J. and R. Trivino, 2002. Clear-water abutment scour prediction for simple and complex channels. Transportation Research Record, (1797), 23-30. Sadeque, M.A.F., N. Rajaratnam, and M.R. Loewen, 2008. Flow around Cylinders in Open Channels. Journal of Engineering Mechanics, 134(1), 60-71. Salaheldin, T.M., J. Imran, and M.H. Chaudhry, 2004. Numerical Modeling of Three-Dimensional Flow Field Around Circular Piers. Journal of Hydraulic Engineering, 130(2), 91-100. Sarker, M.A., 1998. Flow measurement around scoured bridge piers using Acoustic-Doppler Velocimeter (ADV). Flow Measurement and Instrumentation, 9(4), 217-227. Schneible, D., 1954. Some field examples of scour at bridge piers and abutments. Better Roads, 28(8), 2124. Sheppard, D.M., M. Odeh, and T. Glasser, 2004. Large Scale Clear-Water Local Pier Scour Experiments. Journal of Hydraulic Engineering, 130(10), 957-963. Stern, F., R. Wilson, and J. Shao, 2006. Quantitative V&V of CFD simulations and certification of CFD codes. International Journal for Numerical Methods in Fluids, 50(11), 1335-1355. Sturm, T.W. and N.S. Janjua, 1994. Clear-Water Scour around Abutments in Floodplains. Journal of Hydraulic Engineering, 120(8), 956-972. 108
Sturm, T.W., 2006. Scour around Bankline and Setback Abutments in Compound Channels. Journal of Hydraulic Engineering, 132(1), 21-32. Sukhodolov, A., M. Thiele, and H. Bungartz, 1998. Turbulence structure in a river reach with sand bed. Water Resources Research , 34(5), 1317-1334. Teruzzi, A., F. Ballio, and V. Armenio, 2009. Turbulent Stresses at the Bottom Surface near an Abutment: Laboratory-Scale Numerical Experiment. Journal of Hydraulic Engineering, 135(2), 106-117. Tey, C.B., 1984. Local scour at bridge abutments. MS Thesis. Auckland, New Zealand, Dept. of Civil Engineering, University of Auckland. Tingsanchali, T. and S. Maheswaran, 1990. 2-D Depth-Averaged Flow Computation near Groyne. Journal of Hydraulic Engineering, 116(1), 71-86. Unger, J. and W. Hager, 2007. Down-flow and horseshoe vortex characteristics of sediment embedded bridge piers. Experiments in Fluids, 42(1), 1-19. Venkatadri, C., G. Mutyam Rao, S. Tahir Hussain, and K. Asthana, 1965. Scour around bridge piers and abutments. Irrigation and Power (India), 22(1), 35-42. Weitbrecht, V., S.A. Socolofsky, and G.H. Jirka, 2008. Experiments on Mass Exchange between Groin Fields and Main Stream in Rivers. Journal of Hydraulic Engineering, 134(2), 173-183. White, F., 2010. Fluid Mechanics 7th ed., McGraw-Hill Science/Engineering/Math. Wilcox, D.C., 1993. Turbulence Modeling for CFD, DCW Industries. Wong, W., 1982. Scour at bridge abutments. Auckland, New Zealand, Dept. of Civil Engineering, University of Auckland. Wormleaton, P.R. and P. Hadjipanos, 1985. Flow Distribution in Compound Channels. Journal of Hydraulic Engineering, 111(2), 357-361. Yorozuya, A., 2005. Scour at bridge abutments with erodible embankments. PhD Thesis. Department of Civil & Environmental Engineering, The University of Iowa. Zhao, W. and A. Huhe, 2006. Large-Eddy simulation of three-dimensional turbulent flow around a circular pier. Journal of Hydrodynamics, 18(6), 765-772
109