Jun 19, 2009 - used DISC systems to process vast amounts of web application. Permission to ... programming experience can easily leverage thousands of hosts. ..... users to change their expensive/fast versus cheap/slow performance.
MapReduce Optimization Using Regulated Dynamic Prioritization Thomas Sandholm and Kevin Lai Social Computing Laboratory, Hewlett-Packard Laboratories Palo Alto, CA 94304, USA
{thomas.e.sandholm,kevin.lai}@hp.com
ABSTRACT We present a system for allocating resources in shared data and compute clusters that improves MapReduce job scheduling in three ways. First, the system uses regulated and user-assigned priorities to offer different service levels to jobs and users over time. Second, the system dynamically adjusts resource allocations to fit the requirements of different job stages. Finally, the system automatically detects and eliminates bottlenecks within a job. We show experimentally using real applications that users can optimize not only job execution time but also the cost-benefit ratio or prioritization efficiency of a job using these three strategies. Our approach relies on a proportional share mechanism that continuously allocates virtual machine resources. Our experimental results show a 11−31% improvement in completion time and 4−187% improvement in prioritization efficiency for different classes of MapReduce jobs. We further show that delay intolerant users gain even more from our system.
Categories and Subject Descriptors C.2.4 [Distributed Systems]: Distributed Applications; D.2.8 [Metrics]: Performance measures
General Terms Experimentation, Measurement, Performance
Keywords MapReduce, Proportional Share, Resource Allocation, Workflow Optimization, DISC
1.
INTRODUCTION
Several recent systems like Sawzall [27], MapReduce [10], Dryad [16], and Pig [24] have converged on the Data-Intensive Scalable Computing (DISC) [5] model, characterized by relaxed consistency, fault tolerance and the ability to scale to thousands of hosts. Companies like Google, Yahoo!, IBM, and Amazon have used DISC systems to process vast amounts of web application
Permission to make digital or hard copies of all or part of this work for personal or classroom use is granted without fee provided that copies are not made or distributed for profit or commercial advantage and that copies bear this notice and the full citation on the first page. To copy otherwise, to republish, to post on servers or to redistribute to lists, requires prior specific permission and/or a fee. SIGMETRICS/Performance’09, June 15–19, 2009, Seattle, WA, USA. Copyright 2009 ACM 978-1-60558-511-6/09/06 ...$5.00.
data. One key DISC benefit is that users with minimal distributedprogramming experience can easily leverage thousands of hosts. This ease-of-programming and the desire to amortize the cost of large systems has resulted in DISC deployments with hundreds of users running thousands of applications per day [22]. Resource allocation affects DISC applications in particular because of their ability to flex (i.e., make tradeoffs between usage and performance) both through the scaling of the basic map and reduce operations and more advanced optimizations like speculative execution [10]. Also, since a single DISC framework (e.g., MapReduce) supports many different application types, we can develop resource allocation improvements to the “thin waist” of the DISC framework and have them apply across a wide variety of applications without modification. As a result, good resource allocation can greatly improve the performance of many DISC applications with little additional development cost. The problem that we address is how to prioritize resource allocation for DISC applications based on the MapReduce platform, given their dynamic and complex nature. One solution is to statically assign priority to different applications. However, this precludes the optimization opportunity of varying an application’s priority over its different stages and components. Another solution is to use heuristics to infer application priorities. This approach lacks accuracy initially and becomes less accurate over time as users learn how to game the heuristics. Another approach is to rely on cooperative users to identify their applications’ dynamic resource requirements. Although this “social scheduling” may work for small, tightly controlled environments, shared MapReduce deployments tend to be large and open. In such an environment, judicious users, in the absence of regulation, are more interested in improving their own application’s performance than that of other users. The flexing ability of DISC applications in particular allows users to easily improve their own performance at the cost of others. In this paper, we examine the optimization of MapReduce applications using dynamic and regulated priority. Using our system, users can change the priority of an application over time and assign different priority to different components. We regulate users by limiting the total priority that they can assign. As a result, they have an incentive to only give their application high priority when it is doing important work and to prioritize bottleneck components over less important ones. More specifically, our contributions are as follows: (1) System efficiency metric. Some resource allocation systems improve the performance of one application at the cost of reducing it for another. To measure this effect, we introduce a total system efficiency metric that is based on the average ratio of actual application performance in a shared system to the application performance in a dedicated system. It measures the impact of a prioritization
system on overall system performance. Using this metric, we show that our prioritization system improves overall system efficiency across a wide variety of MapReduce applications. (2) MapReduce virtualization. A shared MapReduce infrastructure must be able to isolate the performance of different applications and quickly shift resources between different applications. We examine the prioritization of MapReduce jobs running on a Xen-virtualized infrastructure. (3) Automated application-independent optimization strategies. The advantage of MapReduce implementations like Hadoop is their ease of use. We incorporate three prioritization strategies directly into the Hadoop framework: one that prioritizes entire workflows, one that prioritizes different stages of a single workflow, and one that detects and prioritizes bottleneck components within a workflow stage. These strategies require no changes in application code and we show that they improve performance across a wide variety of Hadoop applications. The rest of the paper is organized as follows. We describe a usage scenario in Section 2 and scheduling for MapReduce/Hadoop jobs in Section 3. We present our performance and efficiency models in Section 4, optimization strategies in Section 5, and applications used for the experiments in Section 6. In Section 7, we describe our experimental methodology and results, and we present a sensitivity analysis in Section 8. In Section 9, we review related work, and we conclude in Section 10.
2.
USAGE SCENARIO
This section describes the usage scenario for the system described in this paper. We refer to people who run applications in the system as “users”. They could be application developers, but they could also just run off-the-shelf applications with custom input. For this paper, we assume that users run MapReduce jobs, although this is not a requirement of the underlying resource allocation system. We assume that a process external to the system assigns a budget (priority income) to the users. The budget could be in the form of real currency or a virtual currency. The assignment process could be fair share (i.e., each of n users gets 1/n of the available income) or purchased using real currency. Regardless, changing the income assignment takes place infrequently and externally. We further assume that users know their current income and savings. These assumptions are consistent with and a generalization of existing commercial systems such as Amazon’s EC2. Once a user has a MapReduce job to run, he or she goes through the following phases: (1) How much do I want to spend? We assume that the user has some knowledge about the maximum budget available. The user then determines an actual budget which is less than the job’s maximum budget and meets its deadline. The user computes this by estimating the application’s running time as a function of resources, and queries the allocation system for resource prices. For example, a user knows that an application requires 1000 processor cores to complete within an hour and the current price/core/hour is $.01, so actual_budget = $10 for this deadline. A related issue is mitigating the risk of changes in resource supply and/or demand during the job. More sophisticated systems can automate this phase based on past running times, but this is a separate problem which we do not address in this paper (see [32] for techniques for mitigating risk). The results in this paper do not depend on an accurate resource requirements estimate; we simply assume that users expect a deadline accuracy commensurate with the accuracy of their resource requirements estimate. However, the ability of this system to change job priorities on-the-fly allows users to quickly correct for inaccuracies in computing job requirements. The output
from this phase can be used by the system to infer a user’s attitude towards risk and delay tolerance (see [31]). (2) How do I want to spend? In this paper, we present algorithms (described in Section 5) which automatically allocate the job’s budget both across hosts and over time, based on the MapReduce application’s workflow of jobs. Users pick and configure a template based on the structure of their application’s workflow as well as test runs and their preferences. Users apply the workflow priority template to change the priority of entire workflows. They apply the stage priority template when different stages of a single workflow have different resource requirements. Finally, they apply the bottleneck elimination template when their application’s input splits vary significantly in execution time. Users annotate their application workflows with these templates and specify parameters such as total budget (for all templates), division of budget across stages (for workflow priority), and a optional boost factor, indicating tolerance for variance (for bottleneck elimination). Note that none of the strategies require any complex user input, such as a utility function. (3) Should I spend more or less? As the user’s application runs, he or she has the option of monitoring its progress through a MapReduce monitoring interface. The user has the choice of spending more to ensure that it meets its deadline, spending less to meet its deadline while saving currency, or simply doing nothing. In comparison with commercial price-based systems such as Amazon’s EC2, our system both improves cost/benefit and usability by automating phase (2) above. In comparison with non-pricebased resource allocation systems such as PlanetLab[26], this system improves overall performance by regulating resource usage and individual performance by offering controllable service levels for no additional user effort.
3. MAPREDUCE SCHEDULING The basic MapReduce [10] architecture comprises one master and many workers. The input data is split and replicated in 64 MB blocks across the cluster. When a job executes, the input data is partitioned among parallel map tasks and assigned to idle worker nodes by the master based on data locality. Similarly, the master schedules reduce tasks on idle worker nodes that read the intermediate output from the map tasks. Between the map and the reduce phases, the intermediate map data are shuffled and sorted across the reduce nodes. This ensures that all data with a given key are redirected to the same reduce node, and all keys are streamed in a sorted order during the reduce phase. The master detects and reschedules failed tasks. Typically, a small number of tasks execute substantially slower than average and delay job completion. As a result, the master speculatively executes replicated tasks and uses the first completed result. Apache Hadoop [12] (the most widely used MapReduce implementation) has a variety of schedulers. The original one schedules all jobs using a FIFO queue in the master. Another one, Hadoop on Demand (HOD), creates private MapReduce clusters dynamically and manages them using the Torque batch scheduler. In the most recent approach, Hadoop has a scheduling plug-in framework with schedulers that extend the original FIFO scheduler with fair-share algorithms. These approaches vary in how well they maintain data locality, but share the problems of “social scheduling” and lack usercontrolled scheduling. Social scheduling requires a manual or administrative process for determining job priorities. The overhead of fine-grained social scheduling results in priorities being set infrequently and at a coarse grain (e.g., once a year per user). This ad-
ministrative cost precludes fine-grained scheduling optimizations, regardless of the underlying system’s technical capabilities. A related problem is that users have no opportunity to tailor their resource allocation to fit their application’s requirements. Our approach retains a coarse-grained process for setting incomes (Section 2), but provides users the freedom to optimize their income allocation across jobs of varying importance, during different job stages or to respond to delays caused by unexpected load spikes, critical job failures or slow nodes. We use proportional share allocations enforced by a virtual machine monitor (VMM) to host MapReduce clusters and their services. Figure 1 shows this architecture for the Hadoop services. The namenode-datanode services implement the distributed file system, and the jobtrackertasktracker services implement the MapReduce job execution system.
users with more important tasks to preempt other users. Consequently, there is a disincentive for Tragedy of the Commons [13] behavior, where low priority tasks of malicious and strategic users can starve out cooperating users. The key to this is the regulation of budgets across users where the maximum consumption of each user is effectively capped. This proportional share allocation mechanism has also been shown to be strategy-proof in strictly competitive markets (at least two users competing for the same resource) [43], which in practice means that the mechanism is not easily gameable. If a user runs a workflow over a time period T the total resource share or aggregate performance of the workflow will be: Z T qi (t)dt (2) pi = 0
analogously the total spending rate or cost for the user (profit for provider) will be Z T bi (t)dt (3) ci = 0
Figure 1: Virtualized Hadoop architecture.
4.
MODEL AND METRICS
In our model there are resource users and resource providers. Users are granted a resource quota, which we call a budget, periodically. When users request resource capacity they specify the part of their budget that they want to spend over a set duration of time, which in effect becomes their regulated priority. The spending rate signals to the provider how important the user’s resource consumption is. The fairness principle implemented in all providers is to allocate resources to users proportionally to their spending rates and inversely proportional to the sum of all spending rates of other users. A job is defined as a pair of map and reduce tasks operating on the same input. A workflow comprises a series of stages, where each stage is a job that gets input from the preceding stage and produces output for the succeeding stage. Finally, an application here is a type of workflow run repeatedly.
4.1 Proportional Share Allocation A provider allocates resource share qi to user i at time t as follows: bi (t)/di (t) qi (t) = bi (t)/di (t) + yi (t)
(1)
where bi is the part of the budget that user i is willing to spend over duration di , bi /di is thus the spending rate of user i, and yi is the sum of all existing users’ spending rates. We define yi to be the demand or price of the resource. Whenever a new spending rate is set by a user all qi values are recomputed and enforced instantaneously. The idea behind this model is to let spending rates vary with demand to give users an incentive to be judicial about when and how much of a resource they request. Furthermore, the model allows
Hence, a user may change the spending rate on a resource over time, e.g. by changing the duration (di ) parameter, to accommodate fluctuating capacity requirements without incurring a higher overall cost as long as increases are matched by equivalent drops of equivalent length and size in spending rates. Users can decide whether they need a large share to complete sooner or a smaller share to complete later. Finishing later may cause deadlines to be missed, conversely it might be too expensive to finish sooner based on current demand. The key idea here is that this model allows users to change their expensive/fast versus cheap/slow performance trade-off decisions adaptively according to the workflow characteristics. To measure the success of prioritization strategies we need to define some quantifiable metrics, but before doing so we define some auxiliary models to represent trade offs in cost and benefit parameters and to account for attitudes towards variance (risk) in these parameters. We note that these auxiliary models, which are based on economic utility theory, are used as an evaluation aid, and we do not expect or require users to parametrize the functions defined manually.
4.2 Time Decaying Utility The correlation between the amount a user is willing to spend on a resource and the performance obtained allows us to compare the efficiency of different prioritization strategies, as well as to quantify the overall efficiency of a system with competing users applying different strategies. To capture that different users have different sensitivities to delay, we apply a Jensen time decaying utility function [18] to measure the payoff a user obtains from executing a workflow. The utility of user i can then be represented as follows: Ui = (vi − ci ) × exp(−rTi/min(T ))
(4)
where vi is the importance or valuation of the workflow expressed in budget units, ci is the cost paid for running the workflow, r is the decay rate, and Ti is the total run time of the workflow. To more easily compare the efficiency between different applications with different minimal job duration we normalize the decay rate with min(T ). Longer running applications are thus assumed to have more tolerance to absolute time delay than shorter ones. For example, if a job that would run for 1 minute without resource contention runs for 3 minutes with competing loads, it degrades the benefit for the user more than if an hour-long job runs for an hour and 3 minutes.
4.3 Arrow-Pratt Risk Representation To represent users’ different risk attitudes in our model we apply a transformation of the previous utility function as follows: UiR (Ui ) =
1 − exp(−γUi /Uopt ) 1 − exp(−γ)
(5)
where Uopt is the optimal utility obtainable if there is no resource contention (copt ≈ 0 and Topt ≈ min(T )), and γ is the ArrowPratt risk-aversion coefficient [1, 29]. This ensures that UiR (0) = 0, UiR (Ui ) → 1 when Ui → Uopt , and UiR (x) → x when γ → 0. Hence, γ > 0 for risk averse users, γ = 0 for risk neutral users and γ < 0 for risk seeking users. For example, risk averse users (most common in practice in this setting) would spend more than the average expected price to ensure a high minimal performance, and risk seeking users would spend less, speculating that the price is likely to go down.
4.4 Performance Metric To evaluate the performance improvement of various prioritization strategies compared to the default strategy of not changing the spending rate over the duration of a job, which we call fair-share, we define the completion time improvement metric as follows: ” Pn “ f s i=1 Ti − Ti CI = (6) Pn f i=1 Ti where Tif is the completion time with a fair-share strategy, and Tis is the completion time with a dynamic prioritization strategy for workflow i, and n is the number of workflows in the experiment. This metric is designed as a sanity check to determine whether there is an opportunity to increase the performance with certain prioritization strategies, but does not reflect the full success of the strategy since it does not take the cost for the performance increase into account.
4.5 Prioritization Efficiency Metric Our ultimate metric is thus the prioritization efficiency of a strategy taking both performance and cost into account. It is defined as: n 1 X Ui (7) E= n i=1 Uopt where n again is the number of workflows and Ui and Uopt are as defined in Equation 4. When comparing different workloads the efficiency metric shows how much contention, and thereby prioritization optimization opportunity, there is in different applications. Our metric was inspired by the price of anarchy metric in [25], and it is also similar in spirit to the R-efficiency metric in [38].
5.
flows. Importance may be implied by proximity to deadline, current demand of anticipated output or whether the application is in a test or production phase. The key point is that the system does not know the importance, since there is nothing inherent in the workflow structure that differentiates the instances. Thus the users must signal the importance using a prioritization strategy that we call Workflow Priority. For a series, S, of n workflows a user may specify their relative importance, and our system will then split the overall budget, bS , accordingly and spend wi W Pi∈S (w) = bS Pn (8) j=1 wj for workflow i given workflow weights w = {w1 , w2 , . . . , wn }.
5.2 Stage Priority The Stage Priority optimization strategy is similar to the workflow priority strategy in that the system splits a budget according to user-defined weights. Here the budget is split within the workflow across the different stages. So, if one stage receives an increased share of the budget, then the other stages obtain a corresponding decrease in share to spend the same budget for the workflow as a whole. The motivation for this is that there is some inherent structure in a MapReduce workflow, where different stages may exhibit different levels of resource intensity, e.g. some stages may be more CPU bound than others. By leveraging this structure and spending more on phases where resources are more critical, the overall utility of the workflow may be increased. For a workflow, a user may specify the relative resource intensity (importance) of the n stages of MapReduce pairs, ℘, and our system will then split the overall budget, b℘ , accordingly and spend wi (9) SPi∈℘ (w) = b℘ Pn j=1 wj for stage i given stage weights w.
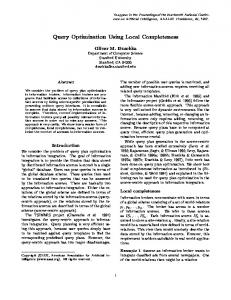
5.3 Bottleneck Elimination The Bottleneck Elimination strategy drills further down individual MapReduce jobs to optimize spending. The observation underlying this strategy is that there may be idle as well as bottleneck resources during some critical synchronization phases of a MapReduce job. For example, when map tasks are about to complete, reducers may wait for slow mappers before they can start processing their input, or towards the end of a job some tasks may be much slower than others and thereby drag down the performance of the entire job. Furthermore, MapReduce job input partitioning is based on the prediction that all partitions will be processed equally fast, which in practice is often imperfect even in the absence of failures and competing load variation, in particular for more CPU-bound applications. Figure 2 depicts a typical MapReduce bottleneck scenario.
OPTIMIZATION STRATEGIES
As alluded to in the previous section, the opportunity to optimize arises from the observation that jobs or workflows may have fluctuating resource capacity requirements over time. Our general approach is to closely monitor the workflow and to adjust the capacity to obtain the optimal utility or value for delivered service depending on the workflow progress and the state of the system. In this section we describe some optimization strategies (automated prioritization agents) that we have implemented.
5.1 Workflow Priority The simplest strategy is to increase spending on all workflows that are more important and drop spending on less important work-
Figure 2: MapReduce bottleneck example.
Our solution is to redistribute the funds from passive idle nodes to active bottleneck nodes, to boost the overall progress of the job. This strategy periodically distributes the budget according to Algorithm 5.1. The budget, b, and deadline, d, are defined as in Equation 1. The boost factor, f , is defined to lie in the interval [0, 1). Algorithm 5.1: B OTTLE N ECK E LIMINATION(nodes) idle ← G ET I DLE N ODES(nodes) active ← nodes �∈ idle ni ← S IZE(idle) na ← S IZE(active) j node.spending ← for each node ∈ active j b/d ∗ (1 + (ni /na ) ∗ f ) node.spending ← for each node ∈ idle b/d ∗ (1 − f )
This algorithm ensures that the average spending rate across all nodes is the same or less than when a constant rate is used for all nodes throughout the job run. This fact can be deduced from the following equation of expected spending, E[s], and average spending, s¯: na E[s] = (b/d(1 + (ni /na )f )+ na + ni ni (b/d(1 − f )) = (10) na + ni b b (na + ni f + ni − ni f ) = = s¯ (na + ni )d d If all the nodes are idle the average spending rate is lower than a constant spending rate otherwise the same. The complexity of the algorithm is O(n). The boost factor, f , can be set by individual users based on the ability to handle variance in performance. However, since the variance also depends on competing users’ variance, in practice it makes sense for the system to put restrictions on the aggregate level of boosting allowed (see Section 7.4).
5.4 Other Strategies We have also implemented additional strategies, which are outside the scope of this paper since they do not target MapReduce jobs specifically. However, they could be used in conjunction with our MapReduce strategies to further optimize the cost-benefit ratio of users, and to improve the overall system efficiency. The Best Response strategy [11] continuously collects the current price (aggregate spending rates) of the nodes in the system. Based on a user’s resource preferences, it decides how to distribute a fixed budget across the nodes to optimize the aggregate utility. This strategy automatically reacts to competition from other users and fluctuating system demand. It is computed efficiently using Lagrangian multipliers as it reduces to a constrained optimization problem [11]. The strategy assumes that node tasks can easily be moved to different nodes and that performance fluctuations are handled gracefully. We have also implemented a slight modification of this strategy for one-shot scheduling of scientific Grid batch workloads [33], and found that it greatly simplified users’ funding decisions for parallel jobs, as well as improved load balancing in the system as a whole. The Prediction strategy [32] takes the current price level as well as historical price levels as input to decide which nodes are the safest to invest in given the risk preferences of a user. In general, given two of three parameters (performance, guarantee, and spending), our system can recommend the third. The rationale for this strategy is that different users may wish to compute at different
service or guarantee levels, and our model effectively allows the provider to multiplex not only across performance and criticality parameters but also across the guarantee and risk attitudes of users. The value to users is that they are explicitly exposed to the current risk when making their resource investment, and they can probe the system with what-if queries to determine the optimal spending rate based on their risk attitude. We implemented this strategy as a combination of a distributed server-side, on-line price statistics collector (gathering running moments), a client-side probability density function estimator, and a what-if probing user interface with three functions; get_performance, get_price, and get_guarantee [31].
6. CASE STUDIES We studied a number of MapReduce workflow applications to evaluate our system and prioritization strategies. The workflows all have different resource requirements and parallelization characteristics.
6.1 GridMix GridMix is a suite of Hadoop programs contributed by Yahoo! as a representative benchmark of their workloads. The input is customized to fit the test cluster. For this case study, our test bed comprised 40 dual CPU hosts with 64GiB disk and 4GiB memory each, so we chose an input data size (uncompressed) of 25 GiB. All jobs use 100 map tasks and 1-18 reduce tasks depending on the job size. Further, we selected three benchmark programs to run: (1) monsterQueries (queries), a three-stage piped MapReduce job with fixed length key and value compressed SequenceFile (Hadoop’s binary input format that allows intermediate compression). Each run of the program completes 13 MapReduce jobs, that run for about 454 seconds without contention. (2) webdataSort (web), a large sort with variable key and value sizes processing a large compressed dataset using the SequenceFile format. Each run of the program completes 7 MapReduce jobs that run for about 386 seconds without contention. (3) textSort (text), a text sort exercising the MapReduce API using variable length keys and values, and the uncompressed text file format. A run of the program launches 6 MapReduce jobs which typically complete within 527 seconds if there is no contention. GridMix is 1) a community de-facto standard for benchmarking, 2) representative for a wide range of workloads, and 3) easy to configure to fit the test bed. On the other hand, it is not a real application and, consequently, it is hard to understand the optimization opportunities intuitively. We therefore used it as a black-box test to quantify the optimization opportunity. Furthermore, the test was resource intensive making it hard for all job stages to complete successfully without a high minimal resource share. Finally, it is predominantly I/O bound, and only makes limited use of the CPU(s). To address these problems we implemented two additional MapReduce workflow applications, which are discussed next.
6.2 Digg The Digg application performs collaborative filtering on traces from digg.com, where users submit and “dig” web articles. Our application analyzes the likelihood that a user would dig a story on topic X if he or she dug a story on topic Y. The application comprises a workflow of three stages of MapReduce jobs depicted in Figure 3. The first stage joins all stories and diggs (users digging a story) over the topic field, the second phase calculates the empirical probability distribution across all topics for all users. The final phase calculates the Pearson correlation coefficients for all topic pairs. The advantage of this calculation is that it can be based on partial sums of products that are computed in parallel on partial
data, and it is therefore very easy to scale the computation up and down. This application is interesting because it is both I/O bound and CPU bound in different stages of the workflow. As input we used one year of traces with 60 million diggs and 6 million stories on 60 topics. On disk it roughly equated to 2.5 GiB of digg data and .5 GiB of story data. For this benchmark we used 23 physical nodes with the same configuration as in the GridMix benchmark.
Figure 4: VideoToon workflow.
Figure 3: Digg workflow.
6.3 VideoToon The VideoToon application transforms streams of video using a non-photorealistic rendering algorithm developed by color scientists at HP Labs. It applies advanced color reduction techniques [21] to drastically reduce the number of colors in an input video, thus giving it a cartoon-like appearance. The algorithm takes a buffer of past video frames into account when rendering subsequent frames, so it is not equivalent to rendering each single frame in parallel. It leverages the MPlayer ringbuffer plug-in framework, so the different sub stream processors need to get an overlap of input data to process all frames in the original video which further limits how aggressively the application can be parallelized. Processing about 1MB of a video stream in one chunk takes roughly 20 minutes without contention. We used this to guide the maximum number of splits the application can process in parallel. We used 18 physical nodes with the same configuration as in the previous benchmarks and a 16 MB video stream. We used a moderately sized configuration to allow enough repetitions to get statistical stability in the results and to make the experiments complete within roughly a day (Section 7). The VideoToon workflow comprises three MapReduce stages, depicted in Figure 4. The first stage splits the original stream into sub streams (including a 15 frame overlap). The second phase processes all substreams with the color-reduction algorithm in parallel, and the last stage joins all substreams together into the original order.
7.
EMPIRICAL EVALUATION
The proportional share algorithm is implemented on top of the Xen Virtual Machine Monitor [4]. An allocated resource share (CPU, memory, disk, bandwidth) is materialized and presented to the user as a virtual machine. This allows us to reconfigure the resource capacity at a very fine granularity with good performance
isolation, and with a very fast reconfiguration time (within a few seconds) without affecting running applications or any running infrastructure services such as the MapReduce services. The downside is of course increased overhead compared to not using virtualization. The proportional share allocation algorithm runs in a daemon on every node in a cluster and reports statistics on aggregate spending rates to a central service locator. Users pay for usage by transferring portions of their granted budget from their own account into the provider account, in a bank service that we implemented, prior to placing resource priority requests. More details about the virtual machine allocation system that we use can be found in [19]. For the MapReduce implementation we use the Apache Hadoop system, which also implements a distributed file system (HDFS).
7.1 Experiment Setup To create resource competition we let two users run the benchmark applications repeatedly and concurrently. Additionally there is a CPU-intensive background task which runs on each node in a separate virtual machine to ensure that there is substantial resource contention between our two benchmark users. Because we use dual-CPU nodes in the experiments, the two users would simply be partitioned on two different CPUs without the background task. A real deployment is also expected to host more than two users per physical node, and the background task is thus a realistic approximation of demand from other users. The users run their own virtual clusters and change their priorities separately to match the strategy and job preferences of the experiment. All benchmarks were hosted on a research test bed with 80 physical nodes, and the experiments used between 18 and 40 of these as described in Section 6. All nodes have 3Ghz dual CPUs and run CentOS 5. Each user repeatedly runs the workflows 25-30 times, so we can calculate the variance accurately. In our graphs we use error bars to indicate the range within ±1 standard deviation off the mean, assuming white-noise errors, to represent the stability of the results. All prioritization strategies are compared to the fair-share baseline strategy that funds all workloads the same amount throughout the whole experiment. The average value per workflow, v in Equation 4, is set to $1 for all applications. In all experiments we track the budget spent for each workflow and the completion time, which constitute the raw data used for all utility and efficiency calculations. An example from the VideoToon experiment described below is shown in Figure 5.
Since all applications have different minimal duration times, we normalized the decay rate in utility according to Equation 4 with r set to 2 across all applications and experiments. Users are assumed to be risk neutral so γ is set to approximately 0 in Equation 5. We will relax both of these constraints in our analysis in Section 8 to see how different delay sensitivities and risk attitudes would affect the results. The general methodology underlying the experiments is to maximize the differentiation in spending between users applying the same or different spending strategies for the same application, while still allowing concurrent workloads to be hosted. Thereby we obtain an approximation of the maximum benefit practically obtainable across different applications and strategy mixes under various competitive (resource contention) scenarios.
7.2 Workflow Priority: GridMix Results We use the GridMix application to evaluate the Workflow Priority strategy. The competing users assign different values (importance) to their workflows over time. High priority workflows are given weight 1 and low priority workflows are given weight .5, resulting in twice the spending rate being used by high priority workflows. The sequence of high versus low priority flows is deterministic for both users and was designed to have minimal overlap where both users increase and drop spending simultaneously. Because we wanted to show that the system can quickly and dynamically adapt to the workloads, there is no synchronization points or barriers introduced in the experiment to avoid overlap, hence the optimal completion time improvement, as defined in Equation 6, is limited even under ideal circumstances (perfectly proportional split across all critical resources at all points in time). Figure 6(a) shows that all benchmarks get a completion time improvement of 11 − 12% from doubling the spending rate. In comparison, the fair-share allocation strategy offers no differentiation. We attribute the relatively low increase in performance to the limited spending differentiation that was possible (without killing concurrent workloads) in combination with the applications being I/O-bound. I/O-bandwidth is not one of the resources currently governed by the proportional share allocator. The bandwidth resources we control include incoming network bandwidth from NIC to CPU and outgoing network bandwidth from CPU to NIC. I/Obandwidth would follow the same model, but due to limited support in Xen and the Linux kernel to enforce this resource reliably at the time of conducting this experiment, it was not implemented 1 . We note that only the GridMix series of applications are affected by this limitation, because the Digg application allows us to be more aggressive in spending differentiation and the VideoToon application is not I/O-bound. Figure 6(b) shows that the benchmarks run more efficiently using the workflow priority strategy as opposed to fair share. The greatest relative improvements are seen in the web and queries benchmarks. These benchmarks obtain a 10% improvement in efficiency when using workflow priority allocation as opposed to fair-share allocation. For the text benchmark the efficiency improvement is only about 4%. This lower improvement is most likely due to the non-local resource contention (e.g. cross-node bandwidth), which we do not control. However, the consistent improvement across all benchmarks shows that the workflow priority strategy allows differentiated performance across a variety of very generic MapReduce applications. 1
A recent kernel extension (http://lwn.net/Articles/ 306984/) allows us to implement this feature in future versions of our system.
7.3 Stage Priority: Digg Results We use the Digg application to evaluate the Stage Priority strategy. In this experiment, one user applies the Stage Priority strategy whereas the competing user uses the fair-share strategy. We compare three runs of the experiment. In each run we let the user increase spending in a different stage of the workflow. The purpose of this set up is to determine the benefit obtainable when optimizing workflow performance by carefully choosing in which stage of the workflow to increase spending. Note that the user who applies the strategy will spend more in each experiment run, because the fair-share strategy uses the lowest spending rate in all stages. The completion time is thus also expected to improve by design using the strategy, although the efficiency may not. The reason why we decided not to let both users apply the strategy at the same time with the same average spending rate like in the other experiments is that the overlap synchronization would be complex and obscure the main point of the investigation. The spending differentiation in this experiment is more substantial than in the GridMix experiment because the Digg application scales down more graciously without crashing. Therefore we could increase the spending rates with a factor of 20. I.e. the different weight vectors in Equation 9 employed were w = {20, 1, 1}, w = {1, 20, 1} and w = {1, 1, 20}, and the fair-share strategy uses w = {1, 1, 1}. The spending vectors were normalized so that all stages with weight 1 received the same budget. We also ran experiments that normalized the vectors to all have the same average spending rate, but our metrics did not show sufficient differentiation then to draw any clear conclusions. Figure 7(a) shows that increasing spending in stage 2 resulted in the best improvement, 31%. From Figure 7(b) it is clear that spending more on stage 2 is the most efficient strategy for this application. It yields 187% gain in efficiency, compared to not increasing spending in any of the stages.
7.4 Bottleneck Elimination: VideoToon Results We use the VideoToon application to evaluate the Bottleneck Elimination strategy. In this case we run the experiment three times. In the first run one user applies the Bottleneck Elimination strategy, in the second run both users apply this strategy and in the third run both users apply the fair-share strategy. The system limits the aggregate boost factor, f as described in Algorithm 5.1, to 0.9. So the first run of the experiment boosts one user with factor f = 0.9 and the second user with f = 0. The second run boosts both users with f = 0.45, and the final run sets f = 0 for both users. We also add a twist to the background load in this experiment. Half of the nodes are picked at random and more load are induced on those nodes. This setup differentiated our results more clearly as our strategy is able to adapt better to a heterogeneous environment than the fair-share approach. Figure 8(a) shows that this strategy resulted in a 20% completion time improvement over fair share, according to the metric defined in Equation 6. From Figure 8(b) we also see that the efficiency improvement is 62%. Note that User 1 in the 1S,1FS experiment run (where one user is strategic and the other uses fair-share spending) is the strategic user and User 2 is the fair-share user in both of these graphs. The main result here is that multiple users applying the bottleneck strategy may co-exist in the system with little impact on each other, whereas the efficiency gains compared to the fair-share strategy is substantial. We note that the efficiency in the case where both users applied the strategy is slightly higher than the efficiency obtained if no user employs the strategy. Furthermore, the efficiency of two strategic users is substantially higher than the efficiency of the fair-share user competing with a strate-
4500
0.35
4000
0.3 0.25
3000 Cost ($)
Job Duration (s)
3500 2500 2000 1500
0.2 0.15 0.1
1000
0.05
Strategic Fair Share
500 0 0
2
4 6 8 10 12 14 16 18 20 (a) Completion Time
Strategic Fair Share
0 0
2
4
6
8
10 12 14 16 18 20
(b) Cost
Figure 5: An example of cost and completion time across experiment jobs. The x-axis shows the finish time of a workflow denoted as hours elapsed since the experiment started.
1
700 0.8
600 500
0.6
400 0.4
300 200
Strat Low Strat High Fair Low Fair High
100 0 web
queries
text
(a) Completion Time
Efficiency
Average Completion Time (s)
800
0.2 Strategic Fair Share web
queries
0
text
(b) Efficiency
Figure 6: Workflow priority GridMix metrics. The x-axis shows the benchmark run in the experiment.
gic user, although the completion times are roughly the same. This difference motivates our separate treatment of efficiency and completion time and also hints that some regulation on the aggregate boost factor, f , is in order (more aggressive aggregate boosting would decrease the completion time further and eventually lead to an efficiency loss too). From a game-theoretic perspective our three experiment runs show that the choice of using our strategy is dominant, in the sense that regardless of whether the other user employs the strategy or not we are better off applying the strategy ourselves. This is seen from our data because both the 1S,1FS and 2S runs yield higher efficiency to the user employing the strategy than the fair-share users in run 2FS. Another interesting result is that the fair-share users showed much larger variance both in completion time and efficiency than the strategic users. Hence, employing our strategy improves system predictability too. The effectiveness of the strategy can be intuitively explained by the strategic users minimizing their impact on the system by reducing priority on idle nodes, so if the other users happen to have their bottleneck on one of those nodes, then efficiency is impacted positively. In summary, some systems regulate users without allowing control, leading to efficiency loss. Other systems allow control with-
out regulation, leading to unfairness. We have shown here that our three optimization strategies improve both control and overall system efficiency while regulating users.
8. ANALYSIS The utility function and thereby also the efficiency metric defined in Section 4 have two dimensions of variability that effect the results; the decay rate, and the risk-aversion coefficient. For the results presented so far we have assumed risk-neutral users, and the decay rate was normalized across all applications to r = 2(see Equation 4), which approximately corresponds to a 0.5% decay rate per second for a job that runs for 6.5 minutes without contention (e.g. GridMix web benchmark), and a 0.08% decay rate for a job that runs for 40 minutes (e.g. the VideoToon application). Here we relax these assumptions and study the sensitivity of the efficiency results when changing the r and γ parameters in Equations 4 and 5.
8.1 Decay Rate Sensitivity The decay rate reflects how important it is for a user to meet a specific deadline. In Figure 9(a) we can see what effect differ-
1
800 0.8
700 600
0.6
500 400
0.4
Efficiency
Average Completion Time (s)
900
300 200
0.2 Strategic Fair Share
100 0 Stage 1
Stage 2
Stage 3
Strategic Fair Share Stage 1
(a) Completion Time
Stage 2
0
Stage 3
(b) Efficiency
Figure 7: Stage priority Digg metrics. The x-axis shows the stage receiving increased funding.
1
3500 0.8
3000 2500
0.6
2000 0.4
1500 1000
Efficiency
Average Completion Time (s)
4000
0.2
500
User 1 User 2
0 1S,1FS
2S
2FS
(a) Completion Time
User 1 User 2 1S,1FS
2S
0
2FS
(b) Efficiency
Figure 8: Bottleneck elimination VideoToon metrics. The x-axis shows the user mix of the experiment run where nS denotes n strategic users, and nFS denotes n fair-share users.
ent decay rates have on the efficiency improvement. The center of this graph corresponds to the default value (r = 2). The obvious trend is that the higher decay rate (lower tolerance for delay) the higher efficiency improvement is obtained from our prioritization strategies. Because the GridMix benchmark applications showed an order of magnitude less improvement in efficiency we display them at a different scale (left y-axis) than the Digg and VideoToon applications (right y-axis). We can see that the GridMix web and queries applications show similar improvement in efficiency at the default delay sensitivity level (r = 2), but our optimization is more efficient for the queries application for higher decay rates and more efficient for the web application at lower decay rates. This behavior showcases that the delay sensitivity of users as well as the structure of their applications determine how amenable a workflow is to optimization. The interesting question is now what the behavior is when decay rates approach zero? We can see that most applications maintain a higher efficiency than the fair-share model (efficiency improvement 0 in the graphs) regardless of the decay rate chosen. However, the queries and text benchmarks are only more efficient than the fair-share baseline for decay rates greater than r = .07. We also note that the Digg and GridMix-queries applications show particularly steep growth in efficiency improvement with increasing decay rates.
In conclusion even very delay insensitive users may benefit greatly from optimizing the spending dynamically.
8.2 Risk Sensitivity The risk attitudes of users reflect how sensitive they are to fluctuations in performance. Figure 9(b) shows how sensitive the efficiency result is to different risk attitudes of users. Previously presented results assumed risk neutral behavior (risk aversion coefficient 0). The graph shows that the more risk averse the users are the less is the efficiency gain of the prioritization strategy and the less is the difference in efficiency gain among the benchmark applications. The applications with high decay sensitivity (Digg and GridMix queries) also show steep decay in efficiency gain with increasing risk aversion (decreasing risk tolerance). A moderately risk seeking Digg application (γ = −3) can obtain close to 6 times (600%) gain in utility from using our optimization strategy. To get an understanding of how risk seeking these users are we also graph the risk profiles of the extremes, −3 and 3 as risk aversion coefficients, in Figure 9(c). The gain (U/Uopt ) and the utility (U R ) are defined as in Equation 5. In summary, this analysis shows that users with a high risk aversion coefficient (γ = 3) could still get very high efficiency gains with our strategies; 65% in the Digg application, and 30% in the VideoToon application compared to 187% and 62% respectively for a risk neutral user.
20 15 10 5 0
0.5
1
1.5 2 2.5 3 3.5 4 Decay Rate (a) Time Decay Efficiency Improvement
Utility (UR)
0
1 0.9 0.8 0.7 0.6 0.5 0.4 0.3 0.2 0.1 0
35
web queries text digg vtoon
30 25 20 15 10 5 0 -3
550 500 450 400 350 300 250 200 150 100 50 0
Application (digg,vtoon) (%)
25
600 550 500 450 400 350 300 250 200 150 100 50 0
GridMix (web,queries,text) (%)
web queries text digg vtoon
Application (digg,vtoon) (%)
GridMix (web,queries,text) (%)
30
-2
-1 0 1 2 3 4 5 Risk Aversion Coefficient (b) Risk Aversion Efficiency Improvement
risk prone risk neutral risk averse 0.1 0.2 0.3 0.4 0.5 0.6 0.7 0.8 0.9 Gain (U/Uopt) (c) Risk Profile
1
Figure 9: Time decay, risk aversion sensitivity and risk profile example.
9.
RELATED WORK
Related work falls into five broad categories, shared cluster scheduling, optimizations within the MapReduce framework, optimizations in alternative data intensive programming models, traditional database query optimization, and dynamic proportional share allocation. First-In First-Out (FIFO) scheduling is a popular model because of its simplicity, but typically requires social scheduling in large deployments, and could lead to head of queue blocking and gaming behavior as shown in [7]. Shortest Remaining Processing Time (SRPT) has some nice theoretical properties such as minimizing sojourn time (here called completion time), but relies on estimating job sizes accurately, which could be difficult in practice [17, 40]. Preemption and backfilling strategies can improve the completion time in these systems. However, the efficiency of the system may deteriorate under competitive settings when resource contention is high by solely focusing on optimizing system properties such as utilization or throughput without taking job importance differences into account. User-centric, utility-based optimization, developed in [9, 15, 28], addresses this problem and shows that it can lead to improvements in aggregate user utility (social welfare) compared to the traditional scheduling techniques. We extend this body of work by taking advantage of the MapReduce structure of applications to distribute spending optimally, and thereby both impose a lower negative impact on the system as a whole and also improve
the individual cost-benefit ratio of workflows. This design reduces the burden on end-users, compared to systems where users need to fully specify utility functions as in [2]. Optimization of workflow execution within a MapReduce framework has been addressed within the PIG system [23]. PIG provides a SQL-like data access language and the optimization techniques are therefore similar to database query optimization approaches. Optimization techniques applied include, reordering of commuting filters, automated collocation of mappers and reducers, optimal selection of alternative join implementations, and reuse of intermediate output across users. The LATE system [42] extends the speculative execution in Apache Hadoop’s MapReduce implementation to make better estimates of which job executions need to be duplicated. The key innovation of LATE is to take the system impact of speculative jobs into account and to make better progress predictions to resubmit more appropriate tasks. In [6] the MapReduce scheduling model is extended to account for heterogeneity of the compute nodes in terms of availability and CPU performance, common in large scale Grid systems. The Mars system [14] implements MapReduce optimizations on GPU platforms mainly by aggressively taking advantage of the massive threading capacity. A large number of mappers and reducers can thus be physically collocated but run in multiple threads. A similar extension is implemented in the Phoenix system [30] which is targeted at shared memory clusters. There is, however, no way of enforcing or leveraging cross-
user priorities in the context of a MapReduce job, which is the key to all of our optimization techniques, in any of these systems. A number of alternatives to the MapReduce model has been proposed to tackle inefficiencies in the model. Dryad [16] allows specification and parallel execution of complete DAGs. One key optimization is a divide-and-conquer technique where the job can be split into sub-parts depending on the size of the input (or intermediate output) and the available resources. This dynamic flexing of resources allocated for a job could be compared to our dynamic virtual machine capacity boosting approach. The advantage of our approach is that we can decide to boost the capacity at any point during the execution of a job and not only when the input data is split. In [20] an extension to MapReduce is proposed based on the Mortar stream processor to execute MapReduce tasks continuously over a stream of source data. This avoids some of the inefficiencies of having to resubmit MapReduce jobs to accommodate partially new data. A similar problem is addressed in the Oivos system [37], which essentially allows multi-pass MapReduce jobs to pick up from where they left off in the previous run akin to how the Unix make program processes source code build workflows in a Makefile. We do not address any of these inefficiencies in our optimizations but see them as complimentary to our work, because they still make use of the MapReduce primitives for individual jobs. The more continuous execution model is also a good fit to our proportional share allocation model, whereas traditional batch scheduling policies would have a hard time scheduling the streams. In [41] a junction-tree topology instead of the master-worker topology in MapReduce is proposed to avoid the master becoming a bottleneck in large computations. We address this problem by increasing the spending rate on the master nodes. Our bottleneck strategy is more flexible, in that it can mitigate worker node bottlenecks dynamically on any nodes as soon as they appear. Our work is also related to traditional database optimization approaches such as the adaptive query processing used in the Eddies [3] and Flux [35] systems. These systems are in turn based on the seminal work in [34] on database query optimization. They rely on tracking statistics, putting costs on equivalent data access paths, sharing intermediate results across queries and users, and choosing among alternative join orders and commuting filters. They are all limited by and tied to the use of SQL and are not applicable for more custom parallel processing allowed by MapReduce and CPU intensive applications such as our VideoToon application. The Mariposa system [36] is a distributed database where queries receive a budget to spend for execution, and each site tries to optimize income by selling storage objects and processing requests. However, Mariposa has no notion of proportional share, virtualization nor MapReduce stages, which are all central to our optimization strategies. Dynamic and distributed proportional-share resource allocation has been investigated in the Lottery Scheduling [39], REXEC [8] and Tycoon [19] systems. Neither of these systems implement any workflow optimization strategies, but deploying Hadoop on top of any of these systems would allow us to apply the strategies presenter here.
10. CONCLUSIONS We have shown that our approach of isolating MapReduce clusters in virtual machines with a continuously adjustable performance based on user-determined spending rates can address many of the resource allocation inefficiencies in existing systems. We however recognize that the problem of staging in and accessing large common data sets becomes more complex in a virtual setting. To this end we intend to investigate different approaches for overlay-
ing MapReduce and HDFS clusters on virtual machines to make different trade-offs between performance isolation and data reuse. Another direction of future work is to integrate our system more closely with the Hadoop scheduler plug-in to allow some of our optimization strategies to be used in standard (non-virtualized) Hadoop installations.
Acknowledgments We would like to thank our colleagues Nathan Moroney, Pere Obrador and Gabor Szabo for their help with the VideoToon and Digg applications used in our case study. We would also like to thank our shepherd Eno Thereska and the anonymous reviewers for insightful comments that helped improve the final version of this paper.
11. REFERENCES [1] K. Arrow. Aspects of the theory of risk-bearing. Helsinki: Yrjo Jahnsson Lectures, 1965. [2] A. AuYoung, L. Grit, J. Wiener, and J. Wilkes. Service contracts and aggregate utility functions. In Proceedings of the IEEE International Symposium on High Performance Distributed Computing (HPDC), June 2006. [3] R. Avnur and J. M. Hellerstein. Eddies: Continuously adaptive query processing. In ACM SIGMOD: International Conference on Management of Data, 2007. [4] P. Barham, B. Dragovic, K. Fraser, S. Hand, T. Harris, A. Ho, R. Neugebauer, I. Pratt, and A. Warfield. Xen and the art of virtualization. In Proceedings of the ACM Symposium on Operating Systems Principles, 2003. [5] R. E. Bryant. Data-intensive supercomputing: The case for DISC. Technical Report CMU-CS-07-128, Carnegie Mellon University, 2007. [6] K. Cardona, J. Secretan, M. Georgiopoulos, and G. Anagnostopoulos. A grid based system for data mining using MapReduce. Technical Report TR-2007-02, AMALTHEA, 2007. [7] B. N. Chun, P. Buonadonna, A. AuYoung, C. Ng, D. C. Parkes, J. Shneidman, A. C. Snoeren, and A. Vahdat. Mirage: A microeconomic resource allocation system for SensorNet testbeds. In Proceedings of the 2nd IEEE Workshop on Embedded Networked Sensors, 2005. [8] B. N. Chun and D. E. Culler. Market-based proportional resource sharing for clusters. Technical Report CSD-1092, University of California at Berkeley, Computer Science Division, January 2000. [9] B. N. Chun and D. E. Culler. User-centric performance analysis of market-based cluster batch schedulers. In Proceedings of the 2nd IEEE International Symposium on Cluster Computing and the Grid, 2002. [10] J. Dean and S. Ghemawat. MapReduce: Simplified data processing on large clusters. In Symposium on Operating System Design and Implementation, 2004. [11] M. Feldman, K. Lai, and L. Zhang. A price-anticipating resource allocation mechanism for distributed shared clusters. In Proceedings of the ACM Conference on Electronic Commerce, 2005. [12] http://hadoop.apache.org/core, 2008. [13] G. Hardin. The tragedy of the commons. Science, 162:1243–1248, 1968. [14] B. He, W. Fang, Q. Luo, N. K. Govindaraju, and T. Wang. Mars: a MapReduce framework on graphics processors. In
[15]
[16]
[17]
[18]
[19]
[20] [21]
[22]
[23]
[24]
[25] [26]
[27]
[28]
[29] [30]
[31]
PACT ’08: Proceedings of the 17th international conference on Parallel architectures and compilation techniques, pages 260–269, New York, NY, USA, 2008. ACM. D. Irwin, J. Chase, and L. Grit. Balancing risk and reward in market-based task scheduling. In International Symposium on High Performance Distributed Computing, 2004. M. Isard, M. Budiu, Y. Yu, A. Birrell, and D. Fetterly. Dryad: distributed data-parallel programs from sequential building blocks. In EuroSys ’07: Proceedings of the 2nd ACM SIGOPS/EuroSys European Conference on Computer Systems 2007, pages 59–72, New York, NY, USA, 2007. ACM. P. R. Jelenkovic, X. Kang, and J. Tan. Adaptive and scalable comparison scheduling. In ACM SIGMETRICS’07: International Conference on Measurement and Modeling of Computer Systems, pages 215–226, 2007. E. Jensen, C. Locke, and H. Tokuda. A time-driven scheduling model for real-time operating systems. In IEEE Real-Time Systems Symposium , pages 112–122, 1985. K. Lai, L. Rasmusson, E. Adar, S. Sorkin, L. Zhang, and B. A. Huberman. Tycoon: an implemention of a distributed market-based resource allocation system. Multiagent and Grid Systems, 1(3):169–182, Aug. 2005. D. Logothetis and K. Yocum. Ad-hoc data processing in the cloud. Proc. VLDB Endow., 1(2):1472–1475, 2008. N. Moroney, P. Obrador, and G. Beretta. Lexical image processing. In Proceedings of the 16th IS&T/SID Color Imaging Conference, pages 268–273, 2008. C. Olston. Pig: Web-scale processing. http://www.cs.cmu.edu/~olston/pig.ppt, 2008. C. Olston, B. Reed, A. Silberstein, and U. Srivastava. Automatic optimization of parallel dataflow programs. In USENIX Annual Technical Conference, 2008. C. Olston, B. Reed, U. Srivastava, R. Kumar, and A. Tomkins. Pig latin: A not-so-foreign language for data processing. In SIGMOD 2008: ACM SIGMOD/PODS Conference, 2008. C. H. Papadimitriou. Algorithms, games, and the Internet. In Symposium on Theory of Computing, 2001. L. Peterson, T. Anderson, D. Culler, , and T. Roscoe. Blueprint for Introducing Disruptive Technology into the Internet. In First Workshop on Hot Topics in Networking, 2002. R. Pike, S. Dorward, R. Griesemer, and S. Quinlan. Interpreting the data: Parallel analysis with Sawzall. Scientific Programming Journal Special Issue on Grids and Worldwide Computing Programming Models and Infrastructure, 13(4):227–298, 2003. F. I. Popovici and J. Wilkes. Profitable services in an uncertain world. In SC05: Proceedings of Supercomputing, 2005. J. Pratt. Risk aversion in the small and in the large. Econometrica, 32:122–136, 1964. C. Ranger, R. Raghuraman, A. Penmetsa, G. Bradski, and C. Kozyrakis. Evaluating MapReduce for multi-core and multiprocessor systems. In HPCA’07: IEEE 13th International Symposium on High Performance Computer Architecture , pages 13–24, 2007. T. Sandholm. Statistical methods for computational markets.
[32]
[33]
[34]
[35]
[36]
[37]
[38]
[39]
[40]
[41]
[42]
[43]
Doctoral Thesis ISRN SU-KTH/DSV/R–08/6–SE. Royal Institute of Technology, Stockholm, 2008. T. Sandholm and K. Lai. A statistical approach to risk mitigation in computational markets. In Proceedings of the ACM International Symposium on High Performance Distributed Computing (HPDC), June 2007. T. Sandholm, K. Lai, J. Andrade, and J. Odeberg. Market-based resource allocation using price prediction in a high performance computing grid for scientific applications. In Proceedings of the IEEE International Symposium on High Performance Distributed Computing (HPDC), June 2006. P. G. Selinger, M. M. Astrahan, D. D. Chamberlin, R. A. Lorie, and T. G. Price. Access path selection in a relational database management system. In SIGMOD 1979: ACM SIGMOD International Conference on the Management of Data, 1979. M. A. Shah, J. M. Hellerstein, S. Chandrasekaran, and M. J. Franklin. Flux: An adaptive partitioning operator for continuous query systems. Technical Report UCB/CSD-2-1205, U. C. Berkley, 2002. M. Stonebraker, P. M. Aoki, W. Litwin, A. Pfeffer, A. Sah, J. Sidell, C. Staelin, and A. Yu. Mariposa: a wide-area distributed database system. The VLDB Journal, 5(1):048–063, 1996. S. V. Valvag and D. Johansen. Oivos: Simple and efficient distributed data processing. High Performance Computing and Communications, 2008. HPCC ’08. 10th IEEE International Conference on, pages 113–122, Sept. 2008. M. Wachs, M. Abd-El-Malek, E. Thereska, and G. R. Ganger. Argon: performance insulation for shared storage servers. In FAST’07: 5th USENIX Conference on File and Storage Technologies, 2007. C. A. Waldspurger and W. E. Weihl. Lottery scheduling: Flexible proportional-share resource management. In Operating Systems Design and Implementation, pages 1–11, 1994. A. Wierman and M. Nuyens. Scheduling despite inexact job-size information. In ACM SIGMETRICS’08: International Conference on Measurement and Modeling of Computer Systems, pages 25–36, 2008. J. Wolfe, A. Haghighi, and D. Klein. Fully distributed EM for very large datasets. In ICML ’08: Proceedings of the 25th international conference on Machine learning, pages 1184–1191, New York, NY, USA, 2008. ACM. M. Zaharia, A. Konwinski, A. D. Joseph, R. Katz, and I. Stoica. Improving MapReduce performance in heterogeneous environments. In OSDI’08: 8th USENIX Symposium on Operating Systems Design and Implementation , 2008. L. Zhang. The efficiency and fairness of a fixed budget resource allocation game. In International Colloquium on Automata, Languages and Programming, pages 485–496, 2005.