Method for continuous nondisturbing monitoring of ... - IEEE Xplore
Recommend Documents
University of Twente, Enschede, The Netherlands. Email: {f.seraj, n.meratnia, p.j.m.havinga}@utwente.nl. Abstract—Ground transport infrastructures require in- ...
RFID Technology for Continuous Monitoring of Physiological Signals in Small Animals. Tobias Volk. â. , Stefan Gorbey. â. , Mayukh Bhattacharyya, Waldemar ...
can lead to hypoglycemia or hyperglycemia in artificial pancreas control systems for patients with type 1 diabetes (T1D). In this paper, multivariable statistical ...
Improved Online Monitoring Method for Transformer. Winding Deformations Based on the Lissajous. Graphical Analysis of Voltage and Current. Chenguo Yao ...
KDDI R&D Laboratories Inc. 2-1-15 Ohara, Fujimino-shi, Saitama 356-8502 JAPAN. {ogino, yokota}@kddilabs.jp. Abstract âDetecting degraded signal quality ...
Roger G. Mark, Senior Member, IEEE, and Richard J. Cohen. AbstractâA clinical method for monitoring cardiac output. (CO) should be continuous, minimally ...
Abstractâ Pulse arrival time and the amplitude of the finger photoplethysmogram were used to track blood pressure contin- uously over 10-minute intervals.
why we need to architect for CD, describe the implications of architecting for CD, and discuss the challenges this new context creates. This information can ...
Extension of the Concept of Windings in Magnetic FieldâElectric Circuit ... Index TermsâCoupling, electric circuit, finite element method, magnetic field, ...
University of Electronic Science and Technology of China ... University of Colorado-Denver ... School of Electrical, Electronic and Computer Engineering.
Mar 26, 2012 - Robotics for Environmental Monitoring. By Matthew Dunbabin ... scale environmental monitoring that ... itoring applications within the marine,.
Taouali* , Mohamed. Faouzi Harkat**, Nasreddine. Bouguila*. * Laboratory of Automatic Signal and Image Processing(LARATSI), National School of Engineers ...
models, all passenger cars and trucks in the United States are required to have ..... the M.S. degree in mechanical engineering from Clemson. University in 1988 ...
Yaseen Oweis is a graduate of the Johns. Hopkins University biomedical engi- neering program. As an engineer with. Infinite Biomedical Technologies for.
Limerick, Ireland. Khalil.arshakgul.ie, Essajafergul.ie. Arousian Arshak. Department of Physics. University of Limerick. Limerick, Ireland. Arousian.arshakgul.ie.
stalled and operational, is the centered activity in the process of assessing the efficacy of distribution ... as a current-limiting reactor. The standard ... of economy interchange and operating benefits versus tie-line capacities as well as versus
Sep 16, 2010 - Y.L. Li, K.F. Han, X. Tan, N. Yan and H. Min. An improved recycling structure for an operational transconductance amplifier is proposed.
Electrocardiographic Method for Identifying Moxifloxacin-induced Ventricular. Repolarization Abnormalities. JP Couderc, M Vaglio, X Xia, S McNitt, O Hyrien, ...
The excavation was conducted at shallow depth in a strong basaltic rock mass. ... C. L. 1997. Manual of tunnels and underground workings (in Spanish). Madrid.
ICSE2004 Proc. 2004, Kuala Lumpur, Malaysia. Condenser Microphone performance Simulation using equivalent circuit method. Bahram Azizollah Ganji and ...
denoted flipped voltage follower. Circuits based on these techniques operate with a single supply voltage close to a transistor's threshold voltage. 1. Introduction.
gateway using Bluetooth technology. ... the device. The designed device is an important component of a ... The wireless transmission technologies (GPRS, GSM,.
Method for continuous nondisturbing monitoring of ... - IEEE Xplore
AbstractâThis paper concerns continuous nondisturbing es- timation of blood pressure using mechanical plethysmography in connection with standard ...
IEEE SENSORS JOURNAL, VOL. 6, NO. 3, JUNE 2006
819
Method for Continuous Nondisturbing Monitoring of Blood Pressure by Magnetoelastic Skin Curvature Sensor and ECG Eugenijus Kaniusas, Helmut Pfützner, Member, IEEE, Lars Mehnen, Jürgen Kosel, Juan Carlos Téllez-Blanco, Giedrius Varoneckas, Audrius Alonderis, Turgut Meydan, Manuel Vázquez, Michael Rohn, Alberto M. Merlo, and Bernd Marquardt
Abstract—This paper concerns continuous nondisturbing estimation of blood pressure using mechanical plethysmography in connection with standard electrocardiography (ECG). The plethysmography is given by a novel magnetoelastic skin curvature sensor (SC-sensor) applied on the neck over the carotid artery. The sensor consists of a magnetoelastic bilayer partly enclosed by a coil. Bending the bilayer causes large changes of magnetic permeability which can be measured by the coil. The SC-sensor signal and the ECG signal are adaptively processed in order to estimate blood pressure according to a specifically established theoretical model. The model uses estimated vessel radius changes and pulse transit time as parameters. The results show cross correlation coefficients in the range 0.8 up to 0.9 between reference and estimated values of systolic blood pressure, diastolic blood pressure, and systolic/diastolic blood pressure 7 mmHg change, whereas the estimation error was below 4 at rest and increased with the stress level. Limitations of the model applicability are given by a hysteretic behavior of both model parameters due to inert changes in artery stiffness. The SC-sensor and the ECG electrodes cause minimal inconvenience to the patient and offer an approach for a continuous nondisturbing monitoring of blood pressure changes, as being relevant for sleep monitoring or biomechanic feedback.
Manuscript received April 30, 2005; revised July 14, 2005. This work was supported by the Hochschuljubiläumsstiftung Vienna and the EU project B-SENS (G5RD-CT-2002-00690). The associate editor coordinating the review of this paper and approving it for publication was Prof. Eugenii Katz. E. Kaniusas, H. Pfützner, L. Mehnen, J. Kosel, and J. C. Téllez-Blanco are with the Institute of Fundamentals and Theory of Electrical Engineering, E351, Bioelectricity and Magnetism Lab, University of Technology, A-1040 Vienna, Austria (e-mail: [email protected]; [email protected]; [email protected]; [email protected]; [email protected]). G. Varoneckas and A. Alonderis are with the Institute of Psychophysiology and Rehabilitation, Kaunas University of Medicine, LT-00135 Palanga, Lithuania (e-mail: [email protected]; [email protected]). T. Meydan is with the Wolfson Centre for Magnetics Technology, School of Engineering, Cardiff University, Cardiff CF24 0YF, U.K. (e-mail: [email protected]). M. Vázquez is with the Instituto de Ciencia de Materiales de Madrid, CSIC, Campus de Cantoblanco, 28049 Madrid, Spain (e-mail: [email protected]. es). M. Rohn is with the Profactor Produktionsforschungs GmbH, A-4407 Steyr/ Gleink, Austria (e-mail: [email protected]). A. M. Merlo is with the Centro Ricerche Fiat, Cabin Systems and HMI Department, Vehicle Development, 50-10043 Orbassano, Italy (e-mail: [email protected]). B. Marquardt is with the ELCAT Medical Systems, 82515 Wolfratshausen, Germany (e-mail: [email protected]). Digital Object Identifier 10.1109/JSEN.2006.874438
I. INTRODUCTION ONTINUOUS noninvasive monitoring of blood pressure in humans is relevant in many medical areas as sleep monitoring or biomechanic feedback. The accurate and nondisturbing monitoring during the large variety of stressors is a challenge that many methods have attempted to solve. As is well known, noninvasive standard methods are based on an inflatable pressure cuff surrounding an arm or a finger. In most cases, they are restricted to a periodic, intermittent estimation of at discrete time intervals, e.g., of 1 min. As a drawback, recurrent inflating and deflating of the cuff stress the patient. Periodic interrupts of the blood flow affect also the physiological state of interest and disturb the quality of sleep. Consequently, many attempts were made to develop noninvasive methods of continuous nature. One approach is to decrease the degree of applied compression to the actual systolic value, evaluating about 15 beats [1]. Another approach is based on the volume clamp principle as described in [2]. Here, pressure is applied to the finger and adjusted in an adaptive way in order to balance the instantaneous value of as a function of time. However, these methods involve inconvenience to the patient due to pressure application, and they tend to affect the physiological state of interest. An attractive approach to avoid inconvenience is to use impedance plethysmography, which reflects volumetric and/or conductivity changes associated with the cardiovascular circle; the registered waveform is used to estimate [3]. Another well-known nondisturbing method takes advantage from the positive correlation between pressure and the pulse wave velocity , i.e., velocity of propagating blood pressure waves [4]. The evaluation of can be based on the determination of the pulse wave transit time , i.e., the time interval between the R-wave of an electrocardiography (ECG) signal and the pulse wave maximum as detectable by means of a plethysmographic sensor at the finger [5]. However, its reliability is restricted due to the fact that a priori complex behavior of is approximated by a single parameter using a simple mathematical model based on rough approximations. This paper describes a novel concept of the nondisturbing monitoring of , which utilizes , and—as a novelty—an additional direct detection of mechanical oscillations of the carotid artery wall. The oscillations are registered using a novel skin curvature sensor (SC-sensor) which consists of a bending sensitive magnetoelastic bilayer partly enclosed by a coil for signal
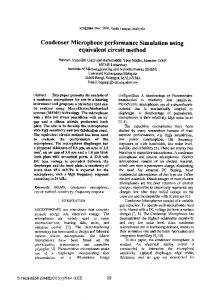
Fig. 1. (a) Setup for the skin curvature sensor including a bilayer and a coil. Change of blood pressure p from its diastolic value p to its systolic value p induces periodic changes of artery radius r from its diastolic value r to its systolic value r . (b) The curvature c of the bilayer increases c r during the systole s of the skin curvature signal s is induced. In addition to s , the respiratory component s is present due to neck p p and a cardiac component s circumference changes. Ultrasonic pictures on the right demonstrate r and r for p and p , respectively.
( = )
(= )
establishment [6] [Fig. 1(a)]. Earlier, the SC-sensor had been successfully applied for the registration of local changes of the skin curvature yielding cardiorespiratory activity on the neck [7], cardiac acceleration on the chest [8], and other physiologic parameters [9]. As an advantage, the SC-sensor and ECG electrodes avoid any inconvenience to the patient because no active application of the pressure is involved and offer two independent parameters, i.e., and oscillations of the carotid artery wall for the estimation of . As an alternative, the assessment of the oscillations of the carotid artery wall could be performed by means of an impedance plethysmography signal which, however, shows a disadvantageous cross sensitivity to changes of tissue conductivity. Furthermore, the SC-sensor allows more local assessment of the curvature than the impedance plethysmography as applied in [3] and, thus, offers a more accurate measure of the oscillations. Within the scope of the introduced concept, is calculated of the using the time shift between the skin curvature signal SC-sensor and the ECG signal . The adaptive processing and offers the oscillations of the carotid artery of wall and a basis for a more reliable monitoring of . II. METHODS A. Applied Model The pulsatile blood flow during the cardiovascular circle is directly connected with the oscillations of between its systolic value and its diastolic value . The corresponding pressure , as well as the absolute values difference and are generally assumed to represent important physiologic parameters. Earlier, the aforementioned model [4], [5] for the continand utilized the pulse wave velocity uous estimation of
(1 / 1 )
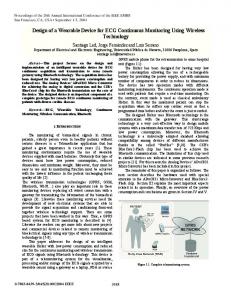
Fig. 2. Application of the skin curvature sensor on the neck over the carotid artery at distance L from the heart. Propagation of blood pressure p waves (systolic value p ) is shown, and v being the propagation time and pulse wave is develocity of blood pressure waves, respectively. The ECG signal s rived according to Einthoven II.
—as an inverse measure for —for the very heterogeneous vessel path between the cardiac region and the finger. Here, we present an advanced model which considers over a more homogeneous path between the heart and the neck, distal arteries not being involved. As already mentioned, in addition to , the model considers a second novel parameter, i.e., periodic of the vessel radius (Fig. 1) as arising during the changes for cardiovascular circle. The model estimates , , and each heart beat. 1) Estimation of Systolic/Diastolic Pressure Change: The model makes use of the SC-sensor applied at the neck above the carotid artery corresponding to Fig. 2. The detection of
KANIUSAS et al.: METHOD FOR CONTINUOUS NONDISTURBING MONITORING OF BLOOD PRESSURE
is based on the fact that a pressure increase according to [10] increase
yields a radius
821
, we get an estimation for rection constant, to give
with
as a arbitrary cor-
(1)
(5)
Here, is the module of volume elasticity of the vessel. Equation (1) assumes axisymmetric and radial deformation of arteries and constant length of the artery; the constant length can be assumed due to very high modulus of elasticity in the longitudinal direction as well as constrained and prestressed state of the arteries in vivo [11]. Furthermore, (1) neglects viscoelastic nature of the wall [12]. As an approximation, we assume that corresponds to the diastolic radius [Fig. 1(a)] which is assumed to be independent from due to lacking inward distension of the arterial wall [11]. Furthermore, we assume that the artery is located on muscle of rigid constant geometry, variations due to respiratory activity being considered through adaptive signal filtering (see corresponding to a sysSection II-B). This means that ( systolic tolic-diastolic radius increase radius) yields a displacement of the skin surface at the sensor’s [ in Fig. 1(b)]. central region by a distance considers “damping” of displacement, The quantity especially due to a possible layer of fat tissue. In approximation, this displacement yields a proportional increase of the sensor of the curvature and, thus, a systolic-diastolic increase sensor signal component which reflects the cardiac activity only. Neglecting several sources of nonlinearity, we can assume yields an increase . Then, (1) can that a radius increase be given as
and can be calculated by solving (5) for The constants . two calibration values of 2) Estimation of Systolic Pressure and Diastolic Pressure: Equation (4) would offer also a basis for a numerical estimation and if we would substitute the difference quotients of through the differential quotients and numerically integrate the resulting equation. However, it is practically impossible to esand more than once within the cardiac cycle, i.e., timate to , and vice versa. within the single transition of from In order to estimate and , we assume—in addition to the aforementioned assumptions of the artery deformation—that the external forces are reduced to stresses acting only in the radial direction of the artery wall and the thickness of the artery wall is much smaller than . Applying the Laplace’s law [12], [13], the circumferential tensile stress is
(6) Here, is the excess pressure, i.e., the radius of the vessel at (zero transmural pressure), is the Young’s is modulus in circumferential direction and , are the Poisson ratios in the longitudinal and circumferential direction. We assume that the artery wall is incompressible, so that . On the other hand, can be expressed by means of the Moens–Kortweg equation [12]
(2) Here, the new constant considers , , as well as individual characteristics of the SC-sensor. . In principle, (2) would offer a basis for the detection of However, as is well known, is constant only for low values [10]. It increases with increasing due to nonlinearly of increasing stiffness of arteries. An attractive possibility to consider this increase is to use the dependence of on which, according to [10], is given through
(7) and the solution for
from (6) is
(8) Furthermore, we assume that yields a small and nearly conwhich does not depend on the value of , stant as assumed also in (1). Then, for the estimation of , (8) yields
(3) where is the blood density which can be assumed to be nearly constant. The values of can be estimated by evaluating the , as shown in Fig. 2. Here, is the corresponding distance between the cardiac region and the neck. The total of this procedure yields an equation which is similar to the Bramwell and Hill equation, to give
(9) For the estimation of , the above assumption yields equalities and and (8) can be rewritten as
(4) Equation (4) shows that can be estimated using the ratio . If we assume to be constant during the cardiovasand cular cycle and apply the transitions
(10) The values of in (9), (10), and in (10) are estimated according to the considerations in Section II-A1, the constant
822
Fig. 3. Signal flow diagram for estimation of pressure difference p s and ECG signal s .
IEEE SENSORS JOURNAL, VOL. 6, NO. 3, JUNE 2006
, systolic blood pressure p , and diastolic blood pressure p , using the skin curvature signal
in (10) is an arbitrary correction constant. The constants and can be calculated by solving (9) for two calibration values of , whereas and can be calculated by solving (10) with (9) and two calibration values of . already estimated B. Model Parameter Calculation Fig. 3 shows the signal flow diagram for the estimations of and (5), (9), (10) from and model parameters in order to calculate , , and . on the neck shows a complex nature. A resGenerally, is induced by the neck circumference piratory component changes due to breathing [7]. In addition, a cardiac component is induced by the blood pressure waves, as discussed above. In the following, we will use for , in accordance with the use of in Section II-A. by means As shown in Fig. 3, was extracted out of of an adaptive highpass filter. The cutoff frequency Hz of the finite impulse response (FIR) filter (length 1082) was adjusted after each pulse beat according to the actual heart derived from the corresponding R-R interval of . rate In addition, a narrow band cardiac component was extracted by means of an adaptive bandpass FIR filter (length 3098, bandwidth 0.2 Hz) whose middle frequency was set to actual after each pulse beat. For the visualization of , an adaptive low. The cutoff pass FIR filter (length 1082) was applied to Hz of the filter was adjusted after each frequency pulse beat, analogous to the adaptive highpass filter. could be detected by means of a second In general, SC-sensor on the neck, in some centimeters distance from the first one. However, the resulting values in our experimental prestudies proved to be small, in the order of a few milliseconds, which impede an effective resolution. Alternatively, could be assessed by a second SC sensor in the cardiac region but this method proved to be problematic due to strong respiratory artefacts. We evaluate the much higher value which arises between the cardiac region and the neck, the distance being of the order of 30 cm for adult persons. For this purpose, we register and determine between corresponding instants of time with respect to the cardiac component . As shown in Fig. 3, the value of was calculated for each heart beat in two different ways. The systolic transit time was
and the estimated as the time delay between the R-wave of maximum of after the R-wave. As a second method, the mean was estimated as a time delay between and transit time using cross correlation in between. In principle, a cross would also offer a basis for the correlation between and estimation of . However, it proved to be difficult to interpret the resulting peaks of the correlation result due to wide band nature of and due to the dicrotic notch in [Fig. 4(b)]. The for (5) and (10) was calculated for each heart parameter beat as root mean square value of within the corresponding heart beat interval (Fig. 3). C. Experimental was recorded by a SC-sensor which was atThe signal tached on the neck over the carotid artery (Fig. 2) by a doublewas derived according sided adhesive tape. The signal and was 500 to Einthoven II. The sample rate of Hz. Subjects were five healthy male test persons. Changes of were induced by veloergometry, i.e., by cyclic load application on a veloergometer. The persons were asked to perform the following exercise sequence: 60 s resting without bicycling, 60 s bicycling with 150 W load, 300 s resting, 60 s bicycling with 150 W load, and 120 s resting. A total of eight experiments were carried out. were established The reference signals for , , and by continuous noninvasive blood pressure monitor PORTAPRES (Finapres Medical Systems) which is based on a volume clamp principle using two inflatable pressure cuffs on fingers (see Section I). The ultrasonic pictures in Fig. 1 were recorded by an echocardiograph (Megas, Esaote Biomedica) in parallel to the veloergometry. III. RESULTS A. General Observations Significant insights into the physiologic interpretation of can be derived from its course over the cardiac cycle. Fig. 4 compares the measured waves of in the aorta and the radial artery with the wave of . It can be observed that the similarity is astonishing between the waves of [Fig. 4(a)] and [Fig. 4(b)]. All important qualitative characteristics of can be found in , i.e., strong wave increase at the beginning of the systole, a
KANIUSAS et al.: METHOD FOR CONTINUOUS NONDISTURBING MONITORING OF BLOOD PRESSURE
823
Fig. 4. Comparison of measured blood pressure p in catheterized patients [14] with cardiac component s (= s) of the skin curvature signal over a single cardiac cycle. (a) Radial wave of p shows a higher amplitude and a more pronounced dicrotic notch (due to reflections and increased artery stiffness [12]) than simultaneously recorded aortic wave of p. (b) Wave of s being more similar to the radial wave.
Fig. 5. Adaptive filtering of skin curvature signal s . (a) Superimposed cardiac and respiratory components oscillating with cardiac rate f and respiratory rate f , respectively. (b) Respiratory component s extracted by an adaptive lowpass filter. (c) Wide band cardiac component s (= s) extracted by an adaptive highpass filter. (d) Narrow band cardiac component s extracted by an adaptive bandpass filter.
little dicrotic notch, and a slow decrease during the diastole. In particular, the radial wave of shows a very strong similarity to the wave of ; the reason for this similarity may be the fact that is assessed over the carotid artery which is not proximal, as given for the radial artery either. These observations on the cardiac wave suggest that the waves of directly represent the waves of . Fig. 5 shows results on the adaptive filtering (Fig. 3) in order . to extract and out of the “mixed” signal exhibits two clearly recognisable As shown in Fig. 5(a),
and the second signal components, the one oscillating with slower one oscillating with the respiratory rate . The output signal [Fig. 5(c)] of the adaptive highpass filter is a wide band signal oscillating with and exhibiting basic and higher cardiac harmonic. The output [Fig. 5(d)] of the adaptive bandpass, in contrast, is a narrow band signal including only the basic cardiac harmonic. In addition, Fig. 5(b) demonstrates for comparison, which was extracted by the adaptive lowpass. It can be observed that the extracted signals , , and match visually well the corresponding components in the orig[Fig. 5(a)]. inal signal The estimation of the model parameters and is for two different demonstrated in Fig. 6 showing and . Comparing Fig. 6(a) mmHg with values of , it can be observed that with increasing Fig. 6(b) the value of increases significantly, whereas decreases. The observed qualitative changes of and for are in full agreement with the model in (4), increasing and with increasing . which implies an increase of both The estimated values of and were investigated with rewere more spect to accuracy and robustness. As expected, irregular due to presence of higher cardiac harmonic within [Fig. 5(c)]. However, were more precise than because the estimation of includes some indirect averaging effects over the cardiac cycle, i.e., the averaging due to the sinusoidal shape of [Fig. 5(d)] and due to the application of the cross correlawas considered to be more appropriate tion function. Thus, for the applied model—compare confirming results for and in Table I—since depends on in a strong and a nonlinear way (5), (9), (10). and Fig. 7 shows the estimated model parameters along with during veloergometry. The recurrent bicy[Fig. 7(a)] and decreases cling temporally increases [Fig. 7(b)]. The observed changes of and for varying [Fig. 7(c)] qualitatively match the observed bevalues of havior of the parameters in Fig. 6. In the given case, the cross and the reference is correlation coefficient between 0.82, whereas the coefficient of 0.83 between and the referis negative, as can be also deduced from Figs. 6 and 7. ence
824
Fig. 6. ECG signal s
IEEE SENSORS JOURNAL, VOL. 6, NO. 3, JUNE 2006
and cardiac component s of skin curvature signal for two different blood pressure changes. (a) p = 47 mmHg and (b) p , an increase of curvature signal deflection s and a decrease of systolic propagation time can be observed.
76 mmHg. For increasing p
=
TABLE I MEAN, ABSOLUTE VALUES OF CROSS CORRELATION COEFFICIENTS
Closer investigations of and over varying showed a hysteretic behavior, as demonstrated in Fig. 8. The values of [Fig. 8(a)] exhibit 10%–20% higher values for an increase of than for its decrease . Furthermore, shows much higher width, revealing the hysteresis loop of for . Both hysteresis indicate higher values of , the tendency of a delayed decrease of stiffness for i.e., shorter and lower for increased levels of stiffness. B. Comparison With The Reference Blood Pressure during veloFig. 7(c) shows the estimated and reference ergometry. For the estimation of , the constants and (5) were calculated using one calibration point at 0 s and the second one at 110 s [marked by circles in Fig. 7(c)]. It can are in good be observed that the reference and estimated agreement, showing nearly identical values at rest, an overestimation during bicycling (Table II) and a high correlation coefficient of about 0.94. It is important to note that the correlation of is improved in comthe model output with the reference
parison with the correlation of the corresponding single model or with the reference (Section III-A), parameters which shows the efficiency of the model. and in comparFig. 9 demonstrates the estimation of ison with the corresponding reference values; the used data set is identical with the data in Fig. 7. The calibration constants and (9) were calculated using one calibration point at 0 s and the second one at 135 s [marked by circles in Fig. 9(b)], whereas and (10) were calculated using calibration points at 0 s and 110 s [marked by circles in Fig. 9(a)]. It can be observed that, in both cases, the estimation fits well the respective reference, the correlation coefficients being 0.93 and 0.92 for and , respectively. Analogous to the estimation of , the are similar at rest while reference and estimated values of an overestimation occurs during bicycling. In the case of , a slight underestimation can be observed (Table II). Table I summarizes mean, absolute values of cross correla. The cortion coefficients for the estimation of , , and relation values between the single parameters and the reference
KANIUSAS et al.: METHOD FOR CONTINUOUS NONDISTURBING MONITORING OF BLOOD PRESSURE
825
Fig. 7. (a) Curvature signal deflection s during veloergometry. (b) Estimated systolic propagation time . (c) Estimated and reference values of pressure showing a cross correlation coefficient around 0.94. difference p
Fig. 8. (a) Hysteretic behavior of estimated systolic propagation time over the reference systolic blood pressure p . The analyzed segments of and p are shown in Fig. 7(b) and Fig. 9(a), respectively, for the time range extending from 373 to 568 s. (b) Corresponding hysteresis loop of curvature signal deflection s from Fig. 7(a) over p .
values indicate that is more decisive for than for (0.9 versus 0.73 for ), whereas for , the reverse is true for (0.42 versus 0.74). This behavior proves the assumption for the is nearly constant, thus (9) yielding diastolic model that shows that only one parameter . The comparison of and seems to be more decisive for the estimation of all three reference signals, which confirms the aforementioned behavior of and (Section III-A). The outputs of the models (9), (10) for seem to be effective when compared the estimation of and to the estimations using the single parameters, the correlation co-
efficients being about 0.86 and 0.92 for and , respectively. (5) shows the The output of the model for the estimation of same effectiveness, as given by the single parameter . are given The absolute estimation errors for , , and in Table II. It can be observed that the mean value of the estimaincreases from 4 mmHg at rest to 24 mmHg tion error for during exercise, the averaged error being about 8 mmHg. Simare ilar errors can be observed for , whereas the errors for negative (mean values) and are much lower, for instance, the average error is only about 2 mmHg.
826
IEEE SENSORS JOURNAL, VOL. 6, NO. 3, JUNE 2006
TABLE II ESTIMATION ERROR OF ABSOLUTE VALUES
Fig. 9. (a) Estimated and reference systolic blood pressure p , showing a mutual cross correlation coefficient of about 0.93. (b) Estimated and reference diastolic blood pressure p with cross correlation coefficient of about 0.92.
IV. DISCUSSION Within this study a simple model (5), (9), (10) was devel. Two physiological oped for the estimation of , , and parameters serve as model input, and . The first parameter has already been shown to be inversely correlated with [4], [5] because of propagating blood pressure waves increases with increasing [15]; however, the hysteretic behavior was not investigated in neither of the above studies. The second , in contrast, is novel in its direct experimental parameter assessment by the use of the novel magnetoelastic SC-sensor. reflects and increases with inThe results show that creasing because the outward distention of the arterial wall increases. It is important to note that the changes of within the cardiac cycle induce a hysteretic behavior of [16], [17]; however, we have been unable to find any objective data on the hysteretic behavior during the long term changes of , for instance, during veloergometry. The results demonstrate the importance of the parameter and for the estimation of and , respectively. The combination of both parameters seems to be effective for the esti, especially in the case of , whereas for mation of and the effectiveness is the same as using the the estimation of single parameter (Table I).
show hysAs a novel finding, both parameters and teretic behavior over the long term changes of , which, obviously, is a disadvantage for the model. The hysteresis may be caused by a physiological phenomenon, i.e., inert changes of the stiffness [proportional to in (1)] of vessels for varying . The stiffness is regulated by strengthening of surrounding the stiffening process plain muscles; during an increase of is in progress, whereas during the subsequent decrease of the value of decreases slowly with some delay, as indicated by studies involving stress [12], [15]. As a result, the values of are shorter for the decrease of because of the delayed decrease of and, thus, the delayed increase of . Analogous, the result for the decrease of because of the lower values of delayed decrease of . In addition, the hysteretic alterations of the viscoelastic artery properties, as shown in [12] and [15], may also have an influence on the observed hysteretic behavior of the parameters. Furthermore, the dynamic viscoelastic properties depend on which was also observed to show a hysteretic behavior. During the increase of , the values of were lower for given than during tend to rethe decrease of . The lower and higher values of duce and increase [12], respectively, this tendency qualitatively supporting the observed hysteretic behavior of and .
KANIUSAS et al.: METHOD FOR CONTINUOUS NONDISTURBING MONITORING OF BLOOD PRESSURE
As shown in Table II, the absolute values of and show much lower estimation errors at rest than during bicycling, i.e., increased stress levels (4 mmHg at rest versus 24 mmHg at exercise). In contrast, the bicycling deteriorates the estimation of to a lesser extent ( 0.8 versus 3.7 mmHg). This difference may be attributed to the fact that the model parameter is only relevant for the estimation of and (5), (10), but not of (9), for is a mechanical quantity which can be unfavorably influenced by the body movements accompanying bicycling. and [Figs. 7(c) and 9(a)] Furthermore, the behavior of shows that during the first period of bicycling the reference and estimated values are in good agreement, as can be expected from the calibration point within this period. However, an interesting phenomena can be observed during the second period of bicyand are higher cling, showing that the estimated values by about 20% than the respective reference values and the corresponding estimated values during the first period of bicycling. This overestimation is obviously due to the increased values of (5), (10) during the second period of the model parameter bicycling, as compared to the first period of bicycling [Fig. 7(a)]; the other model parameter shows similar values at its valleys during both periods of bicycling. The increased values of may be attributed to the facts that during the second period of bicycling 1) already more blood is in peripheral circulation, 2) the tension of the vessel smooth muscles is different due to autonomic control, which alters the stiffness of the artery walls [12], [15], and 3) the artery walls after the first period of bicycling and the subsequent resting period are more relaxed, e.g., due to delayed stress relaxation, and of the vessels is decreased. As decreases, increases by analogy with the discussed interpretation of the hysteretic behavior of . It is very interesting to observe in Figs. 7 and 9 that the valleys are slightly delayed in comparison with of and reference and reference . This observation (and the the peaks of data in Table I) supports the deduced model for the estimation (9), which uses only as parameter, for the valleys of of show an analogous delay as the reference . the estimated for the estimation of can be Analogous, the relevance of derived out of the concomitance of the corresponding peaks (and the data in Table I), which is considered through the model for (10) using both and as parameters. the estimation of The discussed hysteretic behavior of the model parameters as well as the delayed restoration of of the vessels impair , especially during rapid and the estimation of , , and short period changes of stress levels. Furthermore, an accurate by the SC-sensor is restricted to persons with estimation of normal, not excessively adipose neck. In the case of the adipose neck, the changes of the skin curvature due to the cardiac activity for are too low in order to establish a reliable signal ( adipose neck, see Section II-A1). It is important to note that the results of this study might have been biased by 1) the frequency dependence of the artery viscoelastic properties, i.e., the dependence of artery stiffness on [15], 2) the restricted reliability of PORthe instant value of TAPRES, in particular, during increased stress levels [18], [19] as applied in the present study, 3) the strong expected variability of due to the duration variability of the isovolumic ventricles
827
contraction, since the distance is rather short and ECG signal is used as reference [20], and 4) the missing assessment of the in addition to the diastolic to be used for the estimation of systolic which should be preferably used only for the estimation of . Summing up, the proposed approach for the noninvasive continuous monitoring of blood pressure offers the following improvements: 1) Apart from considering the transit time, the model considers changes of vessel radius in a nondisturbing way. 2) The estimated transit time is more reliable than in the case of the distal application of sensors. This is due to a nearly homogenous vessel system over the evaluated relatively short distance heart-neck. The distance does not involve significant local increases of blood pressure, as given by increasing stiffness of distal arteries and pulse wave reflections from distal arteries and arterioles. 3) Application of the developed mathematical model is more appropriate within the distance heart-neck because friction is marginally involved here. The results indicate that the developed method using the novel SC-sensor and standard ECG electrodes can be applied for the qualitative assessment of the blood pressure, i.e., for the blood pressure changes. The quantitative assessment shows low errors at rest, however, during exercise the quantitative assessment is restricted by the hysteretic behavior of the model parameters. The applied sensors are easy to handle and cause minimal inconvenience to the patient, as being relevant for many medical areas where blood pressure changes are of interest, e.g., sleep monitoring, stress ECG registration, biomechanic feedback. REFERENCES [1] K. Belani, M. Ozaki, J. Hynson, T. Hartmann, H. Reyford, J. M. Martino, M. Poliac, and R. Miller, “A new noninvasive method to measure blood pressure,” Anesthesiology, vol. 91, pp. 686–692, 1999. [2] J. Penaz, “Photoelectric measurement of blood pressure, volume, and flow in the finger,” in Proc. Dig. 10th Int. Conf. Medical Biological Engingeering, 1973, p. 104. [3] S. Kolluri, R. Medero, B. Friedman, and L. Hersch, “Continuous, NonInvasive Technique for Measuring Pressure Using Impedance Plethysmography,” U.S. Patent 6 648 828, 2003. [4] D. Franchi, R. Bedini, F. Manfredini, S. Berti, G. Palagi, S. Ghione, and A. Ripoli, “Blood pressure evaluation based on arterial pulse wave velocity,” in Computers in Cardiology. New York: IEEE, 1996, pp. 397–400. [5] D. Barschdorff and M. Erig, “Continuous blood pressure monitoring during stress ECG,” Biomed. Tech., vol. 43, no. 3, pp. 34–39, 1998. [6] H. Pfützner and K. Futschik, “Method for Increased Sensitivity of Magnetoelastic Sensors,” (in German) Patent AT410 373B, 1997. [7] E. Kaniusas, H. Pfützner, L. Mehnen, J. Kosel, G. Varoneckas, A. Alonderis, T. Meydan, M. Vázquez, M. Rohn, A. M. Merlo, and B. Marquardt, “Magnetoelastic skin curvature sensor for biomedical applications,” in Proc. IEEE Sensors Conf., 2004, pp. 1484–1487. [8] E. Kaniusas, L. Mehnen, C. Krell, and H. Pfützner, “A magnetostrictive acceleration sensor for registration of chest wall displacements,” J. Magn. Magn. Mater., vol. 215–216, pp. 776–778, Sep. 2000. [9] T. Klinger, H. Pfützner, P. Schönhuber, K. Hoffmann, and N. Bachl, “Magnetostrictive amorphous sensor for biomedical monitoring,” IEEE Trans. Magn., vol. 28, no. 5, pp. 2400–2402, Sep. 1992. [10] W. R. Milnor, Hemodynamics. Baltimore, MD: Williams & Wilkins, 1989, Sec. Edition. [11] C. R. Almeder, “Hydrodynamic Modeling and Simulation of the Human Arterial Blood Flow,” Ph.D. dissertation, Inst. Anal. Sci. Comput., Vienna Univ. Technol., Vienna, Austria, 1999.
828
IEEE SENSORS JOURNAL, VOL. 6, NO. 3, JUNE 2006
[12] T. J. Pedley, The Fluid Mechanics of Large Blood Vessels. Cambridge, U.K.: Cambridge Univ. Press, 1980. [13] M. Wibmer, “One-Dimensional Simulation of Arterial Blood Flow With Applications,” Ph.D. dissertation, Inst. Anal. Sci. Comput., Vienna Univ. Technol., Vienna, Austria, 2004. [14] C. H. Chen, E. Nevo, B. Fetics, P. H. Pak, F. C. Yin, W. L. Maughan, and D. A. Kass, “Estimation of central aortic pressure waveform by mathematical transformation of radial tonometry pressure, validation of generalized transfer function,” Circulation, vol. 95, no. 7, pp. 1827–1836, 1997. [15] B. Gribbin, A. Steptoe, and P. Sleight, “Pulse wave velocity as a measure of blood pressure change,” Psychophysiology, vol. 13, no. 1, pp. 86–90, 1976. [16] Y. W. Shau, C. L. Wang, J. Y. Shieh, and T. C. Hsu, “Noninvasive assessment of the viscoelasticity of peripheral arteries,” Ultrasound Med. Biol., vol. 25, no. 9, pp. 1377–1388, 1999. [17] M. Sugawara, K. Niki, H. Furuhata, S. Ohnishi, and S. Suzuki, “Relationship between the pressure and diameter of the carotid artery in humans,” Heart Vessels, vol. 15, pp. 49–51, 2000. [18] T. Kurki, N. T. Smith, N. Head, H. Dec-Silver, and A. Quinn, “Noninvasive continuous blood pressure measurement from the finger: optimal measurement conditions and factors affecting reliability,” J. Clin. Monit., vol. 3, no. 1, pp. 6–13, 1987. [19] S. Eckert and D. Horstkotte, “Comparison of Portapres noninvasive blood pressure measurement in the finger with intra-aortic pressure measurement during incremental bicycle exercise,” Blood Press. Monit., vol. 7, no. 3, pp. 179–183, 2002. [20] L. A. Geddes, M. Voelz, S. James, and D. Reiner, “Pulse arrival time as a method of obtaining systolic and diastolic blood pressure indirectly,” Med. Biol. Eng. Comput., vol. 19, no. 5, pp. 671–672, 1981.
Eugenijus Kaniusas was born in Siauliai, Lithuania, in 1972. He received the degree in control and automation engineering and the Dr.Tech. degree in auscultation and processing of acoustic sounds from the Faculty of Electrical Engineering and Information Technology, Vienna University of Technology (VUT), Vienna, Austria, in 1997 and 2001, respectively. Since 1997, he has been with the Institute of Fundamentals and Theory of Electrical Engineering, Bioelectricity and Magnetism Lab, VUT. His research interests include electric, acoustic, optic, and magnetoelastic sensors for biomedical applications, signal processing, as well as digital and analogous hardware concepts for signal acquisition.
Helmut Pfützner (M’79) was born in Salzburg, Austria. He received the Ph.D. degree from Vienna University of Technology (VUT), Vienna, Austria, and the “venia docendi” for applied fundamentals of electrical engineering in 1979 and 1983, respectively. Since 1972, he has been with the Institute of Fundamentals and Theory of Electrical Engineering, VUT, where he has been Head of the Institute’s Bioelectricity and Magnetism Laboratory since 1985. He is engaged in research, consulting, and teaching in several fields of biophysics and magnetism.
Lars Mehnen was born in Munich, Germany, in 1967. He received the Dr.Tech. degree from the Faculty of Computer Science, Vienna University of Technology, Vienna, Austria, in 1997 and 2002, respectively. His research interests include electric and magnetoelastic sensors for biomedical applications, simulations, evolutionary strategies/optimization methods, as well as digital hardware control concepts.
Jürgen Kosel was born in Wels, Austria, in 1977. He received the Dipl.Ing. degree from the Vienna University of Technology (VUT), Vienna, Austria, in 2002. Since 2002, he has been with the Institute of Fundamentals and Theory of Electrical Engineering, VUT. His research interests include magnetostrictive sensors for biomedical and automotive applications.
Juan Carlos Téllez-Blanco was born in Havana, Cuba, in 1964. He graduated from the Faculty of Physics, Havana University, in 1990, and received the Dr.Tech. degree from the Institute of Experimental Physics, Vienna University of Technology, Vienna, Austria, in 2000. His research interests include technical physics and solid state physics.
Giedrius Varoneckas is a Professor, Chief Research Associate, and Head of the Department of Psychosomatic Disturbances and Sleep Research, Institute of Psychophysiology and Rehabilitation, Kaunas University of Medicine, Palanga, Lithuania. His research activities cover the psychophysiology of cardiovascular system, sleep, application of computerized heart rate variability analysis, operator functional state assessment, and the treatment of sleep disorders.
Audrius Alonderis is aJunior Researcher and Head of the Sleep Research Laboratory, Department of Psychosomatic Disturbances and Sleep Research, Institute of Psychophysiology and Rehabilitation, Kaunas University of Medicine, Palanga, Lithuania. His main research activities are in the fields of sleep research and autonomous control of the cardiovascular function, as well as the evaluation of the psychoemotional status.
Turgut Meydan, photograph and biography not available at the time of publication.
Manuel Vázquez born in Madrid, Spain. He received the Ph.D. degree in Physics from the University of Madrid in 1980. He has been a Professor of Research at the Institute for Material Sciences of Madrid, Spanish Council for Research, since 1996. The topics of his scientific research include amorphopus and nanocrysalline solids, micro- and nanowires, magnetoelasticity and magnetostriction, magnetization reversal, micromagnetism.
Michael Rohn was born in 1968. After studying technical physics at the University of Linz, Linz, Austria, and environment protection technologies at the Vienna University of Technology, Vienna, Austria, he began to focus on physical measurement techniques in the field of radiation protection. Since 1999, he has been working in the field of nanoscale metrology at Profactor Produktionsforschungs GmbH, Steyr/Gleink, Austria.
Alberto M. Merlo started his professional activity at the Centro Ricerche FIAT, Italy, in 1993. Since 2004, he has been working in the field of car interior design, particularly with the application of advanced microsensors for the monitoring of the cabin environment, with a special focus on driver status and passenger comfort.
Bernd Marquardt studied telecommunications at the University College of Munich, Munich, Germany. Since 1981, he has been the General Manager and Companion of ELCAT Medical Systems GmbH, which is a medium-sized company developing and producing various electronic devices for vascular diagnostics and other medical fields.