We describe the application of genetic algorithms in model-based image ... objective is to achieve robust performance for images of clinical (poor) quality using a .... employing a parametric cubic spline which interpolates these control points.
Image and Vision Computing, vol 10 no 5, June, 1992, pp 295-300.
Model-Based Image Interpretation Using Genetic Algorithms A. Hill and C. J. Taylor Department of Medical Biophysics, University of Manchester, Oxford Road, Manchester M13 9PT.
Abstract We describe the application of genetic algorithms in model-based image interpretation. The delineation of left ventricular boundaries in apical 4-chamber echocardiograms is used as an illustrative exemplar. The suitability of genetic algorithms for the model/obĆ jective-function/search procedure is presented.
Keywords : Genetic Algorithms, Model-Based Vision, Flexible Templates.
1 Introduction In model-based vision we generally wish to find the model-to-image transformation which explains some observed image. For example, for a 2D image of a known, rigid 3D object, the goal is to find the parameters (position and orientation) of the model which best explain the projection observed in the image. In general, additional parameters are required to account for variability in the object itself. A common approach to finding the parameter values is to extract image primitives and solve the combinatorial problem of establishing a correspondence between these and model primitives1. This assumes that a robust mechanism exists for extracting well-defined primitives, an assumption which often does not hold, particularly in fields such as medical image interpretation. An alternative is to search through the space of possible parameter values, projectĆ ing model instances back into the image until one which is consistent with the observed image is found. Such an approach has often been applied starting from one or more apĆ proximate solutions but the initial approximations can be difficult to find when primitive extraction is problematic. In the absence of an initial approximation or cue, the alternaĆ tive of a blind" search through the parameter space seems unattractive because the search space can be huge (2 57 possible states in the example we present below), howĆ ever, the problem is well-matched to a class of optimisation methods known as Genetic Algorithms (GAs)2,3,4 which can robustly find good solutions in large search spaces using very few trials. Given an objective function, f, which measures the evidential supĆ port for any particular projection into the image of the model, a GA search can find a set of parameters which provide a good explanation (or interpretation) of the image. Our results demonstrate the feasibility of this approach.
2 The Exemplar We have evaluated the method using ultrasound images of the heart (apical 4-chamber echocardiograms). A typical example is shown in figure 1.a. The problem we address is 1
Image and Vision Computing, vol 10 no 5, June, 1992, pp 295-300.
)��) $� !$��)�#� )�� �$*#��'. $� )�� !��) +�#)'��!� ���� �( (�$,# �# ���*'� ���� ��� ��" �( )$ %'$+��� &*�#)�)�)�+� �#�$'"�)�$# �$#��'#�#� �� �*#�)�$#� �. �#�!.(�#� )�� "$)�$# $� )�� �� �$*#��'. $+�' � )�"� (�&*�#�� $� �"���(� ��� ���)*'�( $� ���$��'��$�'�"( ,���� "� � )��( � ���!!�#��#� �-�"%!�' �'� S S S S
Drop-out $� )�� ���$ �'$" ($"� (��)�$#( $� )�� !��) +�#)'��*!�' ,�!!� �$#(���'��!� ��$!$����! +�'��)�$# �# �� (�/�� (��%� �#� %$(�)�$#� ���!*(�$# $� )�� �� �$*#��'. �. $)��' ()'*�)*'�( �# )�� ���')� �$�(� �#� �')����)(�
���'� ��+� ���# "�#. �))�"%)( )$ �*)$"�)� )�� ��!�#��)�$# $� )�� �� � �*) #��'!. �!! '�!. $# ($"� $%�'�)$' �#)�'+�#)�$#� �+�# ($� (*�� (.()�"( %�'�$'" *#'�!���!.� �*' $����)�+� �( )$ �����+� '$�*() %�'�$'"�#�� �$' �"���( $� �!�#���! �%$$'� &*�!�). *(�#� � �$"%!�)�!. �*)$"�)�� �%%'$���� ��� ,$' ,� %'�(�#) ��'� �( �$#��'#�� ,�)� )�� �#)�'0 %'�)�)�$# $� (�#�!� �'�"�( $#!. �'$" )�� ���$��'��$�'�" (�&*�#��� �*)*'� �$�! $� )��( ,$' �( )$ �"%'$+� *%$# )�� '�(*!)( %'�(�#)�� �# (��)�$#( �#� � �. �#)��'�)�#� )�"%$'�! �#�$'"�)�$# �'$" )�� (�&*�#�� $� �"���( �*'�#� )�� �#)�'%'�)�)�$# %'$��((� �%��� "�)'�! +�!+� (�%)*" !��) �)'�*"
Figure 1.a : An apical 4-chamber echocardiogram
Figure 1.b : Associated LV boundary
� �� �� � � � � ���� � ( �"%!$. "����#�("( �#�!$�$*( )$ )�$(� �#+$!+�� �# #�)*'�! (�!��)�$# )$ �$#�*�) � (��'�� )�'$*�� � ��+�# %�'�"�)�' (%��� �$' )�� "�-�"*"�"�#�"*" $� ($"� $����)�+� �*#�)�$#� ��� "��# ���)*'�( $� )�� �%%'$��� �'� �( �$!!$,( S %$�#) �# )�� (��'�� (%��� �( �#�$��� �( � chromosome� S population $� N ��'$"$($"�(�(��'�� %$�#)( �( "��#)��#��� '�)��' )��# � (�#�!� %$�#)� S ��, %$�#)( �# )�� (��'�� (%��� �'� ��#�'�)�� �. %'$����!�()���!!. �$"��#�#� �-�()�#� ($!*)�$#(� S �%)�"�! ($!*)�$#( �'� evolved �. �)�'�)�+�!. %'$�*��#� #�, generations $� ��'$"$($"�( *(�#� � selective breeding ()'�)��. ��(�� $# )�� '�!�)�+� +�!*�( $� )�� $����)�+� �*#�)�$# �$' )�� �����'�#) "�"��'( $� )�� %$%*!�)�$#� �
Image and Vision Computing, vol 10 no 5, June, 1992, pp 295-300.
Under the right circumstances such methods have been shown to converge to good solutions remarkably rapidly and have the advantage that the rate of convergence varies in accordance with the complexity of the search space, thus achieving robust performĆ ance over a range of conditions. 3.1 Representation and Evaluation of Solutions A solution x + (x 1, x 2, .., x n) is encoded as a string of genes to form a chromosome repreĆ senting an individual. Each gene can take one of several values or alleles. Holland2 showed that long chromosomes with few alleles per gene are preferable to shorter chroĆ mosomes with many alleles per gene. This implies that the optimal case is binary alleles. Consequently, in many applications the chromosomes are simply bit strings. An objective/utility function, f, is supplied which can decode the chromosome and assign a fitness value to the individual the chromosome represents. In many applications the fitness value is simply the objective function evaluated at the point in the search space represented by the chromosome, f (x). 3.2 The Genetic Operators Given a population of chromosomes the genetic operators crossover and mutation can be applied. Crossover takes two parent chromosomes, cuts them at some random gene/ bit position and recombines the opposing sections to create two children:
ÂÂÂÂÂÂÂÂÂ ÁÁÁ ÂÂÂÂÂÂÂ ÂÂÂÂÂÂÂÂÂÁÁÁ ÂÂÂÂÂÂÂ ÁÁÁÁÁÁÁÁÁÁÁÁ ÂÂÂÂÂÂÂÂÂ ÂÂÂ ÁÁÁÁÁÁÁ ÂÂÂÂÂÂÂ ÂÂÂÂÂÂÂÂÂ ÁÁÁ ÂÂÂÂÂÂÂ ÁÁÁÁÁÁÁÁÁ ÂÂÂ ÁÁÁÁÁÁÁ ÁÁÁÁÁÁÁÁÁÂÂÂ ÁÁÁÁÁÁÁ ÁÁÁÁÁÁÁÁÁÂÂÂ ÁÁÁÁÁÁÁ
Mutation is a background operator which selects a gene at random on a given indiĆ vidual and mutates the allele for that gene (for bit strings the bit is complemented). MuĆ tation is used to reintroduce alleles which may have been lost from the population for purely stochastic reasons. 3.3 Iterative Solution The search for an optimal solution starts with a randomly generated population of chroĆ mosomes; an iterative procedure is used to conduct the search. For each iteration a proĆ cess of selection from the current generation of chromosomes is followed by application of the genetic operators. Selection allocates a number of trials to each individual accordĆ ing to its relative fitness value f ińf, f + 1 N
N
ȍ fi. The fitter an individual the more trials it
i+1
will be allocated and vice versa. Average individuals are allocated only one trial. A trial is conducted by applying the genetic operators (in particular crossover) to selected indiĆ viduals to produce a new generation of chromosomes. The algorithm progresses by allocating, at each iteration, ever more trials to the high performance (better than average) areas of the search space under the assumption that these areas are associated with short sub-sections of chromosomes (hyperplanes/scheĆ mata/building blocks) which can be recombined using the random cut-and-mix of crossover to generate even better solutions. 3
Image and Vision Computing, vol 10 no 5, June, 1992, pp 295-300.
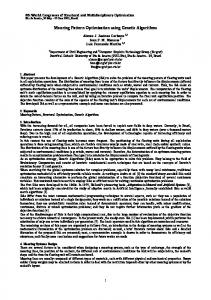
4 The Model-Based Approach The approach we adopt is to create a model of the LV which captures the variability in LV shape and allows missing parts of the boundary within the image to be inferred. The model is instantiated by choosing values for a set of 6 shape parameters (a, b, d 1, d 2,d 3, d 4) (see figure 2) and 4 transformation parameters (r, q, s, f). An objecĆ tive function, derived by considering edge evidence within the image along profiles conĆ structed perpendicular to the candidate boundary, is employed to evaluate the degree to which image evidence supports any particular instantiation of the model. 1
Points used for spline.
δ3
−α
α
0
δ2
Model Parameters : α = width/height ratio (0.5) β = mitral valve relative to septum (0) δ1 = movement of mitral valve (−0.1) δ2 = movement of septum (0) δ3 = outside wall with apex (0.5) δ4 = outside wall with mitral valve (0.5) δ4
δ1 −1
β
Figure 2 : The model for the left ventricle. 4.1 The Model LV shape (see figure 2) is defined as follows : The parametera controls the width/height ratio. The co-ordinate of a control point representing the apex is thus given by (* a, 1) and the control point representing the attachment of the mitral valve to the septum (see figure 2.a) by (* a, * 1).The angle of the mitral valve to the septum is governed by the parameter b which defines a vertical displacement from the position(a, * 1)i.e. a conĆ trol point is positioned at (a, * 1 ) b).The movement of the mitral valve is governed by the parameter d 1 which describes the perpendicular displacement of a control point lying midway between the control points (* a, * 1) and (a, * 1 ) b).In a similar mannerd 2 governs the position of the control point at the centre of the septum. The two remaining parameters d 3, d 4 dictate the position of the control points which modify the shape of the outside wall of the LV. d 3a defines a horizontal displacement from the conĆ trol point (* a, 1) and d 4 defines a vertical displacement from the control point (a, * 1 ) b). For any instantiation of the shape model a continuous ventricular boundary can be obtained by first generating the control points in the manner described above and then employing a parametric cubic spline which interpolates these control points. Any number of points on the continuous boundary can be selected via the cubic spline. The translation, scale and orientation of the model co-ordinate system with respect to the 4
Image and Vision Computing, vol 10 no 5, June, 1992, pp 295-300.
image are defined by (r, q), s, frespectively. The translation is given in polar co-ordiĆ nates because the echocardiogram is a sector of a circle. All 10 parameters a, b, d 1..4, r, q, s, f are quantised appropriately - see table 1 (note that r and s are dimenĆ sionless [0,1] variables i.e. for a square image of dimension L the actual values of r and s employed are rL and sL respectively). 4.2 The Objective Function To perform the experiments described below we have used a simple and rather ad-hoc objective function. A number of points, P, on the continuous boundary of the candidate ventricle are selected for processing, P + [P rĂ sĂ (1 ) a)] where [] indicates rounding to the nearest integer and P r governs the density of points. Using P r + 200 gives typically 30-100 points on the boundary. For each of these points a grey level profile perpendicuĆ lar to the boundary at that point is extracted. For each profile the position (p i, p min v p i v p max)and strength (g i) of the largest intensity step along the profile are recorded. Each profile is of length 20 pixels (p min + * 16, Ă p max + 4). The objective function is then given by : P
f+ 1 1 Ǹg P
ȍNJŤ i+1
Ť Ť
gi pi p min ) g * 1
ŤNj
P
Ą Ą whereĄ Ą g + 1 P
ȍ
gi
i+1
When we use the objective function to evaluate instantiations of the ventricle model we seek to minimise f, thus favouring solutions with strong edges ( g large) of equal magnitude ( Ť g ińg * 1 Ť ³ 0) located close to the boundary position predicted by the model ( p i ³ 0).
5 Implementation of Genetic Algorithm 5.1 Representation As suggested by Fitzpatrick et al7, the parameters of the model are encoded as unsigned gray-code binary integers. The number of bits encoding each parameter is given in table 1. For the translation vector (r, q)it has proved useful to inter-leave the bits from each variable to form a single position vector variable with alleles 0..3, viz : q1 q2 q3 q4 q5 q6 q7
+
(rq) 1 (rq) 2 (rq) 3 (rq) 4 (rq) 5 (rq) 6 (rq) 7
r1 r2 r3 r4 r5 r6 r7
0 v (rq) i v 3Ă ôĂ i
Inter-leaving the translation bits in this manner reduces the number of lethal" offĆ spring when crossover is applied to individuals adapted to different chambers within the echocardiogram i.e. alternative optima (see section 7). The high order bits of the (r, q) parameters form an important schema (building block) and encoding (r, q) in this manner ensures that crossover has only a small probability of disrupting the relevant hyĆ perplanes. 5
Image and Vision Computing, vol 10 no 5, June, 1992, pp 295-300.
Symbol
Min
Max
Bits
Symbol
Min
Max
Bits
2 q 3 f a
0.2 p/3 0.13 -p/6 0.35
0.475 2p/3 0.3 p/6 0.6
7 7 6 6 6
b d1 d� �� ��
-0.1 -0.5 0 0.25 0.1
0.1 0 0.35 0.75 1.0
5 5 5 5 5
Table 1 : Quantisation of model parameters. 5.2 Search Parameters We have employed the standard" GA values (see Grefenstette8) of population size (N) = 50 and crossover rate (C) = 0.6 together with a mutation rate (M) of 0.005. In general, a fixed maximum number of objective function evaluations were allowed and this was set at 5000. The problem of unbiased trial allocation is discussed by Baker9. We have employed the Remainder Stochastic Independent Sampling (RSIS) algorithm as our seĆ lection strategy. The initial population from which the search progresses is purely ranĆ dom - no seeding of the first population is performed.
6 Results We have acquired approximately 40 apical 4-chamber echocardiogram time sequences from several sources. All the images are of dimension256 2and pre-processed using a 3D grey-level morphological closing filter of dimensions 5 5 3 (x, y and t respectĆ ively) in order to remove unwanted noise while retaining the major anatomical features. Individual frames from these filtered sequences were selected for processing. The images exhibit all of the characteristics described in section 2. We have conducted two experimental studies; a comparison of different methods of optimisation (GAs and Simulated Annealing (SA)3,10) and a comparison of the performance of the modelbased interpretation scheme described here with interpretations derived by an expert (manually drawn LV boundaries generated by a clinician). We selected SA as a comĆ parative method of optimisation because our initial experiments suggested that more traditional search algorithms (such as gradient descent) were prone to entrapment by local minima. SA has been employed extensively with considerable success in the case of multi-modal functions. For the first experiment a single image from each of five sequences was selected. These images were chosen on the basis that they were both difficult for an expert to inĆ terpret and also included characteristics which made the search space as difficult as possible (multiple optima, atypical LV shape). We applied both GA and SA to minimise the objective function described in section 4.2 for each of the five images and recorded the best objective function value located for each of 20 applications. Both methods of optimisation were allowed a maximum of 5000 function evaluations per application and employed random starting positions for the search. Table 2 shows the two-tailed t-test results for the 20 sample distributions. It is clear from this table that, for the particular objective function, data and implementations described here, the performance of GA 6
Image and Vision Computing, vol 10 no 5, June, 1992, pp 295-300.
is significantly better than SA. For both GA and SA the CPU time required to process each image on a SUN SPARCstation 2 was approximately 30 seconds. ��'( �"��� 1 2 3 4 5
��#�( � �!�$& (�" mean f s of f
� ")!�(�� �##��! #� mean f s of f
0.1804 0.1184 0.1460 0.1001 0.1223
0.1905 0.1243 0.1521 0.1039 0.1282
0.0165 0.00551 0.00685 0.00477 0.00891
0.0129 0.00447 0.00646 0.00447 0.00805
(�(�'( t signif. 2.2 3.7 2.9 2.6 2.2
0.037 0.001 0.006 0.013 0.034
Table 2 : Comparison of different methods of optimisation. For the second experiment we employed ten time sequences with boundaries drawn by an expert for the end systole and diastole frames i.e. two images per sequence giving a test suite of 20 images. It should be noted that several of these sequences were difficult to interpret, even for an expert. The images were interpreted using the model-based approach described here and the resulting LV boundaries compared with the expertgenerated boundaries. The results are shown in table 3. In this table D is the mean disĆ tance between boundaries and is given by 1 P
P
ȍ Ǹ(ai,x * bj,x)2 ) (ai,y * bj,y)2 where
i+1
b j + (b j,x, b j,y) is the point on the expert boundary closest to the point on the GA generĆ ated boundary a i. These results were produced by applying the GA search to each image once only and always from the same random set of starting points/chromosomes. A limit of 5000 function evaluations was again employed. �)"��& $� �"���' * (� # ��+� + �
�
�&�� 12 14 17
��+ �� ��( 6 11 18
��+ � �(� 8 13 17
�$� $� "���' �$& D * (� # + % +�!'[ 3 �+ � � 14 �+ � �� 18 �+ � �
Table 3 : Comparison of model-based approach with expert. A visual" comparison of the results revealed that the model-based approach failed to locate two out of the twenty left ventricles and obtained a less than acceptable interpretation for one other. The first two failures" occur due to multiple plausible inĆ terpretations within the image and the third because of an abnormal ventricular shape (an aneurism). These incorrect interpretations are highlighted in the last row of table 3. Of the remaining 17 images, very plausible interpretations were obtained comparing favourably with those generated by an expert. To demonstrate the performance of the model-based approach when compared with the expert generated boundaries we presĆ ent figures (3.a, 3.b) and (4.a, 4.b) which show the expert boundaries (3.a, 4.a) and the boundaries generated by the model-based approach (3.b, 4.b) for two images in the test suite. [ The mean absolute pixel height and width of the expert boundaries are 100 and 54 respectiveĆ ly.
7
Image and Vision Computing, vol 10 no 5, June, 1992, pp 295-300.
Figure 3.a : Expert boundary.
Figure 3.b : Model-based boundary.
Figure 4.a : Expert boundary.
Figure 4.b : Model-based boundary.
7 Extensions - Niches and Species If the GA could be employed to extract multiple optima, the functionality of the method would be greatly enhanced. The purpose of the search would no longer be to locate the single model instantiation most likely to be the LV in the current image, but would be to extract a handful of strong, ranked candidates for the LV. The problem of locating multiple optima when using GAs is discussed by Goldberg4. The approach adopted is to reduce the number of individuals in over-crowded areas of the search space by modĆ ifying their function values. The major problem with this approach is how to decide how close individuals are to each other in order to determine crowding factors with which to modify the function vaĆ lues. We have implemented a crowding strategy which defines the closeness of individĆ uals simply to be the 2D Euclidian distance separating the centres of the candidate venĆ tricles within the image. The crowding factor (F) for any individual is simply the number 8
Image and Vision Computing, vol 10 no 5, June, 1992, pp 295-300.
of individuals that lie within a disc of a certain radius to the individual being considered. The modified function value is then given by f(1 - F/N) (when maximising) i.e. the greater the crowding, the worse the modified function values. A modified mating stratĆ egy has also been implemented in which close individuals are favoured as mates over distant individuals. This strategy has been found to be successful in maintaining separate sub-populations of individuals within the image which represent various candidate LVs. An example of applying the method is shown in figure 5. The groups are listed in order of size, group 1 containing the largest number of individuals. The species these groups represent were generated using N = 100, C = 0.5, M = 0.005 and 50 generations. The sub-populations are stable and persist for many hundreds of generations. Upon inspection of figure 5 it is clear that all of the extracted solutions are plausible. The strongest solution is the left ventricle itself. Next is the right ventricle and finally a subpart of the left ventricle. This last interpretation arises due to the imaging of tissue toĆ wards the apex of the ventricle, giving rise to a false apex".
group 1 group 2 group 3 Figure 5.a : Original frame.
Figure 5.b : Species adapted to different chambers.
8 Conclusions One of the major attributes of the model-based approach is the ability to correctly inĆ terpret incomplete and/or noisy image data by constraining all possible interpretations using knowledge represented by a model. In order for this process to be successful it may be necessary to search a high-dimensional, non-linear, multi-modal and noisy search space. The chosen exemplar exhibits many of the problems frequently encountered within image interpretation (see section 2). The combination of a shape model which guarantees the feasibility of solutions, a naive objective function and a powerful search technique has been shown to yield very promising results. The two features of GAs which we believe to be important for model-based object recognition are : 9
Image and Vision Computing, vol 10 no 5, June, 1992, pp 295-300.
S The ability to generate good (although not necessarily optimal) solutions in a rapid fashion. For the echocardiogram exemplar employed here we have found that good solutions can be generated using just 5000 function evaluĆ ations. S The ability to extract multiple plausible interpretations. The extension of the basic algorithm to incorporate many simultaneous local optimisations (sepĆ arate species) enables a more comprehensive search of the function paraĆ meter space at the cost of more function evaluations. In our experiments we found that a population size of 100 (compared with 50 in the non-speciated, one shot" version) was required, resulting in twice as many function evaluĆ ations. The model-based approach described here would benefit greatly from a more genĆ eric approach to both model building (for generating candidate solutions) and evidenĆ tial support mechanisms (the objective function). We are addressing both of these probĆ lems in our current work and progress in the former has already been made11. The sophistication of the objective function could be improved significantly by incorporating terms within the objective function which, rather than being ad-hoc as in section 4.2, are learned during the training phase of the model-building process.
9 Acknowledgements Dr D. C. Beeton of Wythenshawe Hospital, Manchester for supplying some of the echoĆ cardiograms and Dr. K. Phadka of City General Hospital, Stoke-on-Trent for both supplying and labelling other sequences. This work was funded as part of IED project 1660. Dr. Hill is seconded from Active Memory Technology Ltd.
10 References 1 Grimson W. E. L. Object Recognition by Computer : The Role of Geometric Constraints, MIT Press, Cambridge, Massachusetts, USA (1990). 2 Holland J. H. Adaptation in Natural and Artificial Systems, University of Michegan Press, Ann Arbor, USA (1975). 3 Davis L. Genetic Algorithms and Simulated Annealing, Pitman, London, England (1987). 4 Goldberg D. E. Genetic Algorithms in Search, Optimisation and Machine Learning, Addison-Wesley (1989). 5 Chu C. H., Delp E. J., Buda A. J. `Detecting Left Ventricular Endocardial and EpiĆ cardial Boundaries by Digital Two-Dimensional Echocardiography', IEEE Trans. on Medical Imaging. Vol 7 No 2 (1988) pp 81-90. 6 Yamada H., Yamamoto K. `Recognition of Echocardiograms by a Dynamic ProgramĆ ming Matching Method', Pattern Recognition. Vol 24 No 2 (1991) pp 147-155. 7 Fitzpatrick J. M., Grefenstette J. J., Van Gucht D. `Image Registration by Genetic Search', Proc. IEEE Southeastcon, Louisville. (1984) pp 460-464. 8 Grefenstette J. J. `Optimisation of Control Parameters for Genetic Algorithms', IEEE Trans. on Systems, Man and Cybernetics. Vol 16 No 1 (1986) pp 122-128. 10
Image and Vision Computing, vol 10 no 5, June, 1992, pp 295-300.
9 Baker J. E. `Reducing Bias and Inefficiency in the Selection Algorithm', Proc. of the 2nd Int. Conf. on Genetic Algorithms, Hillsdale, NJ, USA. (1987) pp 14-21. 10 Kirkpatrick S., Gelatt C., Vecchi M.P. `Optimisation by Simulated Annealing', Science. Vol 220 (1983) pp 671-680. 11 Cootes T. F., Cooper D. H., Taylor C. J., Graham J. `A Trainable Method of ParametĆ ric Shape Description', Proc. British Machine Vision Conference. (1991) pp 54-62.
11