cU.S. Army RDECOM CERDEC Night Vision & Electronic Sensors Directorate,. Fort Belvoir, Virginia, USA 22060;. dDept. Of Electrical Engineering, University of ...
Multiple Kernel Learning For Explosive Hazard Detection in Forward-Looking Ground-Penetrating Radar Timothy C. Havensa, Kevin Stonea, Derek T. Andersonb, James M. Kellera, K.C. Hoa, Tuan T. Tonc, David C. Wongc, and Mehrdad Soumekhd a Dept. of Electrical and Computer Engineering, University of Missouri, Columbia, MO, USA 65211; b Dept. of Electrical and Computer Engineering, Mississippi State University, Starksville, MS, USA 39762; c U.S. Army RDECOM CERDEC Night Vision & Electronic Sensors Directorate, Fort Belvoir, Virginia, USA 22060; d Dept. Of Electrical Engineering, University of New York at Buffalo, Amherst, NY, USA 14260 ABSTRACT This paper proposes an effective anomaly detection algorithm for forward-looking ground-penetrating radar (FLGPR). The challenges in detecting explosive hazards with FLGPR are that there are multiple types of targets buried at different depths in a highly-cluttered environment. A wide array of target and clutter signatures exist, which makes classifier design difficult. Recent work in this application has focused on fusing the classifier results from multiple frequency subband images. Each sub-band classifier is trained on suites of image features, such as histogram of oriented gradients (HOG) and local binary patterns (LBP). This prior work fused the sub-band classifiers by, first, choosing the top-ranked feature at each frequency sub-band in the training data and then accumulating the sub-band results in a confidence map. We extend this idea by employing multiple kernel learning (MKL) for feature-level fusion. MKL fuses multiple sources of information and/or kernels by learning the weights of a convex combination of kernel matrices. With this method, we are able to utilize an entire suite of features for anomaly detection, not just the top-ranked feature. Using FLGPR data collected at a US Army test site, we show that classifiers trained using MKL show better explosive hazard detection capabilities than single-kernel methods. Keywords: Forward-looking explosive hazards detection, ground-penetrating radar, false alarm rejection, multiple kernel learning, feature-level fusion
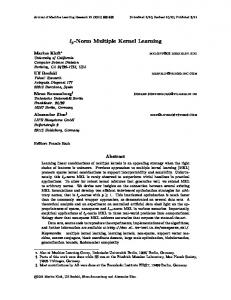
1. INTRODUCTION The threat of explosive hazards continues to loom heavily over American troops abroad. IED attacks in Afghanistan continue to increase; 388 US soldiers were wounded in September 2010, compared to 179 in September 2009 and 18 in September 2008.1 Hence, remediation of the threat of explosive hazards is an important and pertinent goal. There has been much work done on developing systems that detect these hazards, including systems based on GPR, infrared (IR) cameras, and acoustic technologies.2-4 Both handheld and vehicle-mounted GPR-based systems have been examined in recent research and much progress has been made in improving detection capabilities.5,6 FLGPR is an especially attractive technology because of its ability to detect hazards before they are physically below the detection platform; effective standoff distance can range from a few to tens of meters. FLGPR has been applied to the detection of sideattack mines7, and mines in general.8,9 A drawback to FLGPR-based systems is that they are not only sensitive to objects of interest, but also to other objects, both above and below the ground. This can result in an excessive number of false alarms (FA). Figure 1 illustrates our proposed MKL explosive hazard detection algorithm. View (a) shows that the radar data is beamfored at the full bandwidth. We then apply a size-contrast filter to the radar image; detecting local maxima in the size-contrast filtered image with a prescreener. This operation is described in Section 2. Shown in view (b) is the feature extraction, described in detail in Section 3. At each prescreener alarm, we extract a grid of cells (small image regions) from the surrounding pixels; e.g., a (3 x 3 = 9 cells) grid of image regions, each 9 pixels x 9 pixels, centered on a
(a) FLGPR beamforming and prescreeener
(b) Cell-based feature extraction
(c) SK-SVM classifier training
(d) MKL classifier training (one kernel for each feature set) Figure 1. FLGPR explosive hazard detection block diagram
prescreener alarm. For each cell, we extract a set of features: the mean and standard deviation of the pixel values (called local statistics), LBP, and HOG. We also store the confidence (size-constrast filter value) at the alarm location. View (c) and (d) of Fig. 1 illustrate the proposed classifier training procedures. We first develop a classifier that uses the support-vector machine (SVM) to delineate false alarms from true positives, shown in view (c). This classifier first takes the features from each cell and contactenates them into a single vector. The vectors are then transformed into a kernel matrix K, which is input to the SVM quadratic program. The output is a classification boundary (a hyperplane in the high-dimensional kernel space) that can be used to classify incoming signals as false alarms or true positives. The MKL approach, shown in view (d), is similar to the SVM approach in that it uses an SVM-based algorithm to train the classifier. However, the kernel matrix K is composed of a weighted sum of multiple precomputed kernel matrices. The MKL procedure simultaneously trains the SVM classifier and the weights of the kernel matrix summation for
Table 1. ALARIC FLGPR Image-Forming Parameters
Parameter Coherent integration range Full-band bandwidth Down-range image resolution Cross-range image resolution Cross-range detection limits
Value 5 – 10 meters down-range 100 MHz – 1.5 GHz 5 cm 3 cm -5 to +5 meters
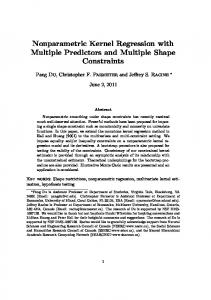
optimal classifier performance (according to the max-margin classifier goal). In view (d) of Fig. 1, we illustrate how MKL can be used to fuse multiple feature sets. For our experiments, these feature sets will be the features shown in view (b), but calculauted for different cell dimensions and cell counts. We will also fuse multiple kernel functions (e.g., mixing RBF and polynomial kernels). Finally, we will look at computing a kernel matrix for each type of feature (confidence, local statistics, LBP, and HOG) and fusing them using MKL. The data used in this paper were collected at a US Army test facility. Realistic models of explosive hazards were buried along two approximately 1 kilometer test roads, which we will call Lane 1 and Lane 2. We have 5 runs of data from Lane 1 and 4 runs of data from Lane 2. The results we show in this paper are test results; the detection algorithms were trained on Lane 1 and tested on Lane 2 (and vice versa). Hence, the results we show are indicative of real-world performance (given the small amount of data that we have). Section 2 describes the prescreener algorithm and the features we collect at each prescreener alarm are outlined in Section 3. Section 4 outlines the proposed classifier methods. We present test results on the two lanes of data in Section 5. Section 6 summarizes. 1.1 ALARIC FLGPR The FLGPR images we use in this paper were collected using a system called ALARIC. This system is an FLGPR that is composed of a physical array of sixteen receivers and one transmitter. The T/R array is aimed about 8 meters in front of the vehicle with approximately a 35 degree grazing angle relative to the ground. In the past decade, FLGPR systems have primarily used their physical arrays (aperture) as well as their radar bandwidth for achieving high resolution imaging; conventional backprojection or time-domain correlation imaging has been used for this purpose. Those systems rarely tried to exploit imaging information that is created by the motion of the platform. The ground-based FLGPR community has referred to imaging methods that leverage platform motion as multi-look imaging. Though, in the airborne community, this is better known as synthetic aperture radar (SAR) imaging. SAR has been shown to be an effective tool for airborne intelligence, surveillance and reconnaissance (ISR) applications. The ALARIC system is equipped with an accurate GPS system. As a result, it is capable of processing both physical and synthetic aperture imaging, even when the platform moves along a nonlinear or curved path. To create the FLGPR images, a nonlinear processing technique called Adaptive Multi-Transceiver Imaging is used. This method exploits a measure of similarity among the 32 T/R images which adaptively suppresses artifacts such as sidelobes and aliasing ghosts. Table 1 contains the parameters of the ALARIC FLGPR that were used to create the images used in this paper. The FLGPR images are created for an area -11 to +11 meters in the cross-range direction—although only the -5 to +5 meter cross-range sub-region is used in our detection algorithms—where negative numbers indicate to the left of the vehicle. Coherent integration of the radar scans is done in a 5 meter area, starting 5 meters in front of the vehicle. The pixelresolution of the FLGPR image is 5 cm in the down-range and 3 cm in the cross-range directions. The center frequency is 800 MHz and the bandwidth is 1.4 GHz. The detection region we use is 10 meters wide, centered in the cross-range direction. References 10-15 describe our previous efforts in detecting explosive hazards using FLGPR. 1.2 Area Under ROC (AUR) The AUR metric is used to show the relative efficacy of the different detection methods that we employ. This metric is simply the normalized area under the resulting receiver-operating characteristic (ROC) curve for a given detector. Figure 2 illustrates how we calculate this metric for an example ROC curve. We chose a maximum false alarms per meter-squared rate (FAR) of 0.1 at which to limit the AUR calculation. The AUR equation is
0.025
0.05
0.075
0.1
Figure 2. Area Under ROC (AUR) metric calculation.
𝐴𝑈𝑅 =
1 0.1
!.! !
𝑝! 𝑓 𝑑𝑓 ,
where 𝑝𝐷 (𝑓) is the probability of detection at a given FAR of 𝑓. Notice that the minimum AUR is 0, which indicates that 𝑝𝐷 𝑓 = 0 for FARs 𝑓 ∈ [0,0.1], and the maximum AUR is 1, which indicates perfect probability of detection with zero FAR. 1.3 Miss-distance halo size In this paper, we present results for a 0.5 meter radius miss-distance halo. There are many mechanisms of error in FLGPR that do not exist in downward-looking sensors, such as refraction at the air-ground boundary and other soil boundary layers, longer range imaging (which accentuates geo-location-based errors), and low-grazing angle specular ground-bounce. As of yet, a comprehensive understanding of how these sources of error manifest into miss-distances does not exist. Furthermore, we believe that FLGPR can operate as an early-warning sensor, cueing operators to the presence of targets ahead. The operators can then slow down and use a downward-looking system to more accurately locate the hazard. This allows operators to overall travel at higher speeds, covering more terrain in less time. Next we describe the prescreener.
(a) FLGPR image
(b) Size-contrast filtered image
(c) Local-maxima detector image Figure 3. Prescreener images—Target shown by red circle, alarm locations shown by white circles
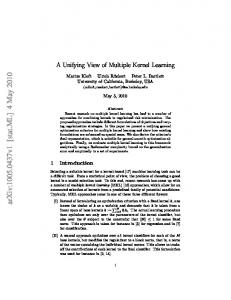
2. PRESCREENER Consider an FLGPR image 𝐼(𝑢, 𝑣) where 𝑢 is the cross-range coordinate and 𝑣 is the down-range coordinate. This image is first size-contrast filtered and then input to a local-maxima finding algorithm to determine candidate alarm locations. Our prescreener first calculates the size-contrast filtered image 𝐼!" (𝑢, 𝑣). This image is then used to find local maxima, which we identify as candidate target locations. A size-contrast filter is a simple operation defined by 𝐼!" 𝑢, 𝑣 = min 𝐼!"#$"% (𝑢, 𝑣) − 𝐼!!"# 𝑢, 𝑣 , 0 ,
(1)
where 𝐼!"#$"% (𝑢, 𝑣) is the mean pixel value in the center of a surrounding halo of pixels and 𝐼!!"# 𝑢, 𝑣 is the mean pixel value within the surrounding halo region. The center value 𝐼!"#$"% (𝑢, 𝑣) is calculated as 𝐼!"#$"% 𝑢, 𝑣 =
1 2𝑥 + 1 (2𝑦 + 1)
𝐼(𝑢 − 𝑖, 𝑣 − 𝑗),
(2)
!!!!:! !!!!:!
where x and y determine the size of the box in which the pixels are added. The halo value 𝐼!!"# 𝑢, 𝑣 is computed by 𝐼!!"# 𝑢, 𝑣 =
1 2𝑥! + 1 2𝑦! + 1 − (2𝑥 + 1)(2𝑦 + 1)
𝐼(𝑢 − 𝑖, 𝑣 − 𝑗) − !!!!! :!! !!!!! :!!
𝐼(𝑢 − 𝑖, 𝑣 − 𝑗)
(3)
!!!!:! !!!!:!
It is easy to see that the images 𝐼!"#$"% (𝑢, 𝑣) and 𝐼!!"# 𝑢, 𝑣 , for all 𝑢, 𝑣 in the image, can be computed by convolution. The image 𝐼!"#$"% (𝑢, 𝑣) is calculated by convolving 𝐼(𝑢, 𝑣) with a rectangle of size (2𝑥 + 1,2𝑦 + 1), each pixel having a value of the preceding fraction in (2). Similarly, 𝐼!!"# 𝑢, 𝑣 is calculated by convolving 𝐼(𝑢, 𝑣) with a halo with inner dimensions (2𝑥 + 1,2𝑦 + 1) and outer dimensions (2𝑥! + 1,2𝑦! + 1); each pixel in the halo has a value of 1 2𝑥! + 1 2𝑦! + 1 − (2𝑥 + 1)(2𝑦 + 1) . We empirically tested many values of the size-contrast parameters and found that (𝑥, 𝑦, 𝑥! , 𝑦! ) worked the best in general (although, the results for similarly sized and shaped filters were virtually identical). These are the parameter values we use for the results presented in this paper. After 𝐼!" (𝑢, 𝑣) is calculated, we pass this image through a local-maxima finding algorithm. Our method first computes a maximum order-filtered image with a 3 meter x 1 meter rectangular kernel. We denote this order-filtered image as 𝑂!" (𝑢, 𝑣). Essentially, each pixel in the size-contrast filtered image is replaced by the maximum pixel value within a 3 meter cross-range and 1 meter down-range rectangle, centered on the pixel. Figure 3 shows an example of an FLGPR image in view (a), its respective size-contrast filtered image in view (b), and its associated order-filtered image in view (c). As this figure shows, the order-filter reduces the effect that noise-induced artifacts have on finding “hot spots” in the image. Alarms are identified by the operation 𝐴 = arg (!,!) 𝐼!" 𝑢, 𝑣 ≥ min 𝑂!" 𝑢, 𝑣 , 10 , where A is the set of local-maxima locations. The minimum operator prescreens alarm locations that have a very low image value (confidence). We chose a value of 10 for this threshold as this only eliminates alarms with the lowest of confidences. This prescreening threshold merely minimizes the computational cost of the subsequent algorithms by reducing the number of alarms to a manageable number. We also annotate the alarm locations A with the value of the size-contrast image pixel at each location, which we denote as 𝐼!" (𝐴). This pixel value is, in effect, the confidence of the alarm—the higher the value, the higher the confidence. Figure 3 illustrates the prescreener process, including the alarm locations for the example images shown. The next step is to calculate a set of feature vectors for each alarm in A.
3. FEATURES The features that we compute at each candidate location in A are based on image features that have been shown to work well for many image processing and computer vision problems. These features are computed for groups of cells that surround each hit; each cell contains a rectangular subset of pixels. The cell counts that we use are (3 x 3), (5 x 5), and (7 x 7). For example, the (3 x 3) cell arrangement contains 9 cells, arranged in a (3 x 3) grid. The center cell is always centered on the candidate alarm location. Cell-based features capture not only the characteristics of the candidate alarm region, but also the spatial context in which the alarm is located. Figure 4 shows an example of an FLGPR image with a (5 x 5) cell-grid superimposed at the alarm location. In this case, each cell comprises a (21 x 21) subset of pixels. In each
Table 2. Feature Set Properties
Cell Sizes {𝒄𝒅𝒐𝒘𝒏 , 𝒄𝒄𝒓𝒐𝒔𝒔 } {𝒏𝒑𝒊𝒙𝒅𝒐𝒘𝒏 , 𝒏𝒑𝒊𝒙𝒄𝒓𝒐𝒔𝒔 }
Feature Set Dimension, d
1
{3, 3} {9, 9}
190
2
{5, 5} {9, 9}
526
3
{7, 7} {9, 9}
1030
4
{3, 3} {15, 15}
190
5
{5, 5} {15, 15}
526
6
{7, 7} {15, 15}
1030
7
{3, 3} {21, 21}
190
8
{5, 5} {21, 21}
526
9
{7, 7} {21, 21}
1030
10
{3, 3} {35, 35}
190
11
{5, 5} {35, 35}
526
12
{7, 7} {35, 35}
1030
13
{3, 3} {21, 35}
190
14
{5, 5} {21, 35}
526
15
{7, 7} {21, 35}
1030
Feature Set
of these cells, we calculate three features: statistics (mean and standard deviation), LBP, and HOG. We calculate the features from the FLGPR image, not the size-contrast filtered image. Table 2 shows the 15 different cell grid and cell sizes that we use to calculate the features. This table also shows the resulting dimension of the feature vector for each feature set. Now we discuss each feature individually. 3.1 Local Statistics The statistics feature is simply two values: the mean and standard deviation of the FLGPR image pixels in each cell. For example, for a (3 x 3) cell grid, we end up with 9 x 2 = 18 local statistics feature values. Local statistics have been shown to be effective in some of our previous efforts in FLGPR explosive hazard detection.10-12 In these previous works, we calculated additional local statistics, e.g., skewness and kurtosis. However, empirical tests have shown that mean and standard deviation are sufficient for capturing the local statistics for cell-based feature classification.
Figure 4. Cell-structure feature extraction illustration. Yellow boxes show cell arrangement of feature set 8.
Figure 4. LBP (3 x 3) neighborhood
3.2 Local Binary Patterns Monochromatic (or gray-scale) variations in an image can be used to capture the texture of the objects in the image. A very popular and effective method for capturing texture information is the LBP feature. We use a rotation-invariant uniform LBP that was developed by Ojala et al.16,17 The first step of the rotation-invariant uniform LBP is to capture a binary pattern for each pixel in the cell. Although the neighborhood of the LBP can be defined generally, we use an 8 pixel neighborhood with a radius of 1, shown in Fig. 4. The mask shown in Fig. 4 is centered on each pixel and the following operation is computed !
𝑠 𝑡! − 𝑡! 2! ,
𝐿𝐵𝑃!,! =
(4)
!!!
where 𝑠 𝑥 =
1, 𝑥 ≥ 0 . 0, 𝑥 < 0
This is where the feature gets its name, because each value of the summation in (4) contributes a unique bit to the binary representation of LBP. The LBP operator in (4) is calculated for each pixel in the cell. Then each binary string is rotated and uniformed to produce 10 unique labels for each pixel in the cell; this is accomplished by a look-up table. For a detailed description of this process, see reference 16. The final step of the LBP feature extraction is the calculation of the histogram for each cell ℎ!"# 𝑚 =
𝑆{𝐿𝐵𝑃!,! 𝑢, 𝑣 = 𝑚} , 𝑚 = 1, … ,10 !,!∈!"##
where 𝑆 𝐻 is a Boolean function that takes the value of 1 if the argument H is true and 0 else. Since there are 10 unique labels, the histogram contains 10 bins, each bin containing the count of the pixels in the cell with the corresponding uniform rotation-invariant LBP pattern. The histogram is then normalized by ℎ!"# 𝑚 =
ℎ!"# (𝑚) . !" !!! ℎ!"# (𝑖)
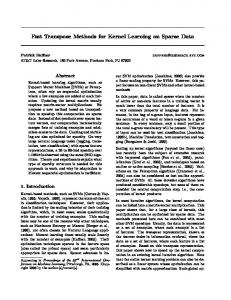
The normalized histogram values comprise the LBP feature. The LBP feature is calculated for each cell; hence, feature set 1 in Table 2 would contain (3 x 3 x 10) = 90 LBP feature values. 3.3 Histogram of Oriented Gradients Another texture descriptor for images is HOG.18 It is well known as it is a component of the popular SIFT feature.19 The HOG feature is similar to LBP in that it is based on a histogram (hence, the name). However, HOG calculates a distribution of local gradients, as opposed to a distribution of binary patterns. Figure 5 illustrates the HOG procedure for a (4 x 4) cell. For a given cell of pixels, the 8-direction local gradients are first calculated at each pixel. These 8 gradients for all pixels in the cell are then combined into an 8-bin histogram where each bin is the summed magnitude of the associated gradients. This histogram is the HOG feature. It is calculated for each cell; e.g., the first feature set in Table 2 would contain (3 x 3 x 8) = 72 HOG feature values. Now we move on to discussing our classifier training procedure.
Figure 5. Illustration of a (4 x 4) cell-structured HOG descriptor.
4. MULTIPLE KERNEL LEARNING (MKL) CLASSIFIER A classifier takes input data and returns the class labels for each feature vector in those data. Typically, classifiers are trained on a set of training data that have known labels. For our problem here, we have two class labels: explosive hazard and false alarm. From now on, we will denote explosive hazards by the label ‘+1’ and false alarms by the label ‘-1’. There are many classifiers out there, including neural networks, k nearest-neighbor, and Bayes classifiers. A good reference is the book by Duda, Hart, and Stork.23 Linear classifiers delineate class ‘-1’ from class ‘+1’ by finding the “best” separating hyper-plane in the feature space. The notion of “best” depends on the problem and the classification algorithm, but for our problem we wish to maximize the margin between the separating hyperplane and the nearest training data points. Linear classifiers are often effective, are easy to train, and are computationally efficient for real-time systems. However, they are unable to accurately classify data in which the classes are not separable by a hyper-plane. Hence, the “kernel trick” can be used to convert linear classifiers to nonlinear classifiers (nonlinear in the original data space). Consider some nonlinear mapping 𝜙: 𝐱 → 𝜙(𝐱) ∈ ℝ!! , where dK is the dimensionality of the transformed feature vector x. With most kernel algorithms, we do not explicitly transform x, we simply represent the dot product 𝜙 𝐱! ∙ 𝜙 𝐱 ! = 𝜅(𝐱! , 𝐱 𝟐 ). The kernel function 𝜅 can take many forms, with the polynomial 𝜅 𝐱, 𝐲 = 𝐱 𝐓 𝐲 + 1 ! and radial-basis function (RBF) 𝜅 𝐱, 𝐲 = exp γ 𝐱 − 𝐲
𝟐
being two of the most well-known. Given a set of n features X, we can thus
construct an (n x n) kernel matrix 𝐾 = 𝐾!" = 𝜅 𝐱 ! , 𝐱! . This kernel matrix K represents all pair-wise dot products of the n feature vectors in the transformed dK-dimensional space—called the Reproducing Kernel Hilbert Space (RKHS). Given a kernel matrix K, we can construct a classifier that finds the best class-separating hyper-plane in the RKHS. One such classifier that is widely used and very effective is the support vector machine. 4.1 Support Vector Machine (SVM) The SVM algorithm is generally defined as the optimization problem min 𝐰,!
1 𝐰 2
!
subject to 𝑦! 𝐰 ∙ 𝐱 ! − 𝑏 ≥ 1, 𝑖 = 1, … , 𝑛, where 𝑦! ∈ {−1, +1} are the class labels and (𝐰 ∙ 𝐱 ! − 𝑏) is the equation of the hyper-plane separating the positive class from the negative class. This form of the SVM, however, does not support overlapping classes, viz., errors in the training data. Hence, the soft-margin SVM was introduced as min 𝐰,𝛏,!
subject to
1 𝐰 2
! !
+𝐶
𝜉! !!!
𝑦! 𝐰 ∙ 𝐱 ! − 𝑏 ≥ 1 − 𝜉! , 𝜉! > 0, 𝑖 = 1, … , 𝑛, where C determines how many errors are allowed in the training.24 Notice that this is the linear soft-margin SVM. The kernel soft-margin SVM is easily defined in the dual form the SVM, where the optimization problem is solved using Lagrange multipliers. The single-kernel SVM (SK-SVM) is defined as max 𝟏! 𝛼 − !
1 𝛼 ∘ 𝐲 !𝐾 𝛼 ∘ 𝐲 2
subject to 0 ≤ 𝛼! ≤ 𝐶, 𝑖 = 1, … , 𝑛, 𝛼 ! 𝐲 = 0, where 1 is the n-length vectors of 1s.25 Note that SK-SVM reduces to the linear SVM for the kernel 𝜅 𝐱, 𝐲 = 𝐱 𝐓 𝐲. We use LIBSVM to efficiently solve the SK-SVM problem.26 The output of LIBSVM is a classifier model that contains the vector 𝛼 and the bias b. New feature vectors can be classified by computing !
label!"# = sgn
𝛼! 𝑦! 𝜅(𝐱 ! , 𝐱 !"# ) − 𝑏 , !!!
where sgn is the sign operator. The drawback of SK-SVM is that it only accepts a single set of features as input. Hence, one must concatenate multiple features together into one (often, large) vector. Second, one must judiciously choose the kernel function; a poor choice could result in bad classifier performance. A recent innovation that addresses these problems is MKL. 4.2 MKL Group Lasso MKL extends the SVM framework by assuming that the kernel K is composed of a weighted combination of precomputed kernel matrices !
𝐾=
𝜎! 𝐾! , !!!
where there are m kernels and 𝜎! is the weight of the kth kernel. Hence, the MKL classifier is defined as min max 𝟏! 𝛼 − !∈!
!
1 𝛼∘𝐲 2
! !
𝜎! 𝐾!
𝛼∘𝐲
(5)
!!!
subject to (typically) 0 ≤ 𝛼! ≤ 𝐶, 𝑖 = 1, … , 𝑛, 𝛼 ! 𝐲 = 0, where Δ is the domain of 𝜎. Note that this is the same problem as SK-SVM if the kernel weights are assumed constant.27 This property has been used by many researchers to propose alternating optimization (AO) procedures for solving the min-max optimization problem. That is, solve the inner maximization for a constant kernel K, and then update the weights 𝜎 to solve the outer minimization, and repeat until convergence. The domain of 𝜎 is very important and many MKL implementations only work for a single domain. For example, 28,29 Δ = 𝜎 ∈ ℝ! We use a generalized MKL instantiation that allows for an ! : 𝜎 ! < 1, 𝜎! > 0 is the L2-norm MKL. 30 Lp-norm domain Δ = 𝜎 ∈ ℝ! ! : 𝜎 ! < 1, 𝜎! > 0 . We use an optimization procedure proposed by Xu et al. called MKL group lasso (MKL-GL).30 This method is efficient as it uses a closed form solution for solving the outer minimization in (5). The new kernel weights 𝜎′ are calculated by
! !!!
𝑓!
𝜎′! =
! !! ! !!! ! !!! 𝑓!
, 𝑘 = 1, … , 𝑚;
𝑓! = 𝜎!! 𝛼 ∘ 𝐲 ! 𝐾! 𝛼 ∘ 𝐲 . The MKL-GL algorithm has the following steps: 1.
Initialize 𝜎 ! = 𝟏/𝑚
2.
Repeat
3.
(6)
(7)
30
! !!! 𝜎! 𝐾!
a.
Solve SK-SVM for 𝐾 =
b.
Updates weights by (6) and (7)
Until convergence
As you can see, this algorithm is simple to implement and is efficient because step 2b has a closed form solution. MKL can be thought of as a classifier fusion algorithm. It can find the optimal kernel among a set of candidates by tuning the weights on each kernel. It can also be used to fuse multiple feature vectors describing the same object (or, in this case, location on the ground). Many combinations can be imagined. For our experiments, we will first show results of fusing multiple types of kernels on the same feature vector (mixtures of RBFs and polynomials). Then we will demonstrate how MKL can be used to fuse the results from multiple feature vectors. Last, we will examine how MKL performs in fusing the different types of features (as opposed to concatenating the types of features from one feature set into a single vector).
5. RESULTS We tested our detection algorithms—prescreener and classifiers (SK-SVM and MKL)—on two test lanes. We have 9 totals runs on these two lanes: 5 runs on Lane 1, and 4 runs on Lane 2. The training data for each test lane were the runs for the other lane; e.g., the training data for Lane 1 are the 4 runs combined of Lane 2. We stress that no information from the test lane was use in the training. Thus, the test results here are indicative of the expected performance on a new, unobserved lane. For comparison, the AUR of the prescreener algorithm is 0.48 for Lane 1 and 0.44 for Lane 2. 5.1 SK-SVM Table 3 shows the results of the SK-SVM classifier for the 15 features sets (see Table 2 for identification of each feature set). We used the RBF kernel with width 𝛾 = 1/𝑑, where d is the dimensionality of the feature set. The SVM parameter C = 1. Note that we did a grid-search of various values of 𝛾 and C and found that, within reason, these parameters had no effect on the results. The table shows the AUR for the training (resubstitution) and test results for both lanes. We also rank the feature sets for each lane—the lower valued the rank, the better the feature (the higher the AUR). We also compute a total rank by adding the respective ranks from each lane. Bold indicates the best feature set for both lanes and overall. The total rank shows that feature set 12 is the best performing overall: with a rank of 1 for Lane 1 and a rank of 3 for Lane 2. Close followers are feature sets 14 and 10. Looking back at Table 2, we see that all these feature sets share the common trait that they have large cells (35 pixels in at least one dimension). The worst performing feature sets were those that had smaller (9 x 9) pixel cells. Furthermore, the feature sets that have (5 x 5) and (7 x 7) cell arrangements perform better than the (3 x 3) cell arrangements over all. Now we compare against the MKL approach.
Table 3. AUR of Feature Sets (SK-SVM Classifier, C = 1, RBF 𝛾 = 1/𝑑)
Lane Training Testing 1 Rank Training Testing 2 Rank Total Rank
1
2
3
4
5
6
0.57 0.47
0.60 0.47
0.63 0.51
0.57 0.48
0.60 0.52
0.62 0.53
Feature Set 7 8 9 0.55 0.52
0.60 0.50
0.61 0.51
10
11
12
13
14
15
0.58 0.53
0.60 0.53
0.63 0.54
0.56 0.51
0.60 0.53
0.63 0.52
15
14
10
13
8
5
12
9
4
6
2
1
11
3
7
0.61 0.44
0.65 0.44
0.67 0.46
0.60 0.47
0.63 0.49
0.65 0.48
0.61 0.50
0.63 0.51
0.65 0.50
0.62 0.50
0.64 0.51
0.66 0.51
0.61 0.48
0.63 0.51
0.65 0.51
14
15
13
12
9
8
10
7
5
6
3
2
11
1
4
29
29
23
15
17
13
22
16
9
12
5
3
22
4
11
AUR is normalized to 0.1 FA/m2. Bold indicates best result.
5.2 MKL We performed several experiments to determine how the MKL approach could improve AUR. First, we selected the best performing feature set, 12, from the SK-SVM experiment in Table 3, and then we used the MKL method to combine different types of kernels (RBF and polynomial). Table 4 shows the AUR of these experiments; bold indicates that the MKL result was equal to or better than the best SK-SVM result for each lane. The first three rows show the results for combinations of kernels with different RBF widths. For example, γ = {10/d, 1/d, 0.1/d } indicates 3 RBF kernels. As the table shows, the MKL approach is able to achieve better performance than SK-SVM for both training and testing on Lane 1 and for training on Lane 2. On Lane 1, the MKL approach shows improved testing performance for all 3 experiments that combine multiple RBF kernels. But this is not observed on Lane 2. MKL only is able to match SKSVM for one of the RBF combinations. The addition of the polynomial kernel improves the training AUR for both lanes, but negatively impacts the testing AUR. This is an example of classifier overfitting. Because of this, we discourage the use of the polynomial kernel for this application. Table 4. AUR of MKL Fusion vs. Kernel Types (C = 1, p = 100, F = {12})
Kernels 𝜸 = {10/d, 1/d, 0.1/d } 𝜸 = {100/d, 10/d, 1/d } 𝜸 = {1/d, 0.1/d } 𝜸 = {1/d, 0.1/d }, 𝝆 = {2} 𝝆 = {2, 5}
Lane 1 Training Testing 0.63 0.68 0.57 0.67 0.67
0.56 0.57 0.55 0.48 0.50
Lane 2 Training Testing 0.66 0.71 0.60 0.70 0.71
0.49 0.51 0.50 0.48 0.49
AUR is normalized to 0.1 FA/m2. Bold indicates that MKL result is equal to or better than SK-SVM. 𝜸 indicates width of RBF; 𝝆 indicates degree of polynomial.
The second experiment we performed with MKL tested combinations of feature sets from Table 3. We used a greedy approach to choose feature sets, starting with the combination of {12, 14}, the two best performing feature sets overall in Table 3. Table 5 shows the AUR of five combinations of feature sets. Bold indicates that the MKL-trained classifier was as good as or better than the best SK-SVM result for each lane. Interestingly for this experiment, none of the MKL training results were as good as the SK-SVM training results. However, the Lane 1 MKL testing results were superior to those of SK-SVM, showing nearly 4% improvement in AUR. The performance of MKL on Lane 2 was equal to that of SK-SVM for most combinations of feature sets.
Table 5. AUR of MKL Feature-Set Fusion (C = 1, p = 100)
Lane 1 Features, F {12, 14} {11, 12, 14} {9, 11, 12, 14} {9, 11, 12, 14, 15} {9, 10, 11, 12, 14, 15}
Training 0.59 0.59 0.60 0.61 0.61
Lane 2
Testing 0.56 0.56 0.57 0.56 0.56
Training 0.62 0.62 0.62 0.63 0.63
Testing 0.51 0.51 0.51 0.51 0.50
AUR is normalized to 0.1 FA/m2. Bold indicates that MKL result is equal to or better than SK-SVM.
Table 6 demonstrates the results of MKL using different regularization norms p; see Eq. (6). For this experiment, we chose the best combination of feature sets from Table 5, namely {9, 11, 12, 14}. As the results in Table 6 show, the regularization norm seems to have little effect on the AUR of the MKL classifier, but large values of p show slightly better performance than small values. This is especially noticeable on Lane 2, where p = 1.1, 2, and 10 produce results inferior to that of SK-SVM. Table 6. AUR of MKL Fusion vs. Regularization-Norm p (C = 1, F = {9,11,12,14})
p 1.1 2 10 100 1000
Lane 1 Training Testing 0.56 0.55 0.57 0.56 0.59 0.57 0.60 0.57 0.60 0.57
Lane 2 Training Testing 0.57 0.49 0.58 0.50 0.60 0.50 0.62 0.51 0.62 0.51
AUR is normalized to 0.1 FA/m2. Bold indicates that MKL result is equal to or better than SK-SVM.
The last experiment we performed on MKL was using separate kernel matrices for each type of feature (confidence, local statistics, LBP, and HOG), resulting in 4 input kernel matrices. Table 7 shows the AUR for four different kernel combinations. The first row combines 4 RBF kernel matrices, each with width 𝛾 = 1/1030 (d = 1030 is the dimension of feature set 12). The second row sets the RBF width of the kernel matrices to 1/df where df is the dimension of the feature in each kernel matrix (confidence dimension = 1, local statistic = 198, etc.). The final two rows in Table 7 show the AUR if we use polynomial kernels of degree = 3 and 1, respectively. The best performing combination is the first row, which uses the same kernel width as the corresponding SK-SVM. However, MKL is only able to improve the AUR on Lane 1. The Lane 2 MKL results are the same as SK-SVM. The other three classifiers (rows 2-4) are inferior, especially the polynomial kernel combinations. This result is similar to what we saw in Table 4, where the polynomial kernel showed overfitting behavior. This is further evidence that the polynomial kernel is inappropriate for this application. Table 7. AUR of MKL Feature Fusion (C = 1, p = 100, F = {12})
Kernels 𝜸 = {1/1030, 1/1030, 1/1030, 1/1030} 𝜸 = {1, 1/98, 1/490, 1/441} 𝝆 = {3, 3, 3, 3} 𝝆 = {1, 1, 1, 1}
Lane 1 Training Testing 0.57 0.55 0.58 0.54 0.67 0.48 0.66 0.47
Lane 2 Training Testing 0.60 0.51 0.59 0.49 0.70 0.47 0.69 0.48
AUR is normalized to 0.1 FA/m2. Bold indicates that MKL result is equal to or better than SKSVM. 𝜸 indicates width of RBF for each feature kernel; 𝝆 indicates degree of polynomial.
5.3 High-Metal Targets For these experiments we only considered the high-metal content targets. The AUR of the prescreener against these targets is 0.73 for Lane 1 and 0.71 for Lane 2. Clearly, the FLGPR is more suited to detecting high-metal objects. Tables 8 and 9 show the SK-SVM and MKL results, respectively, if we only consider high-metal targets. Table 8 shows the SKSVM results. As you can see, the FLGPR performance against high-metal targets is significantly better than against all targets, as shown in Table 3. Interestingly, the best feature set for the high-metal targets is 6, which was not even in the top 5 for the all-targets experiment. Similar to the results shown in Table 3, the small-sized cells (feature sets 1-4) underperformed. For the high-metal targets, the best performing features show a compromise between cell-grid size and cell dimension. Table 9 shows the same MKL experiment as performed in Table 5, except we only consider high-metal targets. Hence, we choose the best performing features sets from Table 8 in a greedy approach. Similar to that in Table 5, we see that MKL shows improved performance for Lane 1 and equal performance to SK-SVM for Lane 2. However, the improvement here is only slight. We believe that because there are very few high-metal target alarms in the training data, relative to false alarms, the MKL training only shows slight improvement because the class distribution is so lopsided. Table 8. AUR of Feature Sets Against High-Metal Targets (SK-SVM Classifier, C = 1, RBF 𝛾 = 1/𝑑)
Lane Training Testing 1 Rank Training Testing 2 Rank Total Rank
1
2
3
4
5
6
0.77 0.72
0.81 0.73
0.82 0.75
0.79 0.73
0.80 0.77
0.82 0.77
Feature Set 7 8 9 0.75 0.72
0.81 0.76
0.82 0.75
10
11
12
13
14
15
0.80 0.76
0.81 0.76
0.83 0.75
0.77 0.75
0.81 0.77
0.83 0.74
14
13
10
12
2
1
15
5
7
4
6
9
8
3
11
0.79 0.70
0.82 0.69
0.82 0.71
0.79 0.71
0.82 0.76
0.83 0.76
0.79 0.74
0.82 0.75
0.83 0.75
0.82 0.77
0.83 0.77
0.83 0.75
0.80 0.75
0.82 0.76
0.83 0.75
14
15
13
12
5
3
11
9
8
1
2
6
7
4
10
28
28
23
24
7
4
26
14
15
5
8
15
15
7
21
AUR is normalized to 0.1 FA/m2. Bold indicates best result. Table 9. AUR of MKL Feature-Set Fusion Against High-Metal Targets (C = 1, p = 100)
Features, F {6, 10} {5, 6, 10} {5, 6, 10, 14} {5, 6, 10, 11, 14} {5, 6, 8, 10, 11, 14}
Lane 1 Training Testing 0.82 0.78 0.82 0.78 0.83 0.78 0.83 0.78 0.84 0.78
Lane 2 Training Testing 0.82 0.77 0.81 0.77 0.82 0.77 0.82 0.77 0.83 0.76
AUR is normalized to 0.1 FA/m2. Bold indicates that MKL result is equal to or better than SK-SVM.
6. CONCLUSION We presented two approaches for detecting explosive hazards in FLGPR. First, the FLGPR image is filtered with a sizecontrast filter, then a local-maxima detecting prescreener is used to mark candidate target locations. At each candidate location, a collection of features is computed; these features are prescreener confidence, cell-based local statistics, cellbased LBP, and cell-based HOG. We collected features for 15 different cell-grid counts and dimensions. The first classifier approach uses the SK-SVM on one of these feature sets to train a classifer. The second approach uses MKL to combine multiple kernel matrices; the combination weights as well as the SVM classifier are trained simultaneously. We experimented with four different methods for combing multiple kernels. The first method simply combined different types of kernels (RBF and polynomial) for one feature set. The second combined multiple feature sets, each feature set having its own kernel matrix. Third, we looked at how the regularization norm affected the MKL result. Finally, we tested a combination where there was one kernel matrix for each type of feature (5 total matrices). Our experiments showed that both SK-SVM and MKL improve AUR over a prescreener-only detector, with SK-SVM offering nearly 15% improvement in AUR over the prescreener and MKL producing another 4% of improvement (for Lane 1). Our results showed that MKL can produce improved performance over the SK-SVM method. The most effective MKL approach was to combine multiple feature sets using a large value for the regularization norm. One combination of RBF kernels also showed better performance, but combing multiple feature sets seemed to be more robust. Overall, the best MKL result improved AUR by 4% over the best SK-SVM result on Lane 1 and equaled the performance of SK-SVM on Lane 2. For this reason, we believe that MKL is a good candidate for future development of FLGPR explosive-hazard detection algorithms. Furthermore, the trained MKL classifier is simply a hyperplane in the kernel space; hence, implementing the classifier in real-time (e.g., on an embedded architecture) for an operational system would be very easy. Lastly, we showed that the FLGPR performance is significantly improved if only high-metal targets are considered. We aim to continue to investigate this phenomenon in the future. 6.1 Future Work There is still much improvement to be had with this FLGPR system. We also believe that the methods proposed here can be further improved. First, it has been shown in other studies, such as image classification, that MKL can show great improvement over single-kernel SVM approaches. With the limited amount of test data we had for this study and the small amount of targets present in each lane, it was difficult to accurately model the target or true-positive class. In our future efforts, we will investigate solutions to training MKL classifiers for unbalanced class label distributions. We will also look at ways of modeling FLGPR target signatures and using these models in MKL training. Finally, we will continue to examine other features, such as the MSER, which has shown to be effective in our previous work using IR cameras.20-22 It is our belief that, as more data become available, MKL will show to be an effective method for training classifiers that minimize false alarms while maintaining high probability of detection.
ACKNOWLEDGEMENTS This work was funded by Army Research Office grant number 57940-EV to support the US Army RDECOM CERDEC NVESD and by Leonard Wood Institute grant LWI 101-022.
REFERENCES [1] Cordesman, A.H., Allison, M. Kocharlakota, J.L., and Loi, C., “Afghan and Iraqi metrics and the IED threat,” CSIS Burke Chair in Strategy Report, http://www.csis.org/publication/101110_ied_metrics_combined.pdf (2010). [2] Cremer, F., Schavemaker, J.G., de Jong, W., and Schutte, K., "Comparison of vehicle-mounted forward-looking polarimetric infrared and downward-looking infrared sensors for landmine detection", Proc. SPIE 5089, 517-526 (2003). [3] Playle, N., Port, D.M., Rutherford, R., Burch, I.A., and Almond, R., "Infrared polarization sensor for forwardlooking mine detection", Proc. SPIE 4742, 11-18 (2002).
[4] Costley, R.D., Sabatier, J.M., and Xiang, N., "Forward-looking acoustic mine detection system", Proc. SPIE 4394, 617-626 (2001). [5] Collins, L.M., Torrione, P.A., Throckmorton, C.S., Liao, X., Zhu, Q.E., Liu, Q., Carin, L., Clodfelter, F., and Frasier, S., "Algorithms for landmine discrimination using the NIITEK ground penetrating radar", Proc. SPIE 4742, 709-718 (2002). [6] Gader, P.D., Grandhi, R., Lee, W.H., Wilson, J.N., and Ho, K.C., “Feature analysis for the NIITEK ground penetrating radar using order weighted averaging operators for landmine detection”, Proc. SPIE 5415, 953-962 (2004). [7] Bradley, M.R., Witten, T.R., Duncan, M., and McCummins, R., "Anti-tank and side-attack mine detection with a forward-looking GPR", Proc. SPIE 5415, 421-432 (2004). [8] Cosgrove, R.B., Milanfar, P., and Kositsky, J., "Trained detection of buried mines in SAR images via the deflectionoptimal criterion", IEEE. Trans. Geoscience and Remote Sensing 42(11), 2569-2575 (2004). [9] Sun, Y., and Li, J., "Plastic landmine detection using time-frequency analysis for forward-looking groundpenetrating radar”, Proc. SPIE 5089, 851-862 (2003). [10] Stone, K., Keller, J.M., Ho, K.C., and Gader, P.D. “On the registration of FLGPR and IR data for the forwardlooking landmine detection system and its use in eliminating FLGPR false alarms,” Proc. SPIE 6953, (2008). [11] Havens, T.C., Stone, K., Keller, J.M., and Ho, K.C. “Sensor-fused detection of explosive hazards”, Proc. SPIE 7303, 73032A (2009). [12] Havens, T.C., Spain, C.J., Ho, K.C., Keller, J.M., Ton, T.T., Wong, D.C., and Soumekh, M., “Improved Detection and False Alarm Rejection Using FLGPR and Color Imagery in a Forward-Looking System”, Proc. SPIE, 7664, 76641U (2010). [13] Havens, T.C., Ho, K.C., Farrell, J., Keller, J.M., Popescu, M., Ton, T.T., Wong, D.C., Soumekh, M., “Locally adaptive detection algorithm for forward-looking ground-penetrating radar”, Proc. SPIE, 7664, 76642E (2010). [14] Wang, T., Sjahpetura, O., Keller, J.M., and Gader, P.D., “Landmine detection using forward-looking GPR with object-tracking,” Proc. SPIE 5794, 1080-1088 (2005). [15] Havens, T.C., Keller, J.M., Ho, K.C., Ton. T.T., Wong, D.C., and Soumekh, M., “Narrow-band processing and fusion approach for explosive hazard detection in FLGPR,” Proc. SPIE, 8017, 80171F (2011). [16] Ojala, T., Pietikainen, M., and Maenpaa, T., “Multiresolution gray-scale and rotation invariant texture classification with Local Binary Patterns,” IEEE Trans. Pattern Analysis and Machine Intelligence 24(7), 971-987 (2002). [17] Ojala, T., Pietikainen, M., and Maenpaa, T., “A generalized Local Binary Pattern operator for multiresolution gray scale and rotation invariant texture classification,” 2nd Int. Conf. Advances in Pattern Recognition, 397-406 (2001). [18] Dalal, N. and Triggs, B., “Histogram of oriented gradients for human detection,” IEEE Conf. Computer Vision and Pattern Recognition II, 886-893 (2005). [19] Lowe, D., “Distinctive image features from scale-invariant keypoints,” Int. Journal of Computer Vision 60, 91-110 (2004). [20] Anderson, D.T., Keller, J.M., and Sjahputera, O., “Algorithm fusion in forward-looking longwave infrared imagery for buried explosive hazard detection,” Proc. SPIE, 8017, 801722 (2011). [21] Forssen, P., and Lowe, D., “Shape descriptors for maximally stable extremal regions,” Int. Conf. Computer Vision, 1-8 (2007). [22] Matas, J., Chum, O., Urban, M., and Pajdla, T., “Robust wide-baseline stereo from maximally stable extremal regions,” Image and Vision Computing 22, 761-767 (2004). [23] Duda, R.O, Hart, P.E., and Stork, D.G., [Pattern Classification], Wiley (2001). [24] Cortes, C., and Vapnik, V.N., “Support-vector networks,” Machine Learning 20(3), 273-297 (1995). [25] Boser, B.E., Guyon, I.M., and Vapnik, V.N., “A training algorithm for optimal margin classifiers,” ACM Workshop on COLT, 144-152 (1992). [26] Chang, C.C., and Lin, C.J., “LIBSVM: a library for support vector machines,” ACM Trans. Intelligent Systems and Technology 2(3), 27:1-27:27(2011). [27] Lanckriet, G.R.G., Cristianini, N., Bartlett, P., Ghaoui, L.E., and Jordon, M.I., “Learning the kernel matrix with semidefinite programming,” J. Machine Learning Research 5, 27-72 (2004). [28] Kloft, M., Brefeld, U., Laskov, P., and Sonnenburg, S., “Non-sparse multiple kernel learning,” NIPS Workshop on Kernel Learning: Automatic Selection of Optimal Kernels (2008). [29] Cortes, C., Mohri, M. and Rostamizadeh, A., “l2 regularization for learning kernels,” Proc. Conf. Uncertainty in Artificial Intelligence, 187-196 (2009).
[30] Xu, Zenglin, Jin, R., Yang, H., King, I., and Lyu, M.R., “Simple and efficient multiple kernel learning by group lasso,” Proc. Int. Conf. Machine Learning, 1175-1182 (2010).