MachineLearning,21,177-193 (1995) © 1995 KluwerAcademicPublishers,Boston. Manufacturedin The Netherlands.
Neural Networks for Full-Scale Protein Sequence Classification: Sequence Encoding with Singular Value Decomposition CATHYWU
[email protected] Department of Epidemiology/Biomathematics, The University of Texas Health Center at Tyler, Tyler, Texas 75710 MICHAEL BERRY Department of Computer Science, University of Tennessee, Knoxville, Tennessee 37996-1301 SAILAJA SHIVAKUMARAND JERRY MCLARTY Department of Epidemiology/Biomathematics, The University of Texas Health Center at Tyler, Tyler, Texas 75710
Editors: LawrenceHunter,David Searls, and Jude Shavlik Abstract. A neural network classificationmethod has been developed as an alternativeapproach to the search/ organizationproblemof protein sequencedatabases. The neural networks used are three-layered,feed-forward, back-propagationnetworks. The proteinsequencesare encodedinto neuralinputvectorsby a hashingmethodthat counts occurrencesof n-gram words. A new SVD (singularvaluedecomposition)method,which compressesthe longand sparse n-gram input vectors and captures semanticsof n-gram words, has improvedthe generalization capabilityof the network. A full-scaleproteinclassificationsystemhas beenimplementedon a Cray supercomputer to classifyunknownsequencesinto 3311 PIR (Protein IdentificationResource) superfamilies/familiesat a speed of less than 0.05 CPU secondper sequence. The sensitivityis closeto 90% overall,and approaches 100%for large superfamilies. The systemcouldbe usedto reducethe databasesearch time and is beingused to help organizethe PIR proteinsequencedatabase.
Keywords: neuralnetworks, database search, protein classification,sequence analysis, superfamily,singular value decomposition(SVD)
Introduction Nucleic acid and protein sequences contain a wealth of information of interest to molecular biologists since the genome forms the blue-print of the cell. Currently, a database search for sequence similarities represents the most direct computational approach to decipher the codes connecting molecular sequences with protein structure and function (Doolittle, 1990). If the u n k n o w n protein is related to one of known structure/function, inferences based on the known structure/function and the degree of the relationship can provide tile most reliable clues to the nature of the unknown protein. This technique has proved successful and has led to new understanding in a wide variety of biological studies (Boswell & Lesk, 1988). There exist good algorithms and mature software for database search and sequence analysis (Gribskov & Devereux, 1991; von Heijne, 1991). However, due to the advancement of genetic engineering technology and the advent of the human genome project, the molecular sequence data has been accumulating at an accelerating rate. This is making the database search become computationally intensive and ever more forbidding, even with the rapid advancement of new search tools. It is, therefore, desirable to develop methods whose search time is not constrained by the database size.
178
c. wu ET AL.
A classification method can be used as an alternative approach to the database search/ organization problem with several advantages: (1) speed, because the search time grows linearly with the number of sequence classes (families), instead of the number of sequence entries; (2) sensitivity, because the search is based on information of a homologous family, instead of any sequence alone; and (3) automated family assignment. We have developed a new method that applies back-propagation neural networks for sequence classification (Wu, et al., 1992; Wu, 1993). In addition, three other sequence classification methods have been devised: a multivariant statistical technique (van Heel, 1991), a binary similarity comparison followed by an unsupervised learning procedure (Harris, et al., 1992), and Kohonen's selforganized feature map (Ferran, et al., 1994). All of these classification methods are very fast, thus, applicable to thelarge sequence databases. Themajordifference between our and other approaches is that the back-propagation neural network is based on "supervised" learning, whereas the other two are "unsupervised". The supervised learning can be performed using training sets compiled from any existing second generation database (i.e., database organized according to family relationship) and used to classify new sequences into the database according to the predefined organization scheme of the database. The unsupervised system, on the other hand, defines its own family clusters and can be used to generate new second generation databases. The neural network technique has its origins in efforts to produce a computer model of the information processing that takes place in the nervous system (Rumelhart & McClelland, 1986). One can simply view a neural network as a massively parallel computational device, composed of a large number of simple processing units (neurons). The neurons communicate through a large set of interconnections with variable strengths (weights), in which the learned information is stored. Artificial neural networks with back-propagation currently represent the most popular learning paradigm, and have been successfully used to perform a variety of input-output mapping tasks for recognition, generalization, and classification (Dayhoff, 1990). In fact, neural networks can approximate linear and nonlinear discriminant analysis with a stronger capability of class separation (Webb & Lowe, 1990). As a technique for computational analysis, neural network technology has been applied to many studies involving the sequence data analysis (please see Hirst & Sternberg, 1992 for a recent review). Back-propagation networks have been used to predict protein secondary and tertiary structures (Qian & Sejnowski, 1988; Holley & Karplus, 1989; Kneller, et al., 1990; Bohr, et al., 1990), to distinguish ribosomal binding sites from non-binding sites (Stormo, et al., 1982) and encoding regions from non-coding sequences (Uberbacher & Mural, 1991; Farber, et al., 1992), and to predict bacterial promoter sequences (Demeler & Zhou, 1991; O'Neill, 1992; Horton & Kanehisa, 1992). This study extends our protein classification neural networks into a full-scale system that classifies 3311 PIR superfamilies/families and introduces a new SVD method for sequence encoding to improve network accuracy. The paper further analyzes system performance, evaluates its strength and weakness, and discusses system application for database search and organization.
System Design The neural network system was designed as an associative memory capable of classifying unknown sequences. Once trained with known sequences from molecular databases, the
179
NEURAL NETWORK CLASSIFICATION
Input vector
Unknown sequence DNA/RNA
Protein
A TU G G C
M A 8 8 T F y Z p F V II E II G E G S
TU e C A TU C A A C TU G G G
OR
Neural network
DNA/RNA or Protein Class
Input Layer
Layer
Output Layer
"';"~"g"~"~";'"~";"~"b ~6o6d6a6"
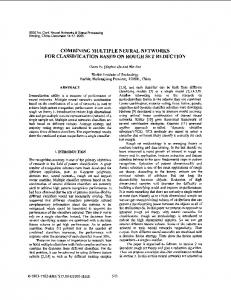
Figure 1. A neural network system for molecular sequence classification. The molecular sequences are first converted by a sequence encoding schema into neural net input vectors. The neural networks then classifies them into predefined classes according to sequence information embedded in the neural interconnections after network training.
network can classify new (not trained previously) sequences into predefined classes based on information embedded in the network interconnections. In other words, it can map molecular sequences (input) into sequence classes (output) (Fig. 1). There are two major design issues: the sequence encoding schema, and the neural network architecture.
Sequence Encoding Schema The sequence encoding schema is used to convert molecular sequences (character strings) into input vectors (numbers) of the neural network classifier (Fig. 1). An ideal encoding scheme should satisfy the basic coding assumption so that similar sequences are represented by 'close' vectors. There are two different approaches for the sequence encoding. Once can either use the sequence data directly, as in most neural network applications of molecular sequence analysis, or use the sequence data indirectly, as in Uberbacher and Mural (1991). Where sequence data is encoded directly, most studies (e.g., Qian & Sejnowski, 1988; Farber, et al., 1992) use an indicator vector to represent each molecular residue in the sequence string. That is, a vector of 20 input units (among which 19 have a value of zero, and one has a value of one) to represent an amino acid, and a vector of four units (three are zeroes and one is one) for a nucleotide. This representation, however, is not suitable for sequence classifications where long and varied-length sequences are to be compared. For example, a protein sequence of 500 amino acids long would require a vector of 10,000 units, and sequences of different lengths would result to input vectors of different sizes.
N-Gram Method. We have been using a n-gram hashing function (Wu, et al., 1992; Wu, 1993) that extracts and counts the occurrences of n-gram patterns from a sequence string.
180
c. w u ET AL.
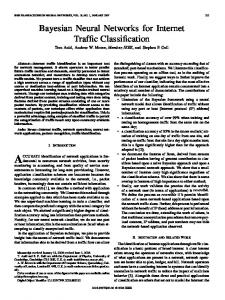
N-gram patterns, similar to k-tuple words used in the Fasta program (Pearson & Lipman, 1988), consist ofn consecutive residues and are extracted from sequence strings in a sliding window fashion. In the encoding, the original protein sequence string can be represented by different alphabet sets, including: set A, the 20-letter amino acids; set E, the six-letter exchange groups derived from the PAM (accepted point mutation) matrix; and set S, the three-letter structural groups (I, A, E for internal, ambivalent and external). Different n-gram encoding methods are named by a two-character code: the first character is a letter designating the alphabet set; the second character is a digit representing the size (length) of the n-gram. Figure 2 shows the n-gram encoding of an example sequence using s2 method (i.e., bi-grams of the structural groups). Note that the counts of the n-gram patterns are scaled to fall between 0 and 1 and used as input vectors for the neural network, with each unit of the vector representing an n-gram pattern. The size of the input vector (i.e., the number of input units) for each n-gram method is m n, where m is the size of the alphabet. In the example shown, the size of the input vector is 9 or 32 (Fig. 2). The n-gram method has several advantages: (1) it maps sequences of different lengths into input vectors of the same length; (2) it providescertain representation invariance with respect
L GI~W'¢C 2'I,2*Llr.F
]
A m i n o A c i d Sequence Sequence
Interpretation
I
IA~'AI~I
S t r u c t u r a l Group Bigram
Extraction
Bigram P a t t e r n s ~
Pattern
Transformation
0 Bz R'r "rA ZZ zz
Input Vector
Figure2. Then-gramsequenceencodingrnethod. Theencodinginvolvesthreesteps: (1) sequence interpretation, during which each sequence string is converted into strings of different alphabet sets; (2) n-gram extraction, when all different n-gram patterns are extracted from the sequence; and (3) pattern transformation, when the occurrence of each n-gram pattern is counted and converted into a real-valued input vector of the neural network.
NEURALNETWORKCLASSIFICATION
181
to residue insertion and deletion; and (3) it is independent from the a priori recognition of certain specific patterns. The major drawback of the n-gram method is that the size of the input vector tends to be large. This indicates that the size of the weight matrix (i.e., the number of neural interconnections) would also be large because the weight matrix size equals to w, where w = input size x hidden size + hidden size x output size. This prohibits the use of even larger n-gram sizes, e.g., the trigrams of amino acids would require 203 or 8000 input units. Furthermore, accepted statistical techniques and current trends in neural networks favor minimal architecture (with fewer neurons and interconnections) for its better generalization capability (Le Cun, et al., 1990). To address this problem, we have attempted different approaches to reduce the size of n-gram vectors. SVD (Singular Value Decomposition) Method. SVD, a new encoding method developed in this study, is used to reduce the size of n-gram vectors and to extract semantics from the ngram patterns. The method was adopted from the Latent Semantic Indexing (LSI) analysis (Deerwester, et al., 1990) used in the field of information retrieval and information filtering. The LSI approach is to take advantage of implicit high-order structure in the association of terms with documents in order to improve the detection of relevant documents which may or may not contain actual query terms. The particular technique used is SVD, in which a large "term-by-document" matrix is decomposed into a set of k orthogonal factors from which the original matrix can be approximated by linear combination. In the present study, the term-by-document matrix is replaced by the "term-by-protein" matrix to represent n-gram patterns (terms) of different protein sequences. The reduced model (Fig. 3) can be shown by: X ~- Y = T S P '
(1)
where X = the original term-by-protein matrix, of rank m (m < min(t, p)), Y = approximation of X, of rank k (k < m), T = matrix of left singular (s) vectors corresponding to k-largest s-values, P = matrix of right s-vectors corresponding to k-largest s-values, and S = diagonal matrix of k-largest s-values. Note that (a) both T and P have orthonormal columns, and (b) if X is used to represent the original term-by-protein matrix for training sequences, then P becomes the reduced matrix for the training sequences (Fig. 3a, also see example below). The representation of unknown sequences (Fig. 3b) is computed by "folding" them into the k-dimensional factor space of the training sequences, that is, the unknown sequences are projected onto the span of the right s-vectors of training sequences. The folding technique, which amounts to placing sequences at the centroid of their corresponding term points, can be expressed by: Pu = X~uTS-1
(2)
where Pu = the reduced term-by-protein matrix of unknown sequences, Xu = the original term-by-protein matrix of unknown sequences, T = matrix of left s-vectors computed from Eq. (1) during training phase, S -1 = inverse of S, which reflects scaling by reciprocals of corresponding s-values. The following is an example that illustrates how SVD vectors are computed for a data set of 1000 training sequences and 500 prediction sequences using the a3 (trigram of amino acids) n-gram encoding. In this example, the original matrix is a 8000 x 1000 matrix
182
C, WU ET AL.
(a) Training Proteins
Terms (N-Grams) kxk
txp
kxp
txk
(b) Prediction Terms
Xu'
T kxk
pux k
pux t
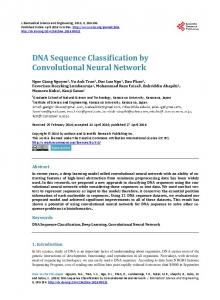
txk Figure 3. The singularvalue decomposition(SVD) of a "term-by-protein"matrix. (a) The originalmatrix (X) is approximatedusing the k-largest singular(s) values and their correspondings-vectors (Eq. (1) in text). P is the matrix of the right s-vectors, and is the reduced matrix for trainingsequences, t and p, the numbersof rows and columnsof X, are the numberof originalterms obtainedfrom n-gramencoding,and the numberof training sequences, respectively, k is chosen number of dimensionsin the reduced model. The dimensionof the (erm vector of a givensequenceis reduced from t to k, as shownin shaded area. (b) The reducedmatrixfor prediction sequences(Pu) is computedusinga "folding"technique(Eq. (2) in text). Pu is the numberof unknownsequences in the predictionset. Again,the dimensionof the term vectorof an unknownsequenceis reduced from t to k, as shown in shaded area.
that represents 8000 (203) terms of 1000 training proteins. This large and sparse term-byprotein matrix is decomposed into singular triplets, i.e., the s-values and the corresponding left and right s-vectors (Fig. 3a). With k being the chosen number of dimensions in the reduced model, the right s-vectors corresponding to the k-largest s-values (matrix P ) are then used as input vectors for training neural networks. In the example, i f a 100-dimensional representation is used, the size of the input vector would be reduced from 8000 to 100 (i.e., from t to k, as shown in shaded areas of Fig. 3a). Similarly, a 8000 × 500 matrix would be used to represent the 8000 a3 n-gram terms of 500 prediction proteins. The term vectors of 8000 dimensions are then reduced to 100 dimensions using the folding technique described in Eq. (2) (shown in shaded areas of Fig. 3b). The amount of dimension reduction, i.e., the choice of k, is critical to network performance. The value of k, determined heuristically in our study, should be large enough to fit all the real structure in the data, but small enough so that it does not attempt to fit
NEURALNETWORKCLASSIFICATION
183
0.06-
1
0.04
¢.
0-
~,
-0,02-
-0.04-0.06-
~J
I-"-
-0.08-
........
-'-
2i
I
-0.1 4
12 Input Vector
la
20
Positions
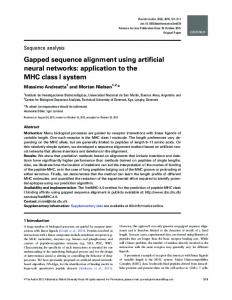
Figure 4. The input vectors derivedfrom the SVD methodfor a 8000 x 894 "term-by-protein"matrix. The right singular vectors correspondingto the 20-largest singular values are plotted. 1-1, 1-2, 21-1, and 21-2 represents the first and second sequence entries of superfamily 1, and the first and second sequence entries of superfamily 21, respectively.
unimportant details. A 100-dimensional representation appears to be optimal in the present study. As in the n-gram method, each component value of the vector is scaled between 0 and 1 before input to the neural network. Figure 4 plots the right s-vectors corresponding to the 20-largest s-values computed from a term-by-protein matrix. While the s-vectors of sequences within the same family are similar, the s-vectors of different superfamilies (i.e., superfamilies 1 vs. 21) are very different. Therefore, as with the n-gram sequence encoding method, the SVD method also satisfies the basic coding assumption.
Neural Network Architecture
The neural networks used in this research are three-layered, feed-forward networks (Fig. 1) that employs back-propagation learning algorithm (Wu, et al., 1992). In the three-layered architecture, the input layer is used to represent sequence data, the hidden layer to capture information in non-linear parameters, and the output layer to represent sequence classes. The size of the input layer (i.e., number of input units) is dictated by the sequence encoding schema chosen. In the n-gram encoding method, the size is m n where m is the size of the alphabet. In the SVD encoding method, the size is the number of dimensions (k) chosen in the reduced model. The output layer size is determined by the number of classes represented in the network, with each output unit representing one sequence class. The hidden size is determined heuristically, usually a number between input
184
c. w o ET AL.
Database M o d u l e 1 (EO)
Amino Acid Sequence
PreProcessor
Input Layer
Hidden Layer
I 2 218 Output Layer
Database Module 2 (TR)
~ Input Layer
Hidden Layer
PostProcessor
Protein SuperfaInilyl Family
219 220 458 Output Layer
Database Module 3 (HY)
Database Module 4 (LI)
Figure 5. The modular neural network architecture. A database module is used to train one or a few protein functional groups containing many superfamilies. Each module is a three-layered, feed-forward, back-propagation neural network. During the training phase, each module is trained separately. During the prediction phase, the unknown sequences are classified on all modules with classification scores combined.
and output sizes. The networks are trained using weight matrices initialized with random weights ranging from - 0 . 3 to 0.3. Other network parameters included the learning factor of 0.3, momentum term of 0.2, a constant bias term of -1.0, and error threshold of 0.01. For full-scale system, a modular network architecture (Wu, 1993) that involves multiple independent neural networks, termed database modules, is used to embed the large PIR database (Fig. 5). During the training phase, each network module is trained separately using the sequences of known superfamilies (i.e., training patterns). During the prediction phase, the unknown sequences (prediction patterns) are classified on all modules with classification results combined.
System Implementation
Program Structure The system software has three components: a preprocessor to create from input sequence files the training and prediction patterns, a neural network program to classify input patterns, and a postprocessor to summarize classification results. The preprocessor has two programs, one for n-gram extraction, the other for SVD computation. The SVD program employs a single-vector Lanczos method (Berry, 1992) and is part of the SVDPACKC package (available from Netlib). All programs have been implemented on the Cray Y-MP8/864 supercomputer of the Center for High Performance Computing of the University of Texas System.
NEURALNETWORKCLASSIFICATION
185
Data Sets
The present protein classification system is trained with sequences from the PIR database (Barker, et al., 1993) and classifies new protein sequences into superfamilies/families. The PIR database has three sections, PIR 1 for annotated and classified entries, PIR2 for annotated but not classified sequences, and PIR3 for unverified entries. In PIR1, sequence entries are organized into superfamilies, families, subfamilies, entries and subentries by assigning to each entry a set of numbers that uniquely specifies both its order (or placement) in the database and its relationship to other entries (Barker, et al., 1993.). The five-number classification distinguishes groups of proteins that are homologous over the majority of their lengths. A superfamily is a group of proteins that share sequence similarity due to common ancestry, and sequences within a superfamily have a less than 10 -6 probability of similarity by chance. The PIR2 database contains annotated entries that may or may not be assigned superfamily name or superfamily placement number. The PIR2 entries used in our data sets are the ones with superfamily assignment. Full-Scale System. A full-scale system has been implemented using PIR1 database, release 36.0 (March 31, 1993). As summarized in Table 1, the system has thirteen network modules to partition different protein functional groups. All the annotated sequences (11,252 PIR1 entries) are separated into a training set (8695 entries) and a prediction set (2557 entries) by using every third entries of superfamilies that have more than two entries for prediction. There are a total of 3071 superfamilies (i.e., superfamily placement numbers 1.0 to 3071.0). For superfamilies that have than 50 entries, we further used the placement numbers for families for second-level classification, which results to a total of 3311 protein classes (superfamilies/families). Other Data Sets. In addition to the full-scale system, three other data sets compiled from PIR1 and PIR2 databases are used to evaluate system performance and the new SVD encoding method (Table 2). All the additional data sets are implemented on singlemodule neural networks. The second data set (Table 2) is compiled from the fifty largest superfarnilies, whose sizes (i.e., number of entries) range from 471 to 25. The total of 3004 PIR1 sequence entries is divided into disjoint training and prediction sets, with every third entry chosen as prediction pattern. The third data set consists of a training set of 3004 PIR1 entries (from the 50 largest superfamilies) and a prediction set of 182 PIR2 entries of globin, the largest superfamily in PIR database. The last data set is used to develop a family classification system for the globin superfamily, which contains a total of 34 families. All 471 PIR1 globin entries are used for training, and 182 PIR2 globin entries are used for prediction.
System Evaluation Evaluation Mechanism
The predictive accuracy is expressed with three terms: the total number of correct patterns (true positives), the total number of incorrect patterns (false positives), and the total number of unidentified patterns (false negatives). The sensitivity is the percentage of total correct
186
C. WU ET AL.
Table 1.
Database modularization for the PIR database, release 36.0. Superfamilies/familiesl
Database module EO TR HY LI PG IH
FL
PM BP AD AR PH HP
Protein functional groups
(Begin-End) SF
Electron transfer proteins, Oxidoreductases Transferases Hydrolases Lyases, Isomerases, and Ligases Protease inhibitors, Growth factors, Hormones, and Toxins Immunoglobulin-related, Heme carrier, Chromosomal, and Ribosomal proteins Fibrous, Contractile system, Lipid-associated proteins, and Miscellaneous Plant, Membrane, and Organelle proteins Bacterial, Bacteriophage, Plasmid, and Yeast proteins Animal DNA, and Large DNA viral proteins Animal RNA, and Plant viral proteins Phage proteins Hypothetical proteins
Total SF SF + F
Number of entries (Train + pred)
Total
(1-173) (174-390) (391-606)
173 217 216
218 240 226
(760 + 257) (626 + 179) (658 + 204)
1017 805 862
(607-782)
176
181
(540 + 171)
711
(783-985)
203
222
(784 + 271)
1055
(986-1158)
173
257
(1224+ 469)
1693
(1159-1334)
176
205
(681 + 236)
917
(1335-1510)
176
176
(385 + 101)
486
(1511-1839)
329
329
(475 + 63)
538
(1840-2255)
416
416
(915 + 236)
1151
(2256--2537) (2538-2904) (2905-3071)
282 367 167
307 367 167
(1008+ 344) (460 + 22) (179 + 4)
1352 482 183
(1-3071)
3071
3311
(8695+ 2557)
11252
Total
1The Begin-End number shown in parenthesis is the superfamily (SF) placement number. The total number shown is for superfamily only (SF), or for both supeffamily and family (SF + F). Table 2.
Data sets for neural network training and prediction.
Data set
Number of classes
1. 2. 3. 4.
3311 SF/F1 50 SF 50 SF 34 F
Full-Scale Largest 50 Largest 50/Globin Globin
Training
Prediction
Database #Seq Database PIR1 PIR1 PIR1 PIR 1
8695 2020 3004 471
PIR1 PIR1 PIR2 PIR2
#Seq 2557 984 182 182
1The protein classes determined may be superfamilies (SF) or families (F).
patterns, the specificity is 1 - - t h e percentage of total incorrect patterns. A s e q u e n c e entry is considered to be accurately classified if its classification matches the target value (the k n o w n class n u m b e r o f the entry) with a classification score above the threshold (i.e., the c u t - o f f v a l u e ) . T h e classification score ranges f r o m 1.0 for perfect match to 0.0 for no match. T h e predictive accuracy is m e a s u r e d at two stringencies. The high stringency selects the
NEURALNETWORKCLASSIFICATION
187
first-fit (the superfamily/family with highest score) at a threshold 0.9. The low stringency condition for the full-scale system is the first five-fits (the superfamilies/families with five highest scores) with a threshold of 0.1. The low stringency condition for single-module systems is the first-fit with a threshold of 0.1. At the lower stringency condition, more classes would be identified, which results in a higher sensitivity (more true positive), but a lower specificity (more false positive). A detail analysis was performed for data set three by comparing the results of neural network method with the Blast (Altschul et al., 1990) and Fasta programs. The degrees of sequence identity of unknown sequences to training sequences were determined by the Fasta and Blast programs and the Fastdb program of the IG Suite (IntelliGenetics, Inc., Mountain View, CA).
Performance of Full-Scale System The ael2 n-gram encoding method, the best among 25 encoding methods tested before (Wu, et al., 1992), was used in the full-scale system. The input vector of the ael2 n-gram is concatenated from vectors representing four separate n-grams, namely, al (monograms of amino acids), el (monograms of exchange groups), a2 (bigrams of amino acids), and e2 (bigrams of exchange groups). The vector has 462 units, which is the sum of the four vector sizes (i.e., 20 + 6 + 400 + 36). The neural network architecture for each individual module, thus, is 462 x 50 x n, where n is the number of protein classes in the module, which ranges from 167 to 416 (Table 1). The training of the thirteen networks took a total of about 10 CPU hours on the Cray. (The time has been reduced to less than two Cray CPU hours recently by using a new pattern selection strategy (Wu & Shivakumar, in press) to train back-propagation networks). Among the 8695 training patterns, 8374 (96.31%) are trained after 800 iterations. Majority of the remaining "untrainable patterns" belong to single-membered or double-membered superfamilies/families, as one would expect. The prediction of the 2557 entries on all thirteen networks took less than 2 CPU minutes on the Cray, which averaged to less than 0.05 CPU seconds per sequence. At a threshold of 0.1, 2099 (82.09%) patterns are correctly classified as first-fit, and 83, 31, 37, and 19 patterns are correctly classified as second-fit, third-fit, fourth-fit, and fifth-fit. Thus, if we consider the top five fits (among a total of 3311 possible classes) as correct classification, then the predictive accuracy of the full-scale system is 88.74% (Table 3, Data Set 1). However, the remaining 288 (11.26%) patterns are incorrectly classified (i.e., they are false positives). To make the "mega-classification" helpful, one can use a much higher threshold to reduce the number of false positives. At a threshold of 0.9, although only 1755 (68.63%) patterns are correctly classified, the incorrectly classified entries have reduced to 25 (0.98%). The remaining 30.39% entries are not classified at this threshold. Again, most of the entries failed to be classified (correctly predicted) by the neural nets are those that belong to single-membered or double-membered superfamilies. It was observed in previous study (Wu, 1993) that the superfamily size is inversely correlated with the misclassification rate. Indeed, when only the fifty largest superfamilies are used, more then 98% of the sequences are correctly classified as the first-fit at a threshold of 0.1; and close to 90% of the entries are classified with a classification score of more than 0.9, with no false positives (Table 3, Data Set 2).
188
C. WU ET AL.
Table 3. The predictiveaccuracy of the proteinclassificationsystem. Data set
Encoding method
Network configuration
N-gram 462 x 50 x n N-gram 462 x 30 x 50 N-gram 462 x 30 x 50 SVD 100 x 30 x 50 Combined 482 x 30 x 50 Average3 (SVD,N-gram) Average (SVD,combined) N-gram 462 x 30 x 34 SVD 100 x 30 x 34 Combined 482 x 30 x 34 Average (SVD, N-gram) Average (SVD,combined)
Patterns Accuracyat 0.1 (%) Accuracy at 0.9 (%) trained (%) CorrectI Incorr U n i d Correct2 Incorr Unid 96.31 99.95 100.00 99.97 99.97
99.79 100.00 99.79
88.74 98.17 95.60 96.70 96.70 97.80 99.45 94.94 96.63 95.51 96.63 96.63
11.26 1.73 4.40 2.75 3.30 2.20 0.55 3.93 3.37 4.49 3.37 3.37
0.00 0.10 0.00 0.55 0.00 0.00 0.00 1.12 0.00 0.00 0.00 0.00
68.63 89.74 89.01 90.66 89.56 93.96 94.51 81.46 82.02 80.34 87.64 89.32
0.98 0.00 0.00 0.00 0.00 0.00 0.00 0.00 0.00 0,00 0.00 0.00
30.39 10.26 10.99 9.34 10.44 6.04 5.49 18.5z[ 17.98 19.66 12.36 10.67
1The number of correct patterns are measured at a cut-offclassificationscore of 0.1, countingthe first five-fits for the full-scalesystem(data set 1) and first-fitonly for single-modulesystems (data sets 2--4). 2The numberof correct patterns are measured,countingfirst-fitonly,at a thresholdof 0.9 for n-gram,SVD, and combinedresults, and at a threshold of 0.5 for the averageresults. 3The average results are obtained by averagingthe classificationscores of the designated encodingmethods shown in parentheses.
Performance of SVD Method Several studies have been conducted to compare the n-gram and SVD sequence encoding methods. The SVD method was evaluated using many different n-gram vectors. Among more than ten n-gram vectors tested, a23e4 gave the best SVD result. The a23e4 n-gram vector concatenates a2 (bigram of amino acids), a3 (trigram of amino acids), and e4 (tetragram of exchange groups) vectors, and has a size of 9696 (i.e., 400 + 8000 + 1296). The SVD method is used to compute reduced models of 20 to 200 dimensions and decrease the size of the input vector from 9696 to 20-200. The 100-dimensional representation appears to be optimal, and is used for the results presented in Table 3. The comparativeresults of the a e l 2 n-gram encoding and the a23e4 SVD encoding show that, for both Data Sets 3 and 4, the predictive accuracy is improved with the SVD method, even though the sizes of the input vectors and the weight matrices are reduced. One can also combine the n-gram vector with the SVD vector to improve predictive accuracy. The method shown in Table 3 combines the ael2 n-gram vector with a 20-dimensional SVD vector of a23e4, and has an input vector size of 482 (i.e., 462 + 20). Since the classification results of these different methods are complementary, one can also average the classification scores from different methods. The average of the SVD method and combined method provides the best result of all (Table 3): not only the sensitivity of the prediction is increased with the average, the specificity is also improved. Similar results (i.e, average is better than SVD alone, and SVD is better n-gram) are observed in many other data sets (not shown). Analysis of patterns correctly classified with the SVD method, but missed by the n-gram method, seems to indicate that SVD is particularly robust for fragmentary sequences.
NEURALNETWORKCLASSIFICATION
189
The improved classification accuracy of the SVD method may result from the representation of high-order structure (semantics) of the n-gram words (Deerwester, et al., 1990). It may also be attributed to additional sequence information embedded in the a3 and e4 n-grams. It would be difficult to input the a3 and/or e4 n-gram vectors directly to the neural network without a reduction: it would be too large (with 8000 and/or 1296 input units), and the vector would be too sparse (too many zeros) for the neural network to be trained effectively. While the SVD encoding of training sequences requires a computationally intensive and iterafive processing, the folding of unknown sequences involves only simple matrix multiplications and runs very fast. Furthermore, the SVD computation time for unknown sequences is determined by the size of n-gram vectors (t in Fig. 3), and independent of the number of training sequences (p in Fig. 3). Thus, the speed of our classification method would not be constrained by the rapid growth of database even with the SVD preprocessing.
Analysis of the Neural Network Results To make the neural network a useful tool, further studies were conducted to evaluate the weakness of the system. It has been shown (Wu, 1993) that most sequences misclassifled: by the neural networks are fragmentary sequences, sequences of small superfamilies and/or distantly related sequences. A detailed analysis was performed for the globin superfamily using data set three (Table 2), which has 3004 training sequences including 471 globins and has 182 globin sequences for prediction. The neural network results (using the average of SVD and combined methods, Table 3) were compared with Blast and Fasta using the same data set (i.e., 182 query sequences were searched against 3004 library sequences). All three methods miss one pattern, and have a overall sensitivity of 99.45%. Figure 6a plots the neural network classification scores of all 182 sequence patterns according to their degrees of sequence identity to globin training sequences. Sequence pattern 1 (S01815), the only pattern misclassified by the neural network, is a sequence fragment of 41 amino acids long and has 52% sequence identity to a single-member family of the globin superfamily. Pattern 2 (PN0117), the only pattern missed by b~th Blast and Fasta, is only 15 amino acids long and has a 68% identity to sequence in a large family. Note that if sequence similarity is high, then sequence as short as eight residues long (pattern 3) can be correctly classified by the neural network. Also, full-length sequences can be classified correctly even if they share low sequence identities of less than 30% (patterns 4 and 5), and less than 40% to single-member family (pattern 6). The neural network classification scores seem to correlate quite well with the Blast (Fig. 6b) and Fasta (not shown) scores. As expected, all give lower scores to shorter sequences and sequences of more distant relationship. The different results are mainly due to the family size. The neural network tends to give a higher score and better result when the sequence is in a large family (e.g., patterns 2 and 5, Fig. 6b), but worse result when the sequence belongs to a single-member family (e.g., pattern 1). The specificity (ability to distinguish true and false positives) of the neural network system is similar to that of the Blast and Fasta methods, when evaluated using a negative prediction set of non-globin sequences (not shown).
190
c. w u ET aL.
(a)
_5
1 0"9 0.8 1 0.7 0.6-
•
•
•6 •
0g-
0.4 0.3 3
0.2
2
0.1 1
0 10
20
30 40 50 60 70 Sequence Identity (%)
80
90
100
(b) r-
0.9-
•"
0.8. 0.7.
/
o4e~6 7 w
i "~
0.6. 0.50.4. 0.3. 0.2.
s o
06
~
s
• ••
•
•
.3
0.1.
1
0 0
' ' '1•'
100
' ' I ....
200
I ' ' ' ' 1 ' " ' ' 1 '
300
400 500 Blast Score
f''l
....
600
I ' '''
700
800
Analysisof neural networkclassificationresults for the globin superfamily. (a) Classificationscores of 182 query (unknown)sequences(shownin dots) in relationshipto their degrees of sequenceidentityto globin trainingsequences. The resultsof six sequencepatterns (numberedin right uppercomerof the respectivedot) are discussed in the text. (b) Relationshipof neuralnetworkand Blast scores. The same six patternsare numberedas in (a) for comparisons. Figure 6.
Discussion This study extends our protein classification neural networks into a full-scale system. The system can classify unknown sequences into 3311 PIR superfamilies/families at a sensitivity of close to 90% and a speed of less than 0.05 Cray CPU second per sequence. The current speed of classification is about one to two orders of magnitude faster than other database search methods such as Fasta or Blast, and the rate gap will continue to widen. The overall classification accuracy of the neural network system, however, is slightly below that of Fasta or Blast, mainly due to sequences of small superfamilies. The continuing
NEURALNETWORKCLASSIFICATION
191
accumulation of sequence entries available for training is expected to improve the sensitivity of the neural network system. Meanwhile, sequences from other protein databases, including the Swiss-Prot protein sequence database (Bairoch & Boeckmann, 1993) and Blocks database (Henikoff & Henikoff, 1991), are being used as additional training sets with good preliminary results. This paper also introduces SVD as a new sequence encoding method to compress long and sparse n-gram input vectors and capture semantics of n-gram words. The method has made it possible to adopt minimal network architecture for better generalization capability (Le Cun, et al., 1990). In our previous studies (Wu, 1993), the number of weights trained in the networks exceeds by one to two orders of magnitude the number of training samples. The SVD computation can reduce the size of the network (i.e., input vector and weight matrix) by tens and hundreds of fold, and indeed, has improved the classification accuracy of the network. The SVD method also applies to nucleic acid sequences with very good results (Wu & Shivakumar, in press). The major applications of the classification neural networks are rapid sequence annotation and automated family assignment. The full-scale PIR classification system can be used as a filter program for other database search methods to minimize the time required to find relatively close relationships. As with other search methods, the major task for superfamily identification is to distinguish true positives from false positives. With the present system, a close to 100% specificity can be achieved at a high threshold of 0.9, with a more than 50% sensitivity. Therefore, one can use the tool to screen a large number of unknown protein sequences and give true identifications to more than half of the query sequences quickly. The system can then be run at a lower threshold and classify another 30 to 40% unknown sequences into a reduced search space. The saving in search time will become increasingly significant due to the accelerating growth of the sequence databases. Unlike most other sequence comparison or database search methods in which search time depends strongly on database size, the neural network classification time is expected to remain low even if there is a 100 fold increase of sequence entries. The neural classification system can also be used to automate family assignment. An automated classification tool is especially important for the organization of database according to family relationships and for handling the influx of new data in a timely manner. Among all entries in the PIR database, only less than 20% of them are classified and placed in PIR1. The neural network system is currently being used by the PIR database for superfamily/family identification of the sequences in PIR2 and PIR3 (in collaboration with Winona Barker of NBRF-PIR). The neural network tool is generally applicable to any databases that are developed according to family relationships because the neural network employs a"supervised" learning algorithm. The designs of the neural system can be extended to classify other nucleic acid sequences. A ribosomal RNA classification system has been developed to classify query sequences into 109 phylogenetic classes with a 100% accuracy at a rate of less than 0.3 CPU second per sequence on a workstation (Wu & Shivakumar, in press). Preliminary studies have also been conducted to classify DNA sequences (containing both protein-encoding regions and intervening sequences) directly into protein superfamilies with satisfactory resuits. It is, therefore, possible to develop a gene identification system that can classify indiscriminately sequenced DNA fragments. Presently, a distribution version of the neural network system has been developed and ported to several UNIX machines. The version, consisting of the prediction program and the
192
c. w u ET AL.
weight files obtained from off-line training, can be used for speedy on-line sequence classification. The system will be made available to the research c o m m u n i t y via an a n o n y m o u s ftp (please contact
[email protected] for details).
Acknowledgments This study is supported in part by grant n u m b e r R29 L M 0 5 5 2 4 from the National Library o f Medicine. T h e work is also supported by the University Research and D e v e l o p m e n t Grant P r o g r a m of the Cray Research, Inc. Its contents are solely the responsibility of the authors and do not necessarily represent the official views of the granting agencies. The authors wish to acknowledge the computer system support of the Center for High Performance C o m p u t i n g of the University o f Texas System.
References Altschnl, S.E, Gish, W., Miller, W., Myers E.W., & Lipman, D.J. (1990). Basic local alignment search tool, Journal of Molecular Biology, 215:403-410. Bairoch, A., & Boeckmann, B. (1993). The Swiss-Prot protein sequence data bank, recent developments, Nucleic Acids Research, Database Issue, 21(13):3093-3096. Barker, W.C., George, D.G., Mewes, H.-W., Pfeiffer, F., & Tsugita, A. (1993). The PIR-international databases. Nucleic Acids Research, Database Issue, 21(13):3038-3092. Berry, M.W. (1992). Large-scale sparse singular value computations, International Journal of Supercomputer Applications, 6:13-49. Bohr, H., Bohr, J., Brunak, S., Cotterill, R.M.J., Fredholm, H., Lautrup, B., & Peterson, S.B. (1990). A novel approach to prediction of the 3-dimensional structures of protein backbones by neural networks, FEBS Letters, 261:43-46. Boswell, D.R., & Lesk, A.M. (1988). Sequence comparison and alignment: the measurement and interpretation of sequence similarity, in A.M. Lesk (Ed.), Computational Molecular Biology: Sources and Methodsfor Sequence Analysis. New York: Oxford University Press. Dayhoff, J. (1990). Neural Network Architectures, An Introduction. New York: Nostrand Reinhold. Deerwester, S., Dumais, S.T., Furnas, Landaur, T.K., & Harshman, R. (1990). Indexing by latent semantic analysis. Journal of American Society.for Information Science, 41:391-407. Demeler, B., & Zhou, G. (1991). Neural network optimization for E. coli promoter prediction. Nucleic Acids Research, 19:1593-1599. Doolittle, R.F. (1990). Searching through sequence databases, in R.E Doolittle (Ed.), Molecular Evolution: Computer Analysis of Proteins and Nucleic Acid Sequences, Methods in Enzymology, VoL 183, New York: Academic Press. Farber, R., Lapedes, A., & Sirotkin, K. (1992). Determination of eukaryotic protein coding regions using neural networks and information theory, Journal of Molecular Biology, 226:471-479. Ferran, E.A., Pflugfelder, B., & Ferrara, P. (1994). Self-organizedneural maps of human protein sequences. Protein Science, 3:507-521. Gribskov, M., & Devereux, J. (Eds.) (1991). Sequence Analysis Primer. New York: Stockton Press. Harris, N., Hunter, L., & States, D. (1992). Megaclassification: discovering motifs in massive datastreams. Proceedings of the Tenth National Conference on Artificial Intelligence, San Jose, CA: AAAI Press. van Heel, M. (1991). A new family of powerful multivariant statistical sequence analysis techniques. Journal of Molecular Biology, 220:877-887. von Heijne, G. (1991). Computer analysis of DNA and protein sequences. European Journal of Biochemistry, 199:253-256. Henikoff, S., & Henikoff, J.G. (I 991). Automated assembly of protein blocks for database searching. Nucleic Acid Research, 19:6565-6572.
NEURAL NETWORK CLASSIFICATION
193
Hirst, J.D., & Sternberg, M.J.E. (1992). Prediction of structural and functional features of protein and nucleic acid sequences by artificial neural networks. Biochemistry, 31:7211-7218. Holley, L.H., & Karplus, M. (1989). Protein secondary structure prediction with a neural network, Proceedings of the National Academy of Science, USA, 86:152-156. Horton, P.B., & Kanehisa, M. (1992). An assessment of neural network and statistical approaches for prediction of E. coli promoter sites, Nucleic Acid Research, 20:4331--4338. Kneller, D.G., Cohen, EE., & Langridge, R. (1990). Improvements in protein secondary structure prediction by an enhanced neural network, Journal of Molecular Biology, 214:171-182. Le Cun, Y., Denker, J., & Solla, S. (1990). Optimal brain damage. In Advances in Neural Information Processing Syste~ 2. San Mateo, CA: Morgan Kaufman. O'Neill, M.C. (1992). Escherichia coli promoters: neural networks develop distinct descriptions in learning to search for promoters of different spacing classes. Nucleic Acid Research, 20:3471-3477. Pearson, W.R., & Lipman, DJ. (1988). Improved tools for biological sequence comparisons, Proceedings of the National Academy of Science, USA, 85:2444-2448. Qian, N., & Sejnowski, T.L (1988). Predicting the secondary structure of globular proteins using neural network models, Journal of Molecular Biology, 202:865-884. Rumelhart, D.E., & McClelland, J.L. (Eds.) (1986). Parallel Distributed Processing: Explorations in the Microstructure of Cognition, Volume 1: Foundations. Cambridge, MA: MIT Press. Stormo, G.D., Schneider, T.D., Gold, L., & Ehrenfeucht, A. (1982). Use of the 'Perceptron' algorithm to distinguish translation initiation sites in E. coli. Nucleic Acids Research, 10:2997-3011. Uberbacher, E.C., & Mural, R.J. (1991). Locating protein-coding regions in human DNA sequences by a multiple sensor-neural network approach, Proceedings of the National Academy of Science, USA, 88:11261-11265. Webb, A.R., & Lowe, D. (1990). The optimized internal representation of multilayered classifier networks performs nonlinear discriminant analysis, Neural Networks, 3:367-375. Wu, C.H. (1993). Classification neural networks for rapid sequence annotation and automated database organization, Computers & Chemistry, 17:219-227. Wu, C.H., Whitson,G., McLarty, J., Ermongkonchai, A., & Chang, T. (1992). Protein classification artificial neural system, Protein Science, 1:667-677. Wu, C.H., & Shivakumar, S. (in press). Back-propagation and counter-propagation neural networks for phylogenetic classification of ribosomal RNA sequences, Nucleic Acids Research. Received October 12, 1993 Accepted July 27, 1994 Final Manuscript August 18, 1994