In [5], the quaternary levels spacing optimisation has been performed for null ... formulas for the optimum power levels were presented and ... to thank FCT for supporting this work also under contract ... The optical receiver includes an optical preamplifier with ... of a polariser ensures that only one polarisation mode of the.
ON THE QUATERNARY LEVEL SPACING SIGNALLING OPTIMISATION FOR INCREASING THE TRANSMISSION DISTANCE IN OPTICAL COMMUNICATION SYSTEMS João L. Rebola and Adolfo V. T. Cartaxo Abstract Four-level (quaternary) signalling in optical communication systems is investigated and the optimisation of quaternary signal level spacing is carried out considering signalamplified spontaneous emission beat noise dominance. The optimised quaternary signal is propagated through an optical dispersive fibre and sensitivity improvements can be found for shorter transmission distances and non-zero extinction ratio.
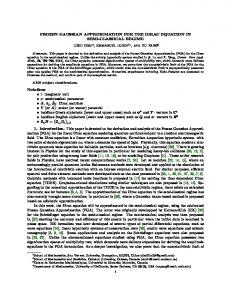
II. SYSTEM MODEL The block diagram of the lowpass equivalent optical system is shown in Fig. 1.
H f (f)
Modulator
Optical preamplifier
sPIN(t)
I. INTRODUCTION Four-level (quaternary) optical signaling has frequently been proposed to increase the transmission distance of an optical communication system [1-5]. However, in these works, quaternary signals with equally spaced levels have been assumed, when it is known that equally spaced levels can only lead to an optimised performance whether all levels exhibit the same noise power. In optically preamplified systems, the noise dependent on signal is usually the main contribution to noise power. Therefore, the optimum level spacing is, in general, different from equal spacing. Suitable design of the levels spacing can lead to improvements in the performance of optically preamplified systems. In [5], the quaternary levels spacing optimisation has been performed for null extinction ratio. In [6], the optimisation of level spacing, for arbitrary extinction ratio in quaternary optical communication systems has been carried out, and simple formulas for the optimum power levels were presented and discussed. However, the analysis performed in [6] considered only the signal-amplified spontaneous emission (ASE) beat noise term, and the level spacing optimisation was accomplished by neglecting intersymbol interference (ISI). In this work, the optimisation of the quaternary signal is carried out considering also the ASE-ASE beat noise term, and the improvement of system performance using nonequally spaced quaternary signaling is investigated in backto-back and after propagation of the optimised quaternary signal in an optical dispersive fibre. ____________________________________ J. Rebola and A. Cartaxo are with the Optical Communications Group, Dept. Electrical and Computers Engineering, Instituto de Telecomunicações, Instituto Superior Técnico, Pólo I, 1049-001 Lisboa, Portugal. This work was supported by FCT and POSI within project POSI/35576/CPS/2000 - DWDM/ODC. J. Rebola would like to thank FCT for supporting this work also under contract SFRH/BD/843/2000.
Polariser
G
H o,l(f) Optical filter
PIN
Sampling
iPIN(t)
H r(f)
Decision circuit
Electrical filter i(t)
Fig. 1 Block diagram of lowpass equivalent optical system.
The optical signal is generated by an external modulator and launched in the optical fibre. In the absence of fibre nonlinearities and polarisation dispersion, the lowpass transfer function of a lossless linear dispersive singlemode fibre of length L can be written as [7] λ2 H f ( f ) = exp jπ o LD ⋅ f 2 c
(1)
where c is the speed of light, λo is the optical wavelength corresponding to the carrier frequency and D is the fibre chromatic dispersion parameter at λo. The optical receiver includes an optical preamplifier with flat gain G, which adds ASE noise to the signal. The presence of a polariser ensures that only one polarisation mode of the signal and noise fields is considered at the optical filter input. The lowpass equivalent transfer function of the optical filter, Ho,l(f), is assumed ideal with a flat frequency response in the bandwidth Bo. The filtered preamplified lowpass equivalent optical signal, sPIN(t), incident on the PIN photodetector is converted to a current signal, iPIN(t), by the PIN. The PIN photodetector is a square-law detector with responsivity Rs, and its output current is given by [7]
i PIN (t ) = R s s PIN (t )
2
(2)
The subsequent electrical circuitry is modelled by a lowpass electrical filter, Hr(f), which is considered to have a -3dB bandwidth much higher than the bit rate B, in order to avoid introduction of ISI on the transmitted signal. Then, its output current i(t) is sampled and a decision circuit decides on the transmitted symbols.
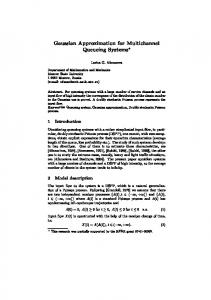
III. BIT ERROR PROBABILITY CALCULATION Consider Fig. 2 for the quaternary signal.
Pav =
‘3’
P3
i1 − i 0 = (C − r )R s GP3
‘2’ F2
P1 = CP3
‘1’
‘0’
Constant power levels at the receiver input corresponding to the ‘0’, ‘1’, ‘2’ and ‘3’ symbols are assumed. P0 is the lower power level, P1, P2 are the intermediate levels and P3 is the higher power level. We set P2 = AP3 and P1 = CP3, where the parameters A and C are to be optimised, being r ≤ C ≤ A ≤ 1 . The extinction ratio is defined by [8] r = Po P3
(3)
Considering zero ISI, adopting a Gaussian distribution for noise at the decision circuit input, and defining the threshold levels so that both signal levels, which define a given eye, equally contribute to the symbol error probability [8] Fm − i m −1 i m − Fm = σ m −1 σm
with m=1,2,3
(4)
where m = 1 corresponds to the inferior eye, m = 2 to the intermediate eye and m = 3 to the superior eye; i0, i1, i2 and i3 are the currents at the sampling time at the input to the decision circuit; and σ0, σ1, σ2 and σ3 are the noise standard deviations for the symbols 0, 1, 2 and 3, respectively, the threshold levels are defined by Fm =
i m−1σ m + imσ m−1 σ m + σ m −1
(5)
i −i 1 i1 − i 0 + Q 2 1 Q σ +σ 4 σ 0 + σ 1 2 1
i −i + Q 3 2 σ +σ 3 2
(6)
where the function Q(x) is defined by [8] ∞
1
x
2π
Q(x) = ∫
e
−
ξ2 2
dξ
(10)
i3 − i 2 = (1 − A)R s GP3
(11)
K K GR s Pn + I ASE 2 4
(12)
where Pn is the average power of level n (n=0,1,2,3) and IASE is the average current due to the ASE noise and is given by I ASE = R s S ASE Bo
(13)
where SASE is the ASE noise power spectral density which is given by
S ASE = n sp (G − 1)hν
(14)
where nsp is the spontaneous emission factor and hν is the photon energy. K is defined by K=
4 I ASE I 2 Bo
(15)
where I2 is the bilateral Personick’s integral. By using (6) and after some algebraic manipulation, the bit error probability can be expressed in terms of A and C by
1 2 4GRsCPav 1 4GRsrPav 1 Pb = Q + I ASE − + I ASE + 4 K 1 + A + C + r 2 1+ A + C + r 2 1 + Q 4 1 + Q 4
2 4GRs APav 1 4GRsCPav 1 + I ASE − + I ASE + 1+ A + C + r 2 K 1+ A + C + r 2 2 4GRs Pav 1 4GRs APav 1 + I ASE − + I ASE 1+ A + C + r 2 K 1+ A + C + r 2 (16)
Assuming a Gray coding, the bit error probability can be expressed as Pb - qua =
i 2 − i1 = (A − C )R s GP3
σ n2 =
Fig. 2 Quaternary signal representation with non-null extinction ratio.
(9)
The noise powers associated with each symbol are given approximately by [9]
F1 P0 = rP3
(8)
Considering Fig. 2, at the decision circuit input, we have
F3 P2 = AP3
1+ A + C + r P3 4
(7)
For equally likely symbols, the average optical power is given by
The minimisation of expression (16) with respect to A and C permits to obtain the optimum levels spacing that minimises the error probability. By assuming that each Qfunction in the sum in (16) presents the same dependence on its argument, we expect that the minimum value of expression (16) occurs when the three terms are equal. Equating the various terms of Q( ) in this way, and solving the obtained system, the optimum values of A and C are given, respectively, by Aopt =
H 1− r + 2 6
where H is defined by
and
C opt =
H 1− r − 2 6
(17)
[
]
(18) and W depends on the average power, Pav, and is defined as W = 8 Pav GRs
(19)
0.75 0.7 Optimum A and C
2
I I 15(1 + r ) + 8 36(1 + r )2 ASE + 14(1 + r )2 + 16r ASE + 9r W W H= I 27 + 48 ASE W
A
C
0.65 0.6 0.55 0.5 0.45 0.4 0.35
In [6], optimum values for A and C were found considering only the signal-ASE beat noise term. By setting IASE to zero, expressions (17) degenerate in expressions presented in [6]. For this case, the optimum values are given, respectively, by and
C opt
1 + 4 r + 4r = (20) 9
The optimum values of A and C given by (20) are only extinction ratio dependent, and have also the advantage of not depending on the signal average power. IV. NUMERICAL RESULTS In this section, the influence of ASE-ASE beat noise term on the A and C optimisation is investigated. The receiver performance is compared for A and C given by (17) and (20). The system parameters considered are: G=30dB, nsp=1.5, Rs=1.25A/W, B=40Gbit/s and Bo=320GHz.
0.01
0.1
1
Fig. 4 - Dependence of optimum A and C on IASE/W for r=0.123. 0.8 0.75 Optimum A and C
Aopt
4+4 r +r = 9
0.3 1E-07 1E-06 1E-05 0.0001 0.001 I ASE /W
A
C
0.7 0.65 0.6 0.55 0.5 0.45 0.4 1E-07 1E-06 1E-05 1E-04 0.001 0.01 I ASE /W
0.1
1
0.7 A
C
Fig. 5 - Dependence of optimum A and C on IASE/W for r=0.306.
0.5
0.9
0.4
0.85
Optimum A and C
Optimum A and C
0.6
0.3 0.2 0.1 0 1E-07 1E-06 1E-05 0.0001 0.001 I ASE /W
0.01
0.1
1
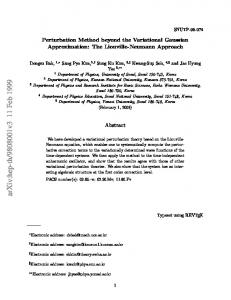
Fig. 3 – Dependence of optimum A and C on IASE/W for r=0.
In Fig. 3, 4, 5 and 6, the dependence of optimum A and C on the factor IASE/W is plotted, for the extinction ratio r=0, r=0.123, r=0.306 and r=0.520, respectively. The point IASE/W=0 corresponds to the optimum A and C given by (20). A back-to-back configuration (without fibre) was considered in these figures. We observe that the parameters A and C present a higher variation with the factor IASE/W for lower extinction ratios. This is expected because the ASE-ASE beat noise term has a higher influence on the bit error probability for these extinction ratio values. For higher extinction ratios, this influence can be neglected, and the simple expressions given by (20) are a good approximation to the A and C parameters given by (17).
A
C
0.8 0.75 0.7 0.65 0.6 1E-07 1E-06 1E-05 1E-04 0.001 0.01 I ASE /W
0.1
1
Fig. 6 - Dependence of optimum A and C on IASE/W for r=0.520.
In order to assess the system performance discrepancy with the optimised parameters given by (17) and (20), the system sensitivity is estimated. Fig. 7 and 8 depict the results achieved for r=0 and r=0.123, respectively, considering a back-to-back configuration. The sensitivity is derived for the error probability of 10-12. For r=0, the A and C values given by (20) are 0.44 and 0.11, respectively, and the sensitivity achieved is -19.65dBm; while for A and C given by (17), A=0.46 and C=0.13, the sensitivity achieved is -20.14dBm with IASE/W=1.59×10-3. A discrepancy of 0.5dB is observed between the two pairs (A,C) for the null extinction ratio. For
Sensitivity [dBm] 0.15
9.2
−19
.8
9.4
−1
−19
0.145
−1
9.6
Optimised
-13 -17 -21
.8
−19 .4 19
−20
-25 0
.6
−
9 −1
−2
8
12
16
20
L [km]
Fig. 9 System sensitivity as function of fibre length L, with r=0.
−19.8
−
4
−20
0
.8 19
0.13
C
Quadratic
−1
0.14
0.135
Equally spaced
-9 Sensitivity [dBm]
r=0.123, the difference between the maximum sensitivities achieved is practically negligible for the two pairs (A,C). The IASE/W value obtained for this extinction ratio is 5.70×10⁻⁴. We can conclude that expressions (20) are a good approximation for expressions (17) even for the most critical case, r=0, since the ratio IASE/W is kept below about 10-3.
0.125 −20
-6
0.12
Equally spaced
−19.8
−19.8 −19.6
0.11
−19.6
−19.4 −19.4
0.105
−19.4 0.1 0.42
0.43
0.44
−19.2 0.46
0.45
0.47
0.48
0.49
A
Fig. 7 Receiver sensitivity as function of A and C with r=0. The dashed and continuous arrows refer to the optimum A and C obtained with (17) and (20), respectively. Sensitivity [dBm] 3 5.
2 5. −1
C
5
−15
−15.5
0.325
−14.9
−
15.6
−15.3
−15.4
3
5.
5 −1
−15.1
−15.2
.5
−15
.4
−1
5.
−1
0.61
0.615
0.62
0.625
0.63
−15.3
−15.4 0.605
−15.1
−1
−15 .6 0.31 0.6
5
5.
−15.6
−15
0.315
−14.9
−15.2
5.
6
−1
0.32
-14 -16 -18 -20 4
8
12
16
20
Fig. 10 System sensitivity as function of fibre length L, with r=0.123.
0.335
0.33
-12
L [km]
5.4
−1
−1
5 −1
1
5.
Optimised
-10
0
0.34
−1
Quadratic
-8
.6
−19
Sensitivity [dBm]
0.115
0.635
0.64
0.645
0.65
A
Fig. 8 Receiver sensitivity as function of A and C with r=0.123. The dashed and continuous arrows refer to the optimum A and C obtained with (17) and (20), respectively.
The optimum levels spacing presented before was derived by neglecting ISI. In order to evaluate the ISI influence on optimised and non-optimised levels spacing, the propagation of the signal through an optical dispersive fibre is considered. The optical fibre parameters are D=17ps/(km-nm) and λo=1550nm. The ISI influence on the bit error probability is estimated using the exhaustive Gaussian approximation [10]. Fig. 9 and 10 present the results achieved with r=0 and r=0.123, respectively. Three quaternary signals are considered: the optimised levels distribution with A and C given by (17); the quadratic levels distribution with A and C given by (20); and the quaternary signal with equally spaced levels.
In Fig. 9 and Fig. 10, we observe that shorter transmission distances are bridged for the optimised and quadratic distributions. For a maximum power penalty of 3dB relative to the back-to-back configuration, with r=0, only 3km are obtained with the optimised and quadratic distributions, against the 16km obtained with the equally spaced level signal. For r=0.123, the optimised and quadratic distributions lead only to slightly shorter transmission distances. Fig. 11 and 12 depict the eye-diagrams at the decision circuit input, respectively, for the equal and optimised distributions, for L=0 and L=1.5km, with r=0. We observe that, from 0 to 1.5km, the eye-diagrams remain basically the same for both distributions. For the equally spaced signal (Fig. 11), as the lower eye has a bigger aperture than in the optimised and quadratic case, the sensitivity degradation observed in Fig. 9 is practically negligible. For the quadratic and optimised distributions the lower eye is more sensitive to signal-ASE beat noise increase due to smaller eye-opening and dominance of ASE-ASE beat noise for symbol ‘0’ and L=0km. In Fig. 12, from L=0 to 1.5km, the signal-ASE beat noise increase induces a considerable power penalty in the lower eye. This can be seen in Fig. 13, where the noise standard deviations are depicted for the optimised distribution with r=0, for L=0 and L=1.5km. The ASE-ASE and signalASE beat noise standard deviations are shown, respectively, by σ ASE − ASE and σ s− ASE .
For r=0.123, the relative increase of the signal-ASE beat noise power with transmission distance is almost negligible and the sensitivity degradation is almost absent. The optimised and quadratic distributions lead to about 1dB sensitivity improvement for transmission distances up to about 8km.
1.2
1
1
0.8
0.8
Amplitude
Amplitude
1.2
0.6 0.4 0.2
0.6 0.4
V. CONCLUSIONS
0.2
0
0
-0.2
-0.2 1
6
11
16
21
26
31
1
6
11
Normalised time
16
21
26
31
Normalised time
a) L=0km b) L=1.5km Fig. 11 Eye-diagrams at the decision circuit input for the equally spaced signal. 1.2
1
1
0.8
0.8
Amplitude
Amplitude
1.2
0.6 0.4
0.6 0.4
0.2
0.2
0
0
-0.2
-0.2 1
6
11
16
21
26
31
VI. REFERENCES 1
6
11
Normalised time
16
21
26
31
Normalised time
a) L=0km b) L=1.5km Fig. 12 Eye-diagrams at the decision circuit input for the optimised signal.
Standard deviation [A]
1.E-06 1.E-07 σ ASE-ASE
1.E-08 1.E-09 1.E-10
σ s-ASE -L =0km
σ s-ASE -L =1.5km
1.E-11 1.E-12 0
0.5
The performance of a quaternary optical communication system has been optimised in terms of level spacing using the formulas presented in this work, for signal-dependent noise dominance. Through appropriate simplification, these general formulas give the formulas presented in [6]. The receiver performance differences obtained with the optimised parameters given by the two formulas are not significant, and are observed especially for very low extinction ratio. It was also shown that the optimised level spacing signal leads to better system performance for low transmission distances. However, for long haul transmission distances, the equally spaced levels signal leads to a better or similar performance, because the optimised level spacing signal is very sensitive to the increase of the signal-ASE beat noise observed in symbol ‘0’, mainly for very low extinction ratios.
1
1.5
2
Time [ns] Fig. 13 Noise standard deviations.
Notice that for L=0km, the ASE-ASE beat noise power contribution can be higher than the signal-ASE beat noise power for symbol with lower power level. Thus, the threshold level F1 can be very near the lower amplitude level of the eye-diagram. Furthermore, this threshold level is more sensitive to the increase of the signal ASE-beat noise power. For L=1.5km, an enormous increase of the signal-ASE beat noise power leads to a remarkable increase of F1, and therefore, a significant degradation of sensitivity is expected.
[1] B. Wedding et al., “40Gbit/s quaternary dispersion supported transmission over 31km standard singlemode fibre without optical dispersion compensation”, ECOC’ 98, pp. 523-524, Sep. 1998. [2] W. Idler et al., “Field trial at 40Gbit/s over 28.6km and 86km of standard singlemode fibre using quaternary dispersion supported transmission”, Electr. Lett., pp. 2425-2426, Dec. 1998. [3] P. Goulart, A. Cartaxo, “Increasing the transmission distance of 40Gbit/s 4-level DST system”, NOC’ 98-II, pp. 236-243, 1998. [4] B. Wedding et al., “Multi-level dispersion supported transmission at 20Gbit/s over 46km installed standard singlemode fibre”, ECOC’ 96, pp. 91-94, Sep. 1996. [5] S. Walklin, J. Conradi, “Multilevel signaling for increasing the reach of 10Gb/s lightwave systems”, J. Lightwave Tech., pp. 2235-2248, Nov. 1999. [6] J. Rebola, A. Cartaxo, “Optimization of level spacing in quaternary optical communication system”, ICAPT’ 2000, June 2000. [7] L. Kazovski, S. Benedetto, A. Willner, “Optical fiber communication systems”, Artech House, Cha. 2, 1996. [8] G. Keiser, “Optical fibre communication”, McGrawHill, Ch. 7, 2nd edition, 1991. [9] E. Desurvire, “Erbium-doped fiber amplifiers, principles and applications”, John Wiley & Sons, Inc., Ch. 3, 1994. [10] J. Correia, A. Cartaxo, “Rigorous assessment of the impact of intersymbol interference on the performance of optically preamplified receivers”, Conftele’ 97, pp. 293-296, April 1997.