Aug 7, 2007 - At times, researching outside of my field was rough, but in the end it gave me a great ..... Simply stated, MD is a microscopic form of computer simulation where ...... keeps the center of mass of each layer fixed at an initial value.
Numerical Simulation of Viscous Flow: A Study of Molecular Dynamics and Computational Fluid Dynamics Jeremy Fried Thesis submitted to the faculty of the Virginia Polytechnic Institute and State University in partial fulfillment of the requirements for the degree of
MASTER OF SCIENCE in Electrical Engineering
Pushkin Kachroo, Chairman A. Lynn Abbott Douglas K. Lindner
Keywords: molecular dynamics, Navier-Stokes, computational fluid dynamics, discretization, finite-difference, Poiseuille flow
August 7, 2007 Blacksburg, Virginia
Copyright 2007, Jeremy Fried
Numerical Simulation of Viscous Flow: A Study of Molecular Dynamics and Computational Fluid Dynamics by Jeremy Fried
(ABSTRACT) Molecular dynamics (MD) and computational fluid dynamics (CFD) allow researchers to study fluid dynamics from two very different standpoints. From a microscopic standpoint, molecular dynamics uses Newton’s second law of motion to simulate the interatomic behavior of individual atoms, using statistical mechanics as a tool for analysis. In contrast, CFD describes the motion of a fluid from a macroscopic level using the transport of mass, momentum, and energy of a system as a model. This thesis investigates both MD and CFD as a viable means of studying viscous flow on a nanometer scale. Specifically, we investigate a pressure-driven Poiseuille flow. The results of the MD simulations are processed using software we created to measure velocity, density, and pressure. The CFD simulations are run on numerical software that implements the MacCormack method for the Navier-Stokes equations. Additionally, the CFD simulations incorporate a local definition of viscosity, which is usually uncharacteristic of this simulation method. Based on the results of the simulations, we point out similarities and differences in the obtained steady-state solutions.
ACKNOWLEDGEMENTS First, I would like to thank my advisor, Dr. Pushkin Kachroo, for his guidance and insight during my research. At times, researching outside of my field was rough, but in the end it gave me a great sense of accomplishment. I would also like to thank my committee members, Dr. A. Lynn Abbott and Dr. Douglas K. Lindner, for serving on my committee and for their helpful remarks on my thesis. I also want to thank my parents, Mark and Mary Fried, for their help and encouragement throughout the past 7 years of college; my best friend and sister, Erin Fried, for helping me stay motivated through the hard times; and finally my cousins, Jen and Ryan Fried, and my aunt and uncle, Kevin and Sherry Fried, for their support over the years. Finally, I want to thank all of the friends that I’ve made in Blacksburg over the past 7 years. Specifically, there are six I would like to thank: Matt and Christy Cooper, Mike Ziray, Steve Blyskal, Katie Pehowski, and Andrea Ludwig. They have done everything from enduring my questions on fluid dynamics to providing much needed distractions to giving me a place to live for weeks at a time. Thanks guys.
- Jeremy
iii
TABLE OF CONTENTS 1 Introduction
1
2 Molecular Dynamics
4
2.1
Introduction . . . . . . . . . . . . . . . . . . . . . . . . . . . . . . . . . . . . . . . . .
4
2.2
Force Calculation . . . . . . . . . . . . . . . . . . . . . . . . . . . . . . . . . . . . . .
5
2.2.1
Dimensionless Units . . . . . . . . . . . . . . . . . . . . . . . . . . . . . . . .
6
2.2.2
Potential Truncation . . . . . . . . . . . . . . . . . . . . . . . . . . . . . . . .
7
2.2.3
Neighbor Lists . . . . . . . . . . . . . . . . . . . . . . . . . . . . . . . . . . .
8
Time Integration . . . . . . . . . . . . . . . . . . . . . . . . . . . . . . . . . . . . . .
9
2.3.1
Verlet Method . . . . . . . . . . . . . . . . . . . . . . . . . . . . . . . . . . .
9
2.3.2
Predictor-Corrector Method . . . . . . . . . . . . . . . . . . . . . . . . . . . .
10
2.4
Periodic Boundary Conditions . . . . . . . . . . . . . . . . . . . . . . . . . . . . . . .
10
2.5
Relation to Statistical Mechanics . . . . . . . . . . . . . . . . . . . . . . . . . . . . .
11
2.3
3 Computational Fluid Dynamics
13
3.1
Introduction . . . . . . . . . . . . . . . . . . . . . . . . . . . . . . . . . . . . . . . . .
13
3.2
Governing Equations of Fluid Dynamics . . . . . . . . . . . . . . . . . . . . . . . . .
13
3.2.1
The Navier-Stokes Equations . . . . . . . . . . . . . . . . . . . . . . . . . . .
13
3.2.2
Equations of State . . . . . . . . . . . . . . . . . . . . . . . . . . . . . . . . .
15
3.2.3
Boundary Conditions
. . . . . . . . . . . . . . . . . . . . . . . . . . . . . . .
16
3.2.4
Transport Coefficients . . . . . . . . . . . . . . . . . . . . . . . . . . . . . . .
16
3.2.5
Dimensional Analysis . . . . . . . . . . . . . . . . . . . . . . . . . . . . . . .
17
3.2.6
Flow Classifications . . . . . . . . . . . . . . . . . . . . . . . . . . . . . . . .
18
iv
3.3
The Finite Difference Method . . . . . . . . . . . . . . . . . . . . . . . . . . . . . . .
18
3.4
CFD Methods . . . . . . . . . . . . . . . . . . . . . . . . . . . . . . . . . . . . . . . .
21
3.4.1
Explicit vs. Implicit . . . . . . . . . . . . . . . . . . . . . . . . . . . . . . . .
21
3.4.2
The MacCormack Method . . . . . . . . . . . . . . . . . . . . . . . . . . . . .
22
4 Literature Review
24
4.1
Transport Coefficients . . . . . . . . . . . . . . . . . . . . . . . . . . . . . . . . . . .
24
4.2
Wall Models . . . . . . . . . . . . . . . . . . . . . . . . . . . . . . . . . . . . . . . . .
25
4.3
Poiseuille Flow . . . . . . . . . . . . . . . . . . . . . . . . . . . . . . . . . . . . . . .
26
4.4
Methods of Comparison . . . . . . . . . . . . . . . . . . . . . . . . . . . . . . . . . .
27
5 Simulation Software 5.1
5.2
29
LAMMPS - Large-scale Atomic/Molecular Massively Parallel Simulator . . . . . . .
29
5.1.1
Pre-processing . . . . . . . . . . . . . . . . . . . . . . . . . . . . . . . . . . .
30
5.1.2
Post-processing . . . . . . . . . . . . . . . . . . . . . . . . . . . . . . . . . . .
31
Navier-Stokes Solver . . . . . . . . . . . . . . . . . . . . . . . . . . . . . . . . . . . .
32
6 Simulation
34
6.1
Introduction . . . . . . . . . . . . . . . . . . . . . . . . . . . . . . . . . . . . . . . . .
34
6.2
MD Simulations
. . . . . . . . . . . . . . . . . . . . . . . . . . . . . . . . . . . . . .
34
6.2.1
Initial and Boundary Conditions . . . . . . . . . . . . . . . . . . . . . . . . .
34
6.2.2
Analysis . . . . . . . . . . . . . . . . . . . . . . . . . . . . . . . . . . . . . . .
37
CFD Simulations . . . . . . . . . . . . . . . . . . . . . . . . . . . . . . . . . . . . . .
41
6.3.1
Initial and Boundary Conditions . . . . . . . . . . . . . . . . . . . . . . . . .
41
6.3.2
Analysis . . . . . . . . . . . . . . . . . . . . . . . . . . . . . . . . . . . . . . .
42
Physical Scale . . . . . . . . . . . . . . . . . . . . . . . . . . . . . . . . . . . . . . . .
46
6.3
6.4
7 Suggestions for Future Work
47
8 Appendix A
53
8.1
Sample LAMMPS Input File . . . . . . . . . . . . . . . . . . . . . . . . . . . . . . .
53
8.2
MD Post-processing Python Code
. . . . . . . . . . . . . . . . . . . . . . . . . . . .
55
8.3
Navier-Stokes Solver (Implements the MacCormack method) . . . . . . . . . . . . .
62
v
8.3.1
main.cpp . . . . . . . . . . . . . . . . . . . . . . . . . . . . . . . . . . . . . .
62
8.3.2
props.h . . . . . . . . . . . . . . . . . . . . . . . . . . . . . . . . . . . . . . .
65
8.3.3
props.cpp . . . . . . . . . . . . . . . . . . . . . . . . . . . . . . . . . . . . . .
66
8.3.4
computations.h . . . . . . . . . . . . . . . . . . . . . . . . . . . . . . . . . . .
69
8.3.5
computations.cpp . . . . . . . . . . . . . . . . . . . . . . . . . . . . . . . . . .
71
8.3.6
U.h
. . . . . . . . . . . . . . . . . . . . . . . . . . . . . . . . . . . . . . . . .
81
8.3.7
F.h . . . . . . . . . . . . . . . . . . . . . . . . . . . . . . . . . . . . . . . . . .
82
8.3.8
dissipation.h . . . . . . . . . . . . . . . . . . . . . . . . . . . . . . . . . . . .
83
8.3.9
logs.h . . . . . . . . . . . . . . . . . . . . . . . . . . . . . . . . . . . . . . . .
88
8.3.10 logs.cpp . . . . . . . . . . . . . . . . . . . . . . . . . . . . . . . . . . . . . . .
88
vi
LIST OF FIGURES 2.1
A neighbor list illustrated visually. The grey circle shows the interaction range and outer circle shows extra range, ∆r. All particles breaking the plane of the outer circle are considered in the list. . . . . . . . . . . . . . . . . . . . . . . . . . . . . . . . . .
8
2.2
A two-dimensional MD simulation with periodic images of itself. . . . . . . . . . . .
11
3.1
Structured grid. . . . . . . . . . . . . . . . . . . . . . . . . . . . . . . . . . . . . . . .
19
6.1
Geometry of the Poiseuille flow with flow in the x-direction. Lz can be interpreted as coming out of the page. . . . . . . . . . . . . . . . . . . . . . . . . . . . . . . . . . .
6.2
The MD simulation in its initial FCC configuration. Wall atoms are red and fluid atoms are black. . . . . . . . . . . . . . . . . . . . . . . . . . . . . . . . . . . . . . .
6.3
38
MD density plot. The top plot has a channel width of 15 and the bottom plot has a channel width of 20. . . . . . . . . . . . . . . . . . . . . . . . . . . . . . . . . . . . .
6.5
36
MD streaming velocity plots fitted with a second degree polynomial. The top plot has a channel width of 15 and the bottom plot has a channel width of 20. . . . . . .
6.4
35
39
MD pressure plot. The top plot has a channel width of 15 and the bottom plot has a channel width of 20. . . . . . . . . . . . . . . . . . . . . . . . . . . . . . . . . . . .
40
6.6
CFD streaming velocity plot with corresponding analytical solutions on a 50 × 50 grid. 43
6.7
CFD density plot on a 50 × 50 grid. . . . . . . . . . . . . . . . . . . . . . . . . . . .
44
6.8
CFD pressure plot on a 50 × 50 grid. . . . . . . . . . . . . . . . . . . . . . . . . . . .
45
vii
LIST OF TABLES 3.1
Finite difference expressions . . . . . . . . . . . . . . . . . . . . . . . . . . . . . . . .
20
6.1
Initial density conditions for MD simulations. . . . . . . . . . . . . . . . . . . . . . .
35
6.2
CFD initial conditions. . . . . . . . . . . . . . . . . . . . . . . . . . . . . . . . . . . .
41
6.3
CFD boundary conditions. . . . . . . . . . . . . . . . . . . . . . . . . . . . . . . . . .
42
viii
Chapter 1
Introduction Historically, viscous flow problems are solved using principles of classical fluid dynamics. This methodology is based on equations that describe fluid characteristics using a macroscopic approach. Since the creation of the field, fluid dynamics has evolved to describe more complex flows, allowing for characteristics such as turbulence, different boundary conditions, mixed fluids, and non-Newtonian fluids. However, the field broadened with the creation of computational fluid dynamics (CFD), which uses numerical simulation to solve flow problems that are otherwise unsolvable analytically. Currently, CFD is widely used in both research and design settings. Researchers are able to simulate environments, such as objects in a wind tunnel, using CFD, and obtain data that can be used as readily as that obtained from a physical experiment. The dynamic nature of CFD and reusability of experiments under different flow conditions have made CFD a common research tool. As a design tool, CFD is used to design aircraft, automobile engines, manufacturing applications, and a variety of environmental applications [AJ95]. However, fluid dynamics does not account for any interaction between individual atoms or molecules. As a result, extreme conditions such as turbulence, fluid behavior at walls, and other rheological phenomena are difficult to simulate accurately on a macroscopic scale. Additionally, modern systems are becoming smaller, often defined on molecular scales. As a result, an obvious alternative to classical fluid dynamics is Molecular Dynamics (MD). MD is a microscopic approach to simulation in which fluid characteristics are calculated using atomic definitions and intermolecular forces. Essentially, all molecular effects are taken into account, governed by Newtonian physics, stopping
1
short of the quantum level. MD has been used to successfully simulate microscopic systems such as blood flow, micro-electro-mechanical systems (MEMS), and biosensors [WV04][Sir06][Rap04]. The motivation behind this research lies in the difference between microscopic and macroscopic simulation. From a microscopic perspective, MD uses characteristics of molecules and intermolecular forces to define how the simulation runs. In contrast, CFD uses experimentally determined fluid properties, such as viscosity and thermal conductivity, together with partial differential equations that describe how a fluid flows as a continuum. Other microscopic simulation methods exist, such as the Monte Carlo (MC) method, Brownian dynamics, cellular automata, and Lattice Boltzmann methods. All of these methods have apparent limitations when applied to fluid dynamics problems. MC and Brownian dynamics both use stochastic processes for simulation and can only be used to study systems at equilibrium. Cellular automata and Lattice Boltzmann methods, while considered computationally efficient forms of simulation, are spatially discrete methods. Lattice symmetry and the limited range of particle velocities often restrict these methods to specific types of problems. In comparison to other microscopic methods, MD, although computationally expensive, has few limitations [Rap04]. The research presented in this thesis investigates the viability of using both MD and CFD to obtain solutions for small systems. Specifically, we are interested in characteristics of viscous flow. Considerable research has been performed over the last 20 years investigating this type of flow from a MD standpoint. CFD requires that transport properties, such as viscosity and thermal conductivity, of a fluid are clearly defined before attempting a simulation. In contrast, MD requires that only properties of atoms be defined. Using the results of MD simulations, transport coefficients can be measured and used as input to CFD simulations [KTE97]. In this work, we focus on isothermal Poiseuille flow (flow between two plates) of a monatomic fluid. This specific type of flow can be solved analytically as well as numerically. We are interested to see if the results of both methods of simulation agree with known analytical solutions. We conduct MD simulations of a Poiseuille flow at various channel widths. We use equilibrium molecular dynamics (EMD) to measure quantities such as velocity, density, and pressure. These quantities are time-averaged to provide a higher degree of accuracy. CFD simulations are carried in a similar manor, using microscopic definitions of pressure and shear viscosity. These results are compared to analytical solutions as well. Chapter 2 presents background information on MD, explaining the foundations of the subject
2
and methods for running MD simulations. Similarly, Chapter 3 presents background information on CFD, starting with the governing equations of fluid dynamics. Finite differencing techniques will be described and applied to these equations as well. Chapter 4 is a literature review of methods of measuring macroscopic flow properties, Poiseuille flow using MD, and methods for comparing MD and CFD. Chapter 5 introduces the software used in both MD and CFD simulations, including an explanation on the software, as well as any additions and we made to existing software. Chapter 6 introduces the simulations and their results. Finally, in Chapter 7 we discuss future work.
3
Chapter 2
Molecular Dynamics 2.1
Introduction
Simply stated, MD is a microscopic form of computer simulation where the time evolution of a system of atoms is governed by Newton’s laws of motion. Due to a lack of computational power, it was not until digital computers were invented that MD became a viable method of simulation. With the aid of modern computing, it is possible to numerically solve the equations of motion and use statistical mechanical theory to measure quantities of interest, such as temperature, pressure, and density. Though the core theory remains the same, MD simulations can be used for a variety of applications such as phase transition, polymers, biomolecules, and fluid dynamics [Rap04]. MD simulations can be broken into two categories: hard sphere and soft sphere. The first published MD simulation was a hard sphere simulation conducted by Alder and Wainwright [AW57]. In hard sphere systems, particles interact through instantaneous collisions and travel uninhibited between these collisions. While the results of early hard sphere simulations are very significant, soft sphere simulations have proven to produce more realistic results [Rah64]. Soft sphere systems use a potential energy calculation between particles to govern their movement. We use a soft sphere formulation in this thesis. In this chapter, we focus exclusively on monatomic systems in three-dimensional space. More complex molecular systems can be simulated using MD, but for the purposes of this work, monatomic systems suffice. We will introduce force calculations that govern the atomic interaction and integra-
4
tion methods to calculate subsequent velocities and positions. Additionally, several optimizations can be made to decrease simulation times, such as neighbor lists, potential truncation, and periodic boundary conditions. Finally, we investigate how MD relates to statistical mechanics and how this relation can be used to apply constraints in simulations.
2.2
Force Calculation
In a soft sphere MD simulation, atomic interaction is calculated based on the potential energy between individual particles. The interactions are, in general, described by interatomic forces between particles. In nature, these forces are defined as f = −∇U (r)
(2.1)
where U (r) is a potential energy function. The behavior of a simulation is largely based on the choice of potential function(s). Potential functions of interest are largely based on the Born-Oppenheimer approximation that electrons adjust to movement faster than nuclei. Therefore, particle interaction based on the movement of nuclei is valid [Bor27]. As a result, potential functions are based on the N-body problem, where each body represents a paritcle. While two-body potentials are the most common, many-body potentials have been used to simulate metals such as liquid silicon [SW85], but are not in wide use due to their computational complexity. The simplest two-body potential function can be written as the sum of pairwise interactions of particles i and j at positions ri and rj ,
U (r1 , ..., rN ) =
XX i
u(rij )
(2.2)
j>i
where rij = ri − rj and rij ≡ |rij |. The most common two-body potential is the Lennard-Jones (12-6), or L-J potential. It is used as a generic potential for simulations not involving specific substances. Other variations with different exponents exist, but they are mainly used for specific purposes, namely atomic walls [Rap04]. In the monatomic case, the L-J potential is defined as " u(rij ) = 4�
σ rij
5
!12 −
σ rij
!6 # (2.3)
where σ is defined as the finite distance at which the potential is zero and � governs the strength of interaction. Both values depend on the physical properties of the substance in question. It should be noted that most potential functions only accurately describe the behavior of a small number of substances. For example, the 12-6 L-J potential is commonly used in simulations involving liquid argon [Rah64]. The L-J potential characterizes atomic interaction by its strongly repulsive core and weakly attractive tail. That is, atoms are repulsive at close range and attractive at long range. The 1/r12 term dominates short range behavior based on the Pauli exclusion principle. In atomic terms, the principle states that no two electrons in a single atom can have the same four quantum numbers, consequently creating a repulsive force caused by overlapping electron orbitals. Similarly, the 1/r6 term dominates at long range, modeling the attractive nature between atoms commonly referred to as van der Waals’ force. This force is caused by dipole-dipole attraction [Hai97]. Combining equations 2.1 and 2.3 shows the force that atom j exerts on atom i to be 48� fij = 2 σ
"
σ rij
!14
1 − 2
σ rij
!8 # (2.4)
Given equation 2.4 and Newton’s second law (F = ma), it is trivial to compute the acceleration of the atom in question. Additionally, Newton’s third law implies that fij = −fji , so the potential calculation need only be performed once on each pair of atoms.
2.2.1
Dimensionless Units
Typically, physical quantities measured in MD simulations are represented by dimensionless, or reduced, units. Dimensionless units provide several computational benefits, such as numerical values close to unity and simplifying the equations of motion. However, the most useful benefit of using dimensionless units is that a single model represented in dimensionless units can be scaled for different problems. Using σ, m, and � as units of length, mass, and energy respectively, dimensionless
6
quantities for length, energy, time, pressure, and density are defined as: length:
r → rσ
(2.5a)
energy:
e → e� p t → t mσ 2 /�
(2.5b)
pressure:
p → pσ 3 /�
(2.5d)
density:
ρ → ρσ 3 /m
(2.5e)
time:
2.2.2
(2.5c)
Potential Truncation
The L-J potential calculates the potential energy between two atoms using every atom in the substance, as characterized by its infinite attractive tail. However, this is not computationally feasible for most simulations and can produce lengthy simulation times. As a result, it is necessary to truncate the interaction described by the L-J potential. A cutoff radius of either 2.5σ or 3.0σ is used in most MD literature. A specific example of truncation is the Weeks-Chendler-Anderson (WCA) potential. This potential uses a cutoff radius of 2(1/6) σ, making it a short range, purely repulsive potential function [Hai97]. However, the truncating at a cutoff radius, rc , causes a discontinuity in energy conservation and actual atomic motion, with atoms separated at a distance close to rc moving in and out of interaction range repeatedly [Rap04]. The solution is to smear the discontinuity by shifting it slightly. The shifted L-J potential function is given by du(r) (r − rc ) u(r) − u(rc ) − dr us (r) = r=rc 0
if r < rc (2.6) if r ≥ rc
This new shifted potential function effectively eliminates the discontinuity in both u(r) and u0 (r) across the entire range of interaction. While effective, this shifted function alters the potential energy when r < rc . Consequently, some researchers ignore the small amount of error caused by truncation and simply rely on the truncated potential function [Hai97].
7
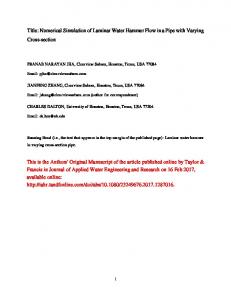
Figure 2.1: A neighbor list illustrated visually. The grey circle shows the interaction range and outer circle shows extra range, ∆r. All particles breaking the plane of the outer circle are considered in the list.
2.2.3
Neighbor Lists
The most computationally intensive part of an MD simulation is calculating the forces between pairs of particles. For a potential function without a cutoff radius, it is necessary to evaluate forces for every pair within the simulation region. However, the use of a truncated potential function greatly reduces the number of interaction pairs, and subsequently the number of pairs worth investigating. Evaluating pairs of particles separated by a distance greater than rc is wasteful, necessitating the need for a method that is less computationally intensive. Originally developed by Verlet [Ver67], the neighbor-list method constructs a list of pairs found using a separation length of rn = rc + ∆r, where all particles within a radius of rn are considered in force calculations. The result is a list that is valid over a period of several timesteps. While non-interacting pairs are included in the list, ∆r ensures that no new interacting pairs will appear over the period of valid timesteps. The value of ∆r is normally inversely related to the rate at which the list must be rebuilt. Typically, for fast computation of a liquid rc ≈ 0.3 [Hai97]. Figure (2.1) shows a visual representation of a neighbor list.
8
2.3
Time Integration
Using time integration techniques, it is possible to determine the velocity and position of a particle from its acceleration. There are a variety of different numerical methods available, however the nature of MD simulations has narrowed down the field to a handful of methods. Methods which require more than one force calculation per timestep are considered wasteful and can only be considered if the timestep can be proportionally increased, while still maintaining the same accuracy. Similarly, adaptive methods that change the timestep dynamically are useless due to the rapidly changing surroundings of each atom. As a result, only two methods have become mainstream in MD. They are the Verlet method and predictor-corrector method[Rap04]. Both methods are based on finite difference techniques, derived from the Taylor expansion of the coordinates r(t).
2.3.1
Verlet Method
The Verlet method is accurate to order ∆t3 and tends to perform better than many higher-order methods from an energy conservation point of view [Rap04]. The basic form of the Verlet method is defined by the equation, r(t + ∆t) = 2r(t) − r(t − ∆t) + (∆t)2 a(t) + O(∆t4 )
(2.7)
where a(t) is the acceleration. Via the combination of the force calculation with Newton’s second law of motion, the acceleration is defined as a(t) = −(1/m)OU (r(t))
(2.8)
While not required for computation, the velocity variable can be found by using the equation v(t) =
[r(t + ∆t) − r(t − ∆t)] + O(∆t2 ) 2∆t
(2.9)
However, the truncation error of this equation is order ∆t2 rather than ∆t4 and future coordinates are required for computation. A variant of the Verlet method, called the velocity-Verlet method, addresses this problem by directly including the velocity in computation. As a result, particle velocities are known at the same timestep as coordinates, and the high-order accuracy of the method is maintained. Additionally, particle velocities are necessary for kinetic energy calculations, which play a critical role in most MD simulations [Hai97].
9
2.3.2
Predictor-Corrector Method
In general, predictor-corrector (PC) methods are multistep methods consisting of three steps: prediction, force evaluation, and correction. In the first step, the method predicts the acceleration, velocity, and position of the particles at t + ∆t with a Taylor series expansion. The second step computes the forces between particles using the predicted positions. The difference between the accelerations from the second step and predicted accelerations create an “error signal.” The final step uses the “error signal” to correct the predicted values, resulting in a correct configuration of particles [Hai97]. PC methods are normally of higher order than Verlet methods, but require more computation and storage space due to additional variables associated with each particle. In addition, a higher degree of accuracy also means that energy conservation within the simulation region is more accurate. The most common PC method used is the fifth-order Gear algorithm [Hai97].
2.4
Periodic Boundary Conditions
An important concept in microscopic simulation is modeling an infinite system given finite means. An MD simulation takes place in a container of some kind. Consider the case of a container with rigid boundaries against which atoms collide. In a macroscopic-sized system, one on with a large 2/3
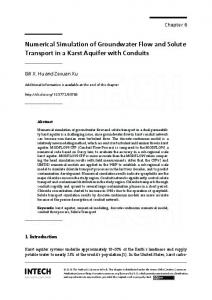
number of molecules, only a small fraction of the atoms reside near the walls (Nm where Nm is the number of atoms). However, a microscopic system with approximately 1000 atoms would contain nearly 500 atoms immediately next to its walls [Rap04]. The solution is the use of periodic boundary conditions (PBC) that make the simulation region equivalent to an infinite array of copies of itself as shown in figure (2.2). There are two consequences of period boundary conditions that must be addressed. First, an atom leaving the simulation region at one boundary reenters the region through the opposite boundary, creating a periodic image of itself. Second, atoms within a distance rc of a boundary interact with atoms near the opposite boundary. These two phenomena must be taken into account in both time integration and force calculation, adjusting algorithms accordingly. Additionally, a simulation region size of 2rc should be used to prevent an atom from interacting with multiple periodic images of other atoms [Rap04].
10
Figure 2.2: A two-dimensional MD simulation with periodic images of itself.
2.5
Relation to Statistical Mechanics
Statistical mechanics is used to obtain measurements of physical properties of any MD simulation. Ensemble averages that are measured using statistical mechanics are the same as time averages. This phenomena is known as the ergodic hypothesis [Hai97]. As the system evolves, time averages can be taken to obtain values of important physical properties. Any of these instantaneous properties can be tracked during a simulation. Measurement of a physical property can be obtained as a time average of instantaneous values over a finite period. For example, the time average of some fluctuating property A over a period of M measurements is defined as hAi =
M 1 X Aµ M µ=1
(2.10)
During a simulation, energy, temperature and pressure are often taken to ensure that the simulation i progressing realistically. Statistical mechanics consists of several ensembles depending on the desired constraints. The most common ensemble is the microcanonical (NVE) one. In this ensemble the number of particles
11
(N), the volume of the simulation region (V), and the total energy (E) of the system are kept constant using integration methods introduced in Section 2.3. The total energy of the system can be measured by taking the sum of the total potential and kinetic energy present in the system. The total potential energy is easily obtained from the potential function and the kinetic energy can be determined as KE(t) =
1X mi [vi (t)]2 2 i
(2.11)
where t is the current timestep, i is the current particle, m is the mass of a particle, and v is the velocity of the current particle. Several other common ensembles are also of use in a broader range of problems. Constanttemperature experiments employ the canonical (NVT) ensemble. The temperature is kept constant through the use of a thermostat. Popular thermostat methods include a Gaussian thermostat [BC84], and a Nose-Hoover thermostat [Nos84a][Nos84b][Hoo85]. Similarly, the isothermal-isobaric (NPT) ensemble can be used if a constant pressure is needed. In addition to a thermostat, a barostat is also required. However, adjusting the simulation volume and rescaling atomic coordinates can also be an effective method [Rap04].
12
Chapter 3
Computational Fluid Dynamics 3.1
Introduction
In this chapter, we introduce the conservation laws and numerical methods that encompass CFD. We consider the modelling of two-dimensional flow as described by the well-known Navier-Stokes equations for compressible viscous flow. Of the numerical methods available, we focus on finite difference methods (FDM) and an explicit solution algorithm to form the difference equations that solve the Navier-Stokes equation set. Additionally, we discuss boundary conditions, flow classifications, and implicit and explicit numerical algorithmic formulations.
3.2 3.2.1
Governing Equations of Fluid Dynamics The Navier-Stokes Equations
The Navier-Stokes equations comprise a set of equations that quantify three fundamental conservation laws of physics: • a. Conservation of mass • b. F = ma (Conservation of momentum) • c. Conservation of energy
13
In equation form, these laws are interpreted as time-varying, parabolic partial differential equations. They are written as Continuity equation ∂ρ + ∇ · (ρV) = 0 ∂t
(3.1)
Momentum equations x component: ∂ρu ∂p ∂τxx ∂τyx + ∇ · (ρuV) = − + + + ρfx ∂t ∂x ∂x ∂y
(3.2)
∂p ∂τxy ∂τyy ∂ρv + ∇ · (ρvV) = − + + + ρfy ∂t ∂y ∂x ∂y
(3.3)
y component:
Energy equation V2 D e+ ρ Dt 2
!
∂ ∂T = ρq˙ + k ∂x ∂x
!
∂ ∂T + k ∂y ∂y
!
∂up ∂vp ∂uτxx ∂uτyx ∂vτxy ∂vτyy − − + + + + + ρf · V ∂x ∂y ∂x ∂y ∂x ∂y where - ρ is the density - V is the velocity vector - u and v are the x and y velocities respectively - p is the pressure - τ is the stress tensor - f is the force - e is the internal energy - k is the thermal conductivity coefficient - q˙ is the heat transferred by thermal conduction - T is the temperature 14
(3.4)
The stress tensor, τ , is split into dimensional components that describe the proportionality of the shear stress to the rate of strain in a fluid (i.e. the velocity gradients). These values are commonly referred to as the Stokes relations and are defined as τxx = λ(∆ · V) + 2µ
∂u ∂x
(3.5a)
τyy = λ(∆ · V) + 2µ
∂v ∂y
(3.5b)
"
τxy = τyx
∂v ∂u =µ + ∂x ∂y
# (3.5c)
where µ is the molecular (or shear) viscosity coefficient and λ is the second viscosity coefficient. Thicker fluids such as oils have a higher µ value than thinner fluids such as water. Not much is known about the second viscosity, so it is often approximated as λ = − 23 µ [Sch79] or ignored altogether. Fluids that can be described with these relations are called Newtonian fluids. The heat flux, q, ˙ is calculated from Fourier’s law of heat conduction, which states that the heat flux is proportional to the local temperature gradient. For example, in the x direction the heat flux is defined as q˙x = −k
∂T ∂x
(3.6)
where the thermal conductivity, k, defines the ability of the fluid to conduct heat. This expression, combined with a similar expression for the heat flux in the y direction, fully describes the transport of heat of a fluid within a region of interest.
3.2.2
Equations of State
Examining equations (3.1), (3.2), (3.3), and (3.4) it is apparent that there are six unknown, dependent flow-field variables (ρ, p, u, v, e, T ) and only four equations relating them. To obtain solutions for each of the unknowns, two additional equations are required. The first equation is a relation of the form p = p(ρ, T ). This equation is based on the assumption that the fluid is a perfect gas, which assumes intermolecular forces are negligible. This equation of state, commonly called the thermal equation of state, is written as p = ρRT
(3.7)
where R is the specific gas constant. Similarly, the seventh equation equation is a relation of the form e = e(T, p), which represents a thermodynamic relation between the unknown variables. For a 15
perfect gas, this equation of state, commonly called the caloric equation of state, is e = cv T
(3.8)
where cv is the specific heat at constant volume. The combination of the two equations of state and the Navier-Stokes equations creates a closed system that can be solved analytically or numerically.
3.2.3
Boundary Conditions
Though the equations introduced thus far are valid for many different types of flow problems, they differ depending on the geometry of the flow. For example, if a problem investigates aerodynamic flow, the shape of an F-14 greatly differs from that of a Boeing 747. Boundary conditions describe the differences in size and shape of these aircraft. There are three major types of boundary conditions: Dirichlet, Neumann, and mixed. Dirichlet boundary conditions specify a value at the boundary. For example, in viscous flow problems it can be assumed that physical boundaries satisfy a no-slip condition. This condition means that the relative velocity between a surface and a fluid is zero. Therefore, at the boundary u=v=0
(3.9)
Similarly, if a surface temperature Tw is known, Tw at the wall can be explicitly set to be T = Tw
(3.10)
Neumann boundary conditions specify a derivative at the boundary. For example, if Tw is not known, Fourier’s law can be used to calculate the heat flux q˙w at the wall with the equation ! ∂T q˙w = − k (3.11) ∂n w
Mixed boundary conditions incorporate elements of both Dirichlet and Neumann boundary conditions.
3.2.4
Transport Coefficients
Transport coefficients describe the material properties of a fluid. The most common transport coefficients are shear viscosity, bulk viscosity, and thermal conductivity. Shear viscosity and thermal conductivity were introduced with the Navier-Stokes equations in a previous section. Bulk viscosity 16
is defined as the resistance of a fluid to deform under shear stress in relation to the size of the fluid. It is generally assumed to be zero in aerodynamic simulations via the Stokes hypothesis [Ema98]. All of these coefficients are usually assumed to be constant, but in some situations they can depend on the local behavior of the fluid [Rap04]. Generally, the coefficients are experimentally obtained and the values used in the Navier-Stokes equations are taken from textbooks or other sources.
3.2.5
Dimensional Analysis
Two flows are said to be similar if they are geometrically similar and their dimensionless parameters are the same. These parameters depend on the physical properties of a fluid and the dimensions of the fluid volume. As a result, dimensionless units are a convenient method of comparing flow problems with similar geometries. Dimensionless variables for incompressible flow are written as p∗ = p/ρV02 , V∗ = V0 , t∗ = t/t0 = tV0 /L
(3.12)
where the subscript zero indicates a characteristic value and L represents a characteristic length. In compressible flow problems, the density and temperature are also included. The dimensionless variables for these properties are ρ∗ = ρ/ρ0 , T ∗ = T /T0
(3.13)
Often flow problems with similar geometries are compared using two important variables: the Reynolds number, Re, and Mach number, M . Re is a measure of the ratio of inertial forces to viscous forces and is commonly used to determine if a flow is laminar or turbulent. [AJ95]. It is calculated by Re =
ρV0 L µ
(3.14)
Laminar flow occurs when Re is low, where viscous forces are dominant. At higher values of Re, where inertial forces dominate, a turbulence model should be added to the Navier-Stokes equations to accurately model the flow. Laminar flow typically occurs when Re < 2100. M is the ratio of the characteristic speed V0 to the characteristic sonic speed a0 . There are five categories in which the flow can be characterized by Mach number: • sonic: M = 1 • subsonic: M < 1 17
• transonic: 0.8 < M < 1.2 • supersonic: 1.2 < M < 5 • hypersonic: M > 5 It can be calculated by M = V0 /a0 where a0 =
√
(3.15)
kRT0 is the characteristic sonic speed. The equations and boundary conditions used
are often contingent on the Mach number. Additionally, the value of the Mach number indicates the compressibility of the flow. For example, the Mach number of the simulations discussed in this document is kept < 1, meaning that the flow is barely compressible.
3.2.6
Flow Classifications
The conservation equations are parabolic, non-linear, coupled, and difficult to solve; however, they can often be simplified for given specific flow conditions. As they were presented in Section 2.1.1, the Navier-Stokes equations describe unsteady, compressible, viscous flow. They are unsteady due to transient terms, compressible due to variable density over space and time, and viscous due to the shear stress components. The most common simplification is for incompressible fluids, such as most liquids. In this simplification, ρ is assumed to be constant. The viscosity in such a system can also be simplified to the kinematic viscosity defined as ν = µ/ρ. Other common simplifications include inviscid flow and steady flow. A flow can be assumed to be inviscid at a very high Reynolds number. The standard equations for inviscid flow are called the Euler equations. They can be easily obtained by setting the stress tensor equal to zero. The Euler equations are commonly used to study supersonic flows [FP96]. Steady flow occurs when the flow field does not change with time. This type of flow requires a clearly defined velocity field that is constant in space. As a result, the transient terms in the Navier-Stokes equations can be dropped.
3.3
The Finite Difference Method
Compared to other methods, such as finite volume (FVM) and finite element (FEM), the FDM uses the differential form of the conservation laws and requires less computing power and storage space.
18
The two main factors in the simplicity of this method are the use of a discrete grid and the process of discretizing each partial derivative in the conservation laws. Both FVM and FEM operate on discrete sets of volumes and are based on the integral form of the conservation laws. To obtain a solution that closely approximates an analytical solution, the solution domain is broken into discrete points. For simplicity, this work focuses solely on a two dimensional structured grid, like the one shown in Figure (3.1). The spacing of the grid points can be uniform, ∆x and ∆y are the same, or non-uniform, ∆x and ∆y are different.
}
Δx
i-1, j+1 i, j+1
}
Δy
i+1, j+1
i-1, j
P i, j
i+1, j
i-1, j-1
i, j-1
i+1, j-1
Figure 3.1: Structured grid. Finite differencing involves replacing the partial derivatives with an algebraic difference quotient, most commonly based on a Taylor series expansion. For example, if ui,j is the x component of the velocity at point (i, j) then ui+1,j can be expanded about (i, j) as ! ! ! ∂u (∆x)2 ∂2u ∂3u ui+1,j = ui,j + ∆x + + ∂x ∂x2 2 ∂x3 (,j
i,j
Rearranging equation (3.16) to solve for (∂u/∂x)i,j , we obtain ! ∂u ui+1,j − ui,j = + O(∆x) ∂x ∆x
i,j
(∆x)3 + ... 6
(3.16)
(3.17)
i,j
where O∆x represents higher order terms. Equation (3.17) is commonly referred to as a forward difference. Table (3.1) contains a listing of common finite difference methods derived in a similar fashion.
19
Table 3.1: Finite difference expressions ! ∂u ∂x
First-order forward difference
=
ui+1,j −ui,j ∆x
=
ui,j −ui−1,j ∆x
i,j
! ∂u ∂x
First-order backward difference
i,j
! ∂u ∂x
Second-order central difference
=
ui+1,j −ui−1,j 2∆x
i,j
! ∂2u ∂x2
Second-order central second difference
=
ui+1,j −2ui,j +ui−1,j (∆x)2
i,j
! Second-order central mixed difference
2
∂ u ∂x∂y
=
ui+1,j+1 −ui+1,j−1 −ui−1,j+1 +ui−1,j−1 4∆x∆y
i,j
! ∂u ∂x
Second-order one-sided difference
=
−3ui +4ui+1 −ui+2 2∆x
i
At first glance, it may seem that the terms in equations (3.2), (3.3), and (3.4) containing viscous stresses and thermal conduction terms require second derivatives. However, since these terms themselves contain first derivatives, it is possible to use first-order approximations for these derivatives and then again for the derivatives that contain them. It should be noted that higher-order approximations can often provide greater accuracy, but at a trade-off. Higher-order difference expressions require more grid points and often take longer computation time than first-order expressions. As a result, a desired degree of accuracy and computation time should be taken into account when applying differencing expressions. At grid boundaries, the choice of difference method becomes limited. Forward, backward, and central differencing expressions may require grid points that are off the grid. As a result, a one-sided
20
difference expression like the one in Table (3.1), must be used. This type of difference quotient is mandatory at a boundary, but it may also be used internally.
3.4
CFD Methods
There are a variety of methods available for solving the Navier-Stokes equations using CFD. Commercial software packages in often use today, such as FLUENT and STAR-CD, often use the SIMPLE method [PS72] and its variants [Pat80][VDR84] for steady flows and the PISO method [RIIW86] for unsteady flows. Both of these algorithms use finite volume methods (FVM) capable of handling discontinuous solutions (shocks) and producing highly accurate results, most commonly for incompressible flow problems [FLU05]. However, since we are interested in a basic type of flow with an analytical solution that ensures a smooth solution, a FDM algorithm will suffice. The method used in this work is the MacCormack method [Mac69], which is a predictor-corrector version of the Lax-Wendroff method [LW64]. It maintains the second-order accuracy of the LaxWendroff method, while becoming more friendly to solving viscous flow problems. Even though the method has been supplanted in most CFD codes, it is still used in many applications of compressible flows. [LH02][Wtr01][SSG02].
3.4.1
Explicit vs. Implicit
CFD methods can be categorized into two different classifications of methods: explicit and implicit. The first methods developed for CFD were explicit methods. In an explicit method, each difference equation contains only one unknown and can be solved explicitly for this unknown using a time marching solution. That is, variables at grid points at time n + 1 are all calculated from known variable values at time n. Explicit methods are generally easier to setup and program. It should be noted that explicit methods can be unstable for large timesteps and thus longer runtimes for smaller timesteps are often necessary. In an implicit method, unknown variables are obtained at a given timestep by solving systems of difference equations simultaneously. Due to the large number of equations needed, often at least hundreds for each unknown, these complex calculations usually involve the manipulation of large matrices, requiring a lot of memory. These large matrices can be solved using a variety of direct or iterative solution methods, such as Gaussian elimination, the Jacobi method, or ILU decomposition
21
[VM95]. Despite the complicated nature of implicit methods, they are generally more stable that explicit methods. As a result, smaller timesteps can be used and result in shorter runtimes. Both the SIMPLE and PISO methods are pressure-velocity implicit methods.
3.4.2
The MacCormack Method
The MacCormack method is an explicit finite difference method, well-suited for solving unsteady flow problems by means of time-marching solutions. The main difference between this method and the Lax-Wendroff method is the predictor-corrector approach used. This approach maintains secondorder accuracy without the need to calculate values using second time derivatives, which normally require a lot of algebraic computation [AJ95]. To best illustrate how the method is applied to the Navier-Stokes equations, we rewrite equations (3.1), (3.2), (3.3), and (3.4) in vector form as
where
E=
∂U ∂E ∂F + + =0 ∂t ∂x ∂y
(3.18)
ρ ρu U= ρv E t
(3.19)
ρu ρu2 + p − τxx
ρuv − τxy (E + p)u − uτ − vτ + q t xx xy x ρv ρuv − τxy F = ρv 2 + p − τyy (E + p)v − uτ − vτ + q t xy yy y and Et = ρ(e +
(3.20)
(3.21)
V2 2 ).
The MacCormack method as applied to the Navier-Stokes equations is written as ∆t t ∆t t t t t ¯ t+∆t = Ui,j U − (E − Ei,j − (F − Fi,j ) i,j ∆x i+1,j ∆y i,j+1 22
(3.22)
t+∆t Ui,j
" # 1 t ∆t ∆t t+∆t t+∆t t+∆t t+∆t t+∆t ¯ ¯ ¯ U +U − (E −E (F¯ − F¯i,j−1 ) = i,j i−1,j − 2 i,j ∆x i,j ∆y i,j
(3.23)
where equation (3.22) is the predictor step and equation (3.23) is the corrector step. The predictor step uses forward differences for the spatial derivatives, while the corrector step uses backward differences. Because the method uses this combination of first-order differencing, it is second-order accurate. It should be noted that backward differences can be used in the predictor step and forward differences in the corrector step, while maintaining second-order accuracy. When applied to the viscous Navier-Stokes equations, care must taken while handling the viscous stresses and heat fluxes. Terms with x-derivatives in equation (3.20) are differenced in the opposite direction of
∂E ∂x ,
while y-derivatives are central-differenced. Similarly, y-derivatives in equation (3.21)
are differenced in the opposite direction of
∂F ∂y
, while x-derivatives are central differenced. This is
done to maintain second order accuracy [AJ95].
23
Chapter 4
Literature Review This chapter presents a review of literature on methods for comparing MD and CFD simulations. Useful methods linking microscopic and macroscopic properties date back to 1950 [IK50], before computational forms of either were in use. Since that time, MD methods of fluid study have been separated into two categories: equilibrium molecular dynamics and non-equilibrium molecular dynamics. Methods in both categories are still used to measure important fluid characteristics, such as transport coefficients [WHM80][BTE95b][BTE95a][KTE97][RP97][OY02], and equations of state [JKJG93]. Recently these techniques have been applied to classical problems with analytical solutions via the Navier-Stokes equations [TE97][ZT04][TG00]. Only in the last few years have researchers begun to compare the results of MD and CFD simulations [XFD02][OH04].
4.1
Transport Coefficients
The first approaches created for computing transport coefficients from MD simulations are considered to be methods based on equilibrium molecular dynamics (EMD). These methods use time averages to measure time-dependent properties, such as the transport coefficients appearing the Navier-Stokes equations. The first approach created for computing transport coefficients uses a time-dependent autocorrelation function [DE90]. In this approach, a transport coefficient is obtained from a GreekKubo (G-K) relation for the decay of correlations between measured physical properties. The general
24
form of this relation for the computation of a transport coefficient T can be written as Z 1 ∞ ˙ ˙ T = hA(t)A(0)idt Q 0
(4.1)
where the brackets indicate a time averaged value, Q is a property-specific value, t is time, and A is a macroscopic property of the simulation. For example, in the G-K expression for shear viscosity A is the pressure tensor, however, any transport property can be calculated using this method. Several techniques have been developed to calculate A, in equation (4.1). The most well-known technique was developed by Irving and Kirkwood [IK50]. They developed expressions to compute the pressure tensor and heat flux vector from atomic trajectories, forces, and energies. In the case of shear flow, the Irving-Kirkwood (I-K) expressions are often computed in “bins” formed by cutting the simulation region in the direction of the flow. A list of the Irving-Kirkwood (I-K) expressions, as well as additional expressions for computing bulk and longitudinal viscosity, can be found in [OH04]. Since the G-K method is based on statistical mechanics, it takes a large amount of computational time and power to obtain accurate measurements of transport coefficients in this way [Hai97]. As a result, more direct methods have been created to measure these dynamic fluid properties. These alternative methods are more direct forms of measurement valid in processes far from equilibrium. Simulation of these processes is called nonequilibrium molecular dynamics (NEMD). There are two very different approaches to NEMD: homogeneous and inhomogeneous. Homogeneous nonequilibrium methods modify the equations of motion of fully homogeneous systems and measure transport coefficients based on these altered dynamics. These methods will not be discussed, however, a comprehensive literature review can be found in [TD07]. Inhomogeneous nonequilibrium methods apply Newtonian dynamics to spatially inhomogeneous systems with welldefined boundaries. Solutions obtained from inhomogeneous systems are dependent on the analytical solution specific to flow geometry. For example, shear viscosity µ and thermal conductivity κ coefficients are determined from the steady-state velocity and temperature profiles of a fully-formed Poiseuille flow.
4.2
Wall Models
In Chapter 3, boundary conditions in continuum simulations were discussed. Emulating those conditions in an MD simulation can be complicated since only atomic trajectories can be controlled.
25
A variety of approaches can be used to simulate atomic walls similar to wall boundary conditions in continuum simulations. Realistically, walls would be made up of a large number of atoms with realistic bonds that allow heat and momentum transfer. However, the amount of computational power required prevents such an accurate model from being used. The alternative is to use a model that can emulate properties of realistic walls, while keeping the need for computational power at a minimum. The simplest approach was used in a study of flow past solid walls [JKWa]. In this experiment, Koplik et al. created walls in an fcc lattice, with each atom having a mass of 1010 m, where m is the mass of a fluid atom. The large mass presents the wall from collapsing during simulations, however, there is no heat transfer between fluid and wall particles. In a similar study [SE92], walls are modeled with a hybrid approach. The particles at the fluidwall boundary are arranged as a continuous layer, using a 4-10 LJ potential for particle interaction. The interior of the wall is modeled by six layers of particles that are 5 times the mass of a fluid particle that interact with a stronger 6-12 LJ potential. Sun and Ebner found that this wall model realistically emulates the heat and momentum transfer at wall boundaries. More recently, in research by Travis et al. [KTE97] walls were made up of a lattice of particles, three layers in thickness, kept in place by harmonic restoring forces and a constraint mechanism that keeps the center of mass of each layer fixed at an initial value. Additionally, a Gaussian thermostat was applied to the wall, ensuring that the wall stayed intact and the overall temperature was constant. Without the application of a thermostat, abnormally high flow temperatures were observed [TE97]. Further research into these ”thermal” walls found that they could be used accurately if fluid behavior close to the wall is not of interest [TTKB98]. Due to the simplicity of implementing thermal walls, they have been widely used in NEMD research.
4.3
Poiseuille Flow
In recent years, researchers began modeling Poiseuille flow of liquid argon using MD. In 1988, Koplik et al. began an inhomogeneous NEMD study of an L-J Poiseuille flow and the no-slip boundary condition [JKWb]. The basic properties of Poiseuille flow were measured from an MD simulation and compared with the equivalent analytical solution. It was found that for a low Reynolds number the flow exhibited the well-known quadratic velocity profile. In addition, the no slip-condition was
26
observed in the fluid-wall atomic interaction. In 1995, Todd et al. applied NEMD to an inhomogenous L-J fluid undergoing planar Poiseuille flow [BTE95b][BTE95a]. In both of these studies, a method of planes (MOP) technique was developed to replace the less accurate I-K methods for measuring the pressure tensor and heat flux vector. Instead of measuring these properties in “bins”, the MOP only takes into account the atoms that cross the planes formed by the bins. The results showed that the MOP did not suffer from the same inaccuracies as the I-K methods at lower resolutions, making the MOP technique a highly accurate alternative to the I-K relations. Subsequently, the MOP was used by Travis et al. to investigate the validity of the NavierStokes equations in a Poiseuille flow with pore widths of 5.1 and 10.2 molecular diameters [KTE97]. They found that the Navier-Stokes equations are not valid for a pore width less than 10 molecular diameters. At a pore width of 5.1 or less, the velocity profile exhibited a profile that resembles a sinusoid with superimposed oscillations. Additionally, they found that in narrow channels the viscosity is not constant across the channel as described by the Navier-Stokes equations and exhibits strong oscillations. It should be noted that all of these experiments were compared with analytical solutions of a Poiseuille flow. While useful to determine if the Navier-Stokes equations exhibit the same behavior as a corresponding MD simulation, analytical solutions cannot be used to determine the time evolution of such flows.
4.4
Methods of Comparison
In the course of this research, we found little literature directly comparing MD simulations to CFD simulations. The first comparisons were made on the flow of an L-J fluid through a periodic nozzle driven by a uniform pressure head [XFD02]. Fan et al. used the WCA potential in an MD simulation, and the finite element method (FEM) in the corresponding incompressible Navier-Stokes simulation. Similar flows were characterized by having the same Reynolds number. To calculate the viscosity of the fluid, they used the velocity profile developed at the inlet, similar to the work of Todd et al. Comparisons between MD and FEM simulations were only made for the velocity profile of the flow. Fan et al. discovered that the incompressible assumption and lack of high resolution methods to obtain flow properties were unsuitable for producing an accurate comparison
27
More recently, Okumura and Heyes carried out research using MD and CFD to model thermal processes of fluids. In [OH04], they used MD and the MacCormack method, as applied to the onedimensional compressible Navier-Stokes equations, to model the nonstationary process of thermal relaxation. The key differences between this work and the work of Fan et al. is the use of an equation of state [JKJG93], the Green-Kubo relations, and spatially varying values of viscosity and thermal conductivity. Additionally, to account for microscopic variations in the MD simulation, they expanded the equation for total energy in the Navier-Stokes energy equation to include the potential energy and thermal energy of the fluid. The goal was to compare the temperature, mass density, pressure, potential energy, and fluid velocity at various points in the thermal relaxation of each simulation. The results showed that the Navier-Stokes equations are valid down to the nanometer scale, despite fluctuations in some properties measured from MD simulations. This study was the first to investigate all of the physical properties solved by the Navier-Stokes equations. It should be noted that comparisons with hard sphere simulations have been made in the past [APM89]. However, the Navier-Stokes equations used in these simulations are usually simplified, and, (as mentioned in Chapter 2) soft sphere MD provides more realistic results.
28
Chapter 5
Simulation Software The experiments in this thesis were run using simulation software written for this thesis as well as open-source software. The MD simulations were performed using the Large-scale Atomic/Molecular Massively Parallel Simulator (LAMMPS), open-source software written in C++ and developed at Sandia National Labs [Pli95]. Post-processing of LAMMPS output data is handled by scripts we wrote in Python that compute the physical properties of interest. Additionally, the Visual Molecular Dynamics (VMD) software provided a means to observe LAMMPS output data and debug any problems with LAMMPS input scripts. The CFD simulations were performed using software written in Python.
5.1
LAMMPS - Large-scale Atomic/Molecular Massively Parallel Simulator
LAMMPS is capable of modeling atomic, polyatomic, biological, metallic, or granular microscopic systems. The software is obtained as source code and can be compiled on a variety of computer architectures with optional packages that may be useful to specific applications. To optimize performance, LAMMPS is implemented using the MPI message passing library for parallel processing. For single processor machines, LAMMPS developers have created the STUBS library that functions as a wrapper for the MPI library, allowing LAMMPS to run as a single process. In the case of parallel processing, LAMMPS uses spatial-decomoposition techniques to partition the simulation region into
29
smaller sub-domains, each assigned to a different processor. All of the processes communicate results and “ghost” atom information is stored for atoms that border the sub-domains [Pli95]. All of the LAMMPS simulations for this thesis were run on an Apple Macbook Pro with a 2.2 GHz Intel Core Duo 2 processor that took advantage of the parallel processing capabilities of LAMMPS.
5.1.1
Pre-processing
LAMMPS operation is a straight forward process that begins with a user defined input script. Typically, the input script has four parts: • 1. Initialization • 2. Atomic definitions • 3. Settings • 4. Run a simulation Initialization parameters have to be defined before atoms can be created. These parameters create the simulation box, specify the type of units (LJ or real), and prepare the simulation for the type of atoms that will be used, such as atomic, bonded, or hybrid. Additionally, this is where the potential function is specified. LAMMPS implements a variety of 2- and 3-body potential functions, including the 12-6 L-J potential used in this thesis. Atomic definitions can be specified in three different ways: read from file, create on a lattice, or duplicate from existing atoms. In the first method, all atomic properties are specified in the input file, including position and velocity. Creation of the atoms on a lattice is accomplished by using the “lattice” command. This command uses a specified density and configuration, such as FCC in 3-dimensions or BCC in 2-dimensions, to arrange the atoms in the simulation space. Method three simply duplicates a region of atoms and places them in a specified region using the “duplicate” command. Any of the three methods can be applied to a sub-region of the simulation box. Once created, the atoms can be further separated into groups. Settings are used to specify constraints, computations, optimizations, and output options. Constraints are applied via the “fix” command. LAMMPS implements a wide variety of constraints including statistical ensembles, thermostats, forces, and springs. Computations are implemented
30
as time averaged measurements, as explained in Section 2.5. These computations include measurements for pressure, temperature, potential energy, and other thermodynamic properties. Many optimizations are implemented, however, the only one pertinent to this thesis is the neighbor list. The neighbor list implemented in LAMMPS functions as described in Section 2.2.2. Output options are set via the “thermo” and “dump” commands. The “thermo” command specifies what data is sent to screen in real-time, while the “dump” command specifies what information should be sent to file. Finally, a simulation is run by specifying the timestep and run length. Care must be taken when specifying the timestep. In our experience, setting too large of a timestep can make a simulation fail depending on the constraints specified in the input script. Alternatively, too small of a timestep will cause very long simulation times.
5.1.2
Post-processing
LAMMPS contains no post-processing other than the computations presented in the previous section. However, those computations are often executed on a per-atom basis, at least requiring averaging. Fortunately, LAMMPS can print atomic data to file as often as needed. The data can contain information on atomic coordinates, velocities, accelerations, or any thermodynamic computation supported by the software, as well as user defined computations. Quantitative analysis of the data was performed by a script written in Python. First, the script reads in the atomic data from the LAMMPS output file. The simulation region is split into a userspecified number of slices equivalent to the ”bins” mentioned in Section 4.1. Next, a list for each slice containing data on each atom in the section is compiled. Finally, the data is used to calculate the density (ρk ), pressure (Pk ), and streaming velocity (vk ) in the kth slice [OH04] determined by Nk Vk ( ) X dφ(rij ) 1 X 1 P = m(˙ri − r˙ 0 )2 − rij 3Vk 2 drij
ρk = m
i∈k
vk =
(5.1) (5.2)
j6=i
1 X x˙ i Nk
(5.3)
i∈k
where Nk is the number of particles in the kth slice, Vk is its volume, φ(rij ) is the interatomic P potential for the distance rij ≡ |ri − rj | between particles at ri and rj , and r˙ 0 = (1/Nk ) i∈k r˙ i .
31
These instantaneous properties are then time-averaged over a user-specified number of timesteps and printed to individual output files. While not directly used for quantitative analysis, visual output can be used to debug simulations exhibiting unusual characteristics such as extremely high temperatures, freezing, and loss of atoms. These phenomena often occurred when initially creating LAMMPS input scripts for the simulations in this thesis. Visual Molecular Dynamics (VMD) is the visualization software used throughout this work. VMD is specifically designed to visualize atomic and molecular systems and is developed as open-source software by the Theoretical Biophysics Group at the University of Illinois at UrbanaChampaign [HS96]. VMD is capable of interpreting many different types of data files including LAMMPS output files. A standard LAMMPS output file consists of the coordinates of every atom printed every N timesteps, where N is a number specified in the input script. VMD reads the output file and shows a visual representation of how the simulation progresses. The software is highly configurable, implementing many 3D effects and visualization styles.
5.2
Navier-Stokes Solver
The Navier-Stokes solver is written in C++ that implements the MacCormack algorithm to solve the compressible, two dimensional Navier-Stokes equations. Initial conditions are user-defined in an input file. As a simulation progresses, the user is given feedback on the convergence of the simulation by displaying the average change in density from the previous timestep. Additionally, the user can set a threshold for convergence for a given simulation so that it ends when the simulation reaches steady state. Output files are created for u, ρ, and p, in tab delimited files that represent the two dimensional grid. To simplify computation, simulations are run as isothermal processes, uncoupling the energy equation from computations. The constant temperature is specified by the user in the input file. Additionally, boundary conditions are implemented in code and cannot be specified in the input file. Since we will be comparing macroscopic and microscopic simulations, two important aspects of the simulation that deviate from conventional CFD should be mentioned. First, instead of using the thermal equation of state for a perfect gas, we use the L-J equation of state created by Johnson et al. [JKJG93]. Second, as noted in Chapter 4, the experiments of Travis et al. and Okumura et al.
32
showed that viscosity values can vary dramatically along the width of a Poiseuille flow [TG00][OH04]. To account for this phenomenon, we use an equation of state to calculate the shear viscosity as well [RP97]. Like the L-J equation of state, the viscosity equation of state is calculated using the local temperature and density of a simulation grid point.
33
Chapter 6
Simulation 6.1
Introduction
In this chapter, we discuss the MD and CFD simulations of a pressure-driven Poiseuille flow. To be consistent between simulations, we use dimensionless MD units for all physical properties. The parameters shown in Section 2.2.1 are implicit. Additionally, the use of dimensionless MD units also allows us to use the L-J viscosity equation of state in our CFD simulations. For both methods of simulation, we begin by introducing initial and boundary conditions. Next, we present an analysis of the data obtained from each solution once it has evolved to steady-state. Finally, we discuss the simulations in relation to a real physical scale.
6.2 6.2.1
MD Simulations Initial and Boundary Conditions
The initial and boundary conditions for the MD simulations were largely based on the work of Todd et al. [TE97]. The geometry of the flow can be seen in Figure (6.1). We ran the simulations using the WCA potential and integrated the equations of motion using the velocity-Verlet method with a timestep of 0.0001. The simulations were allowed to run for 5, 000, 000 timesteps. The simulation region is a three-dimensional box with periodic boundary conditions in all directions, where Lx = Lz = 10 and Ly is 17.5 for the channel width of 15 molecular units or 22.5 for the
34
channel width of 20 molecular units.
Lx
wall atoms y x
y=0 plane
Ly
fluid atoms
Fe
periodic image of the wall
Figure 6.1: Geometry of the Poiseuille flow with flow in the x-direction. Lz can be interpreted as coming out of the page. The fluid atoms were arranged in an FCC lattice, with each atom having a mass of m = 1.0. This initial configuration is shown in Figure (6.2). We ran a total of four simulations at two different densities, as shown in Table (6.1). Each fluid atom interacted with other fluid atoms and wall atoms using the WCA potential, with a σ value of 1.0, and an � value of 1.0. ρ0
Number of Atoms
Ly
0.45
750
15
0.65
1029
15
0.45
950
20
0.65
1271
20
Table 6.1: Initial density conditions for MD simulations. Due to the use of periodic boundary conditions, only a single wall was needed. The second wall
35
Figure 6.2: The MD simulation in its initial FCC configuration. Wall atoms are red and fluid atoms are black. is merely a periodic image of the first. The dimensions are setup such that the wall is parallel to the x − z plane and confine the flow in the y direction. To drive the flow, we applied a constant force on the y − z plane in the x direction, which has the same effect as applying a pressure gradient. For all simulations, a force of Fe = 0.1 was used. This value of Fe kept the temperature from increasing to a point which would cause the thermal walls to breakdown. The wall in each simulation consisted of three layers of 72 atoms, corresponding to a density of 0.85 which is equivalent to a total of 216 wall atoms. Each wall atom had a mass of m = 1.0. They were kept in place using a combination of harmonic restoring forces and atomic re-centering that kept the center of mass of each layer constant in the y direction. The restoring forces were modeled
36
by a restoring potential defined as φ=
1 K(ri − rei )2 2
(6.1)
where rei is the initial site of atom i and K is the spring constant. Higher values of K make the wall stiff, while lower values of K make it too pliable. A value of K = 57.15 was used to ensure optimal heat transfer between wall and fluid atoms, and to keep fluid atoms from penetrating the wall. Additionally, wall atoms were allowed to interact with each other and fluid atoms using the WCA potential. To allow the fluid to dissipate heat, the walls were kept at a constant temperature of 0.722 using a Gaussian thermostat.
6.2.2
Analysis
In this section, we use the software described in Section 5.1.2 to analyze the results of the MD simulations. The simulation data was obtained at a timestep of 4, 000, 000 by splitting the simulation region into 200 “bins”. Additionally, the data was time-averaged over 200 timesteps to increase accuracy. Fluctuations are present in the results because the properties were measured using a finite number of atoms in every calculation. First, we look at the steady-state values of the streaming velocity, vx . Unfortunately, in our simulations, the L-J equation of state for viscosity used in the CFD simulation software is only valid for a temperature range of T = 1.0 − 4.0. The thermal walls in our simulations limited the temperature to a maximum of 0.722. As a result, the method we used to measure the viscosity of the L-J fluid is invalid for the temperatures present in these simulations. Since the viscosity is an integral part of computing the analytical solution of a Poiseuille flow, we do not include the analytical solutions in our analysis. To better illustrate the streaming velocity, we fit a second degree polynomial to each data set, which was found to be the best approximation by Todd et al. [BTE95b]. As shown in Figure (6.3), the velocity profiles of each simulation agree with the quadratic shape of the analytical solution of a Poiseuille flow. We also note that an increase in mean velocity is due to both a decrease in ρ and an increase in Ly . Both of these characteristics are also consistent with what is described by Equation (6.2). Additionally, a no-slip condition is observed at the walls in all simulations. Figure (6.4) shows the mass density in each simulation as a function of the channel width ρ(y). The density toward the center of the channel fluctuates around a fixed density as expected. However, at the walls, the results exhibit compressibility, which is considered uncharacteristic of a Poiseuille 37
Streaming Velocity (r! / t(m!2/")1/2) Streaming Velocity (r! / t(m!2/")1/2)
4 3 2 1 0 !8
!7
!6
!5
!4
!3
!2 !1 0 1 2 Position along the channel (y)
3
4
5
6
7
8
# = 0.45 # = 0.65 # = 0.45 (Fitted) # = 0.65 (Fitted)
6 5 4 3 2 1 0 !10 !9
!8
!7
!6
!5
!4
!3
!2 !1 0 1 2 3 Position along the channel (y)
4
5
6
7
8
9
10
Figure 6.3: MD streaming velocity plots fitted with a second degree polynomial. The top plot has a channel width of 15 and the bottom plot has a channel width of 20.
38
Density (!"3 / m)
2 1.5 1 0.5 0 !8
!6
!4
!2 0 2 Position along the channel width (y)
4
6
8 ! = 0.45 ! = 0.65
Density (!"3 / m)
1.5
1
0.5
0 !10
!8
!6
!4
!2 0 2 Position along the channel width (y)
4
6
8
10
Figure 6.4: MD density plot. The top plot has a channel width of 15 and the bottom plot has a channel width of 20. flow. Additionally, the fluctuations at the wall increase in frequency between values of ρ, but stay relatively the same at the two values of Ly . It is interesting that velocity profile appears as expected, but the density profile differs. Figure (6.5) shows the pressure in each simulation as a function the channel width (p(y)). Similar to the density profile in Figure (6.4), the pressure at the walls begins to fluctuate at the walls. In this case, the fluctuations can be attributed to neglecting higher order terms in the derivation of Equation (5.2) as discussed in [BTE95b]. The error associated with Equation (5.2 is high enough to affect these results. Toward the center of the channel, the p increases as both vx and Ly increase. The change in ρ at a constant channel width seems to have very little, if any, effect on the pressure if the fluctuations at the walls are neglected.
39
Pressure (p!3/")
8 6 4 2 0 !8
!6
!4
!2 0 2 Position along the channel width (y)
4
6
8 # = 0.45 # = 0.65
Pressure (p!3/ ")
8 6 4 2 0 !10
!8
!6
!4
!2 0 2 Position along the channel width (y)
4
6
8
10
Figure 6.5: MD pressure plot. The top plot has a channel width of 15 and the bottom plot has a channel width of 20.
40
6.3 6.3.1
CFD Simulations Initial and Boundary Conditions
The CFD simulations are two-dimensional, corresponding to the x − y plane of the MD simulations. Like the MD simulations, we use a value of Lx = 10 for the channel length. We ran a total of three different simulations with the initial conditions shown in Table (6.2). For each internal point, the velocities in the x- and y-directions were both set to zero. For all points, internal and boundary, the pressure (p) was calculated using the L-J equation of state. Similarly, the viscosity (µ) was calculated using the L-J viscosity equation of state [RP97]. All of the simulations were run on a 50 × 50 grid at a timestep of 0.001 for 500, 000 timesteps. ρ0 (ρσ 3 /m)
T0 (kB T /�)
Ly (σ)
0.65
1.5
15
0.80
1.5
20
0.80
2.0
25
Table 6.2: CFD initial conditions. The implementation of boundary conditions was less straightforward than the periodic boundary conditions defined in the MD simulations. An effort was made to implement the same boundary conditions that were used in the MD simulations, but the CFD simulation software became unstable under these conditions. As a result, we chose to implement boundary conditions that are characteristic of most CFD simulations [AJ95]. In general, the pressure (p) was calculated using the L-J equation of state and the temperature (T ) was kept constant at a value of T = T0 . The top and bottom boundaries are no-slip, as defined in Section (3.2.3). Additionally, ρ at these points was calculated using the continuity equation, which was discretized using one-sided differencing. At the left boundary, v and ρ were kept at constant values of 0.0, while u was calculated using Equation (6.2). The decision to use the analytical solution allowed us to define both u and the force driving the flow at the same time. A summary of these boundary conditions can be found in Table (6.3).
41
Boundary
ρ0 (ρσ 3 /m)
p u (rσ/t mσ 2 /�)
p v (rσ/t mσ 2 /�)
Top
Continuity Equation
0.0
0.0
Bottom
Continuity Equation
0.0
0.0
Left
ρ0
Equation (6.2)
0.0
Right
ρ0
un,j = 2 · un−1,j − un−2,j
vn,j = 2 · vn−1,j − vn−2,j
Table 6.3: CFD boundary conditions.
6.3.2
Analysis
In this section, we analyze the results obtained from the CFD simulations. The simulation data was obtained once simulations ran to 400, 000 timesteps to be consistent with the MD results. In contrast to the MD measurements, the CFD results were not time averaged. Since classical solutions of Poiseuille flow are one dimensional, we compare the simulations by averaging the values at the cross sections of the flow in the same way that the MD results were “binned” values along the direction of the flow. The difference in this case is that we are averaging grid points instead of atoms in fluid volumes. In some cases, we compare these CFD simulations to the behavior in similar MD simulations in literature. Care must be taken when making these comparisons. We only assume that the macroscopic behavior is similar. First, we look at the steady-state values of the streaming velocity, u(y) and compare them to the isothermal analytical solution defined by " # ρFe L2y 1 1 2 u(y) = − (y − ) 2µ 4 2
(6.2)
where ρ and µ are the average density and viscosity across the width of the channel. Figure (6.6) shows the velocity profiles from the simulations in red and the corresponding analytical solution in black. The analytical and simulated solutions overlap in all three cases. From these plots, it is clear that the simulation software does an excellent job of approximating the analytical solution. Additionally, the increase in u between simulations is of interest. From Figure (6.6), it is clear that an increase in Ly has a larger impact on u(y) than an increase in ρ. This behavior is expected. Equation (6.2) shows that Ly is squared, while ρ is not. As a result, given that ρ < 1 and Ly > 1 in these simulations, the contribution from Ly is greater. Figure (6.7) shows the steady-state density profile (ρ(y)) along the channel. As expected, the
42
2.5
vx (r! / t(m!2/")1/2
2
1.5
1 # = 0.65, Ly = 15 (CFD) # = 0.80, Ly = 20 (CFD) # = 0.80, Ly = 25 (CFD) # = 0.65, Ly = 15 (Analytical)
0.5
# = 0.80, Ly = 20 (Analytical) # = 0.80, Ly = 25 (Analytical)
0
5
10
15
20 25 30 Grid point along the channel (j)
35
40
45
50
Figure 6.6: CFD streaming velocity plot with corresponding analytical solutions on a 50 × 50 grid.
43
profile appears to be nearly incompressible, with a slight increase from the initial density in each simulation. Although the profile exhibits a very small increase in density close to the walls, the increase is not close to the fluctuations observed in the MD simulations. One possibility is that the viscosity behavior differs from similar MD simulations in [ZT04]. Zhang et al. observed a sharp increase in viscosity close to the walls. In our simulations, the viscosity did not exhibit this characteristic.
0.85
Density (!"3/m)
0.8
0.75
! = 0.65, Ly = 15 ! = 0.80, Ly = 20 ! = 0.80, Ly = 25
0.7
0.65
0.6
5
10
15
20 25 30 35 Grid points along the channel width (j)
40
45
50
Figure 6.7: CFD density plot on a 50 × 50 grid. Figure (6.8) shows the steady-state pressure profile (p(y)) along the channel. In the classical definition of a Poiseuille flow, the system must have a constant pressure at steady-state to be considered stable and time independent. Here we observe that the pressure is constant toward the middle of the channel and increases slightly toward the walls, similar to the behavior of the density profiles. As expected the pressure is highest in the simulation where ρ = 0.80 and T = 2.0. The pressure increased between simulations as ρ and Ly increased. This behavior is similar to that of an
44
ideal gas where p and ρ are directly proportional.
4.5
4
Pressure (p!3/")
3.5
# = 0.65, Ly = 15
3
# = 0.80, Ly = 20 # = 0.80, Ly = 25
2.5
2
1.5
1
5
10
15
20 25 30 35 Grid point along the channel width (j)
40
45
50
Figure 6.8: CFD pressure plot on a 50 × 50 grid.
6.4
Physical Scale
Dimensionless units were used in both sets of simulations for their convenience. However, it is useful to realize how these simulations relate to some physical scale. As previously noted, the L-J potential has been extensively used to model liquid argon. The parameters for length, mass, and energy for liquid argon are [Rah64]: • σ = 3.4˚ A = 0.34 nm • �/kB = 120K, where kB = 1.3806 × 10⁻¹⁶ erg/atom. • m = 39.95 × 1.6749 × 10−24 g 45
with a natural time unit of τ = 2.16 × 10⁻¹² s. Using these parameters the channel widths of 15, 20, and 25 correspond to widths of 5.1, 6.8, and 8.5 nm respectively. The Navier-Stokes model of a Poiseuille flow is frequently used to model blood flow. In comparison to a nanoscale Poiseuille flow, such as the one used in this thesis, the average size of a capillary measures 5 − 10 µm. However, due to the non-Newtonian nature of blood and the complexity of the substance, the L-J potential would not be suitable for such a fluid. Incorporating the natural time unit associated with liquid argon, a simulation run to 4, 000, 000 iterations with a timestep of 0.0001τ corresponds to 8.64 × 10⁻⁹ s or 8.64 ns.
46
Chapter 7
Suggestions for Future Work The next logical step in this line of research is to directly relate MD and CFD simulations of the same dynamic problem. It is clear from the results presented in the previous chapter that a Poiseuille flow on such a small scale must be treated as a non-Newtonian compressible fluid. This means that the transport coefficients that are normally constant throughout the simulation region, should vary in time and space. In our simulations, we used an equation of state instead of a constant value for the shear viscosity. Such equations could also be used for the thermal conductivity (κ) and bulk viscosity (ξ) coefficients. Additionally, since it is not possible to maintain a strictly constant temperature in an MD simulation, an isothermal approximation is not sufficient to accurately describe this type of flow. As a result, the full Navier-Stokes equations (energy equation included) are required to attain any useful level of accuracy. The addition of the energy equation requires an equation of state to relate temperature and energy, as discussed in Section 3.2.2. An equation of state is also required for a local definition of κ in the same manor as µ. The microscopic nature of MD simulation also allows for a more exact definition of internal energy in the Navier-Stokes equations. In [OH04], Okumura and Heyes define the total energy as Et = ρ((3/2m)kB T + (1/m)U + (1/2)v 2 )
(7.1)
which incorporates both thermal and potential energy in place of internal energy (e). In the case of an L-J fluid, the potential energy (U ) can be measured experimentally as a function of ρ and T [JKJG93]. However, the addition of U incorporates another dependent variable into the Navier47
Stokes equations. As a result, a relation between p, ρ, T , and U would be required to close the set of equations. Boundary conditions are also critical to the path a system takes to its steady-state solution. We did not use periodic boundary conditions in our CFD simulations, and although the simulations achieved a correct steady-state, periodic boundary conditions would be less restrictive. The choice to use classical CFD boundary conditions was due to stability problems associated with the MacCormack method. One solution would be to use an implicit method. As discussed in Section 3.4.1, implicit methods do not suffer from the same stability problems and would be more suited to solve this type of problem. Implicit methods for solving compressible flow problems are often very complicated, requiring a density-pressure-velocity coupling and a lot of memory for computations [FP96]. A higher resolution technique should also be used to measure the pressure. The MOP developed by Todd et al. does not suffer from the same inaccuracies at the walls that are present in measurements taken with the I-K method. Additionally, the MOP does not become more inaccurate as the number of planes decreases, however, it is more computationally expensive.
48
REFERENCES [AJ95]
J.D. Anderson Jr. Computational Fluid Dynamics: The Basics with Applications. McGraw-Hill, Inc., 1995.
[APM89]
M. M. Mansour A. Puhl and M. Mareschal. Quantitative comparison of molecular dynamics with hydrodynamics. Phys. Rev. A, 40(4), 1989.
[AW57]
B. J. Alder and T. E. Wainwright. Phase transition for a hard sphere system. J. Chem. Phys., 27, 1957.
[BC84]
D. Brown and J.H.R. Clarke. A comparison of constant energy, constant temperature and constant pressure ensembles in molecular dynamics simulations of atomic liquids. Molecular Physics, 51:1243–1252, 1984.
[Bor27]
R. Oppenheimer Born, M. Ann. Phys., 84:457–484, 1927.
[BTE95a] P. J. Daivis B.D. Todd and D.J. Evans. Heat flux vector in highly inhomogenous nonequilibrium fluids. Phys. Rev. E, 51(5):4362, 1995. [BTE95b] P. J. Daivis B.D. Todd and D.J. Evans. Pressure tensor for inhomogeneous fluids. Phys. Rev. E, 52(2):1627, 1995. [DE90]
G.P. Morriss D.J. Evans. Statistical Mechanics of Nonequilibrium Liquids. Academic Press, London, 1990.
[Ema98]
G. Emanuel. Bulk viscosity in the navier-stokes equations. Intl. Journal of Engineering Science, 36:1313–1323, 1998.
[FLU05]
Inc FLUENT, editor. Fluent 6 User’s guide vol. 2. Fluent Inc., 2005.
[FP96]
J.H. Ferziger and M. Peric. Computational Methods for Fluid Dynamics. Springer-Verlag, Berlin, 1996.
[Hai97]
J. Haile. Molecular Dynamics Simulation: Elementary Methods. New York: John Wiley and Sons Inc., 1997.
[Hoo85]
William G. Hoover. Canonical dynamics: Equilibrium phase-space distributions. Phys. Rev. A, 31(3):1695–1697, Mar 1985.
49
[HS96]
A. Dalke Humphrey, W. and K. Schulten. Vmd - visual molecular dynamics. Journal of Molecular Graphics, 14:33–38, 1996.
[IK50]
J.H. Irving and J.G. Kirkwood. The statistical mechanical theory of transport processes. iv. the equations of hydrodynamics. J. Chem. Phys., 18, 1950.
[JKJG93] J. A. Zollweg J. K. Johnson and K. E. Gubbins. The lennard-jones equation of state revisited. Molecular Physics, 78:591–618, 1993. [JKWa]
J. R. Banavar J. Koplik and J. F. Willemsen. Molecular dynamics of fluid flow at solid surfaces. Physics of Fluids A, 1:781–794.
[JKWb]
J. R. Banavar J. Koplik and J. F. Willemsen. Molecular dynamics of poiseuille flow and moving contact lines. Phys. Rev. Lett., 60.
[KTE97]
B.D. Todd K.P. Travis and D.J. Evans. Departure from navier-stokes hydrodynamics in confined liquids. Phys. Rev. E, 55, 1997.
[LH02]
Chen S. H. Liou, T. M. and P.W. Hwang. Large eddy simulation of turbulent wake behind a square cylinder with a nearby wall. Journal of Fluids Engineering, 124:81–90, 2002.
[LW64]
P. D. Lax and B. Wendroff. Difference schemes for hyperbolic equations with high order of accuracy. Communications on Pure and Applied Mathematics, 17:381–398, 1964.
[Mac69]
R.W. MacCormack. The effect of viscosity in hypervelocity impact cratering. AIAA Paper, 69, 1969.
[Nos84a]
Shuichi Nos. A molecular dynamics study for simulations in the canonical ensemble. Molecular Physics, 52:255–268, 1984.
[Nos84b]
Shuichi Nos. A unified formulation of the constant temperature molecular dynamics methods. J.Chem. Phys., 81:511–519, 1984.
[OH04]
H. Okumura and D. M. Heyes. Comparisons between molecular dynamics and hydrodynamics treatment of nonstationary thermal processes in a liquid. Phys. Rev. E, 70(061206), 2004.
[OY02]
H. Okumura and F. Yonezawa. New formula for the bulk viscosity constructed from the interatomic potential and the pair distribution function. J. Chem. Phys., 116(17), 2002.
[Pat80]
S.V. Patankar. Numerical heat transfer and fluid flow. Hemisphere Publishing Corporation, 1980.
[Pli95]
S. J. Plimpton. J. Comp. Phys., 117:1–19, 1995.
[PS72]
S. V. Patankar and D. B. Spalding. A calculation procedure for heat, mass and momentum transfer in three-dimensional parabolic flows. International Journal of Heat and Mass Transfer, 15:1787–1806, 1972.
[Rah64]
A. Rahman. Correlations in the motion of atoms in liquid argon. 136(2A):A405–A411, Oct 1964. 50
Phys. Rev.,
[Rap04]
D. C. Rapaport. The Art of Molecular Dynamics Simulation. Cambridge University Press, 2004.
[RIIW86] A. D. Gosman R. I. Issa and A. P. Watkins. The computation of compressible and incompressible recirculating flows by a non-iterative implicit scheme. J. Comput. Phys., 62(1):66–82, 1986. [RP97]
R. L. Rowley and M. M. Painter. Diffusion and viscosity equations of state for a lennardjones fluid obtained from molecular dynamics simulations. International Journal of Thermophysics, 18, 1997.
[Sch79]
H. Schlichting. Boundary-Layer Theory. McGraw-Hill, New York, 7th ed edition, 1979.
[SE92]
M. Sun and C. Ebner. Molecular dynamics study of flow at fluid-wall interface. Physical Review Letters, 69:3491–3494, 1992.
[Sir06]
Tim Sirk. Numerical simulation of nanoscale flow: A molecular dynamics study of drag. Master’s thesis, Virginia Polytechnic Institute and State University, 2006.
[SSG02]
R. Suresh S. S. Gokhale. Numerical computations of internal flows for axisymmetric and two-dimensional nozzles. Int. J. Numer. Methods Fluids, 124, 2002.
[SW85]
F.H. Stillinger and T.A. Weber. Computer simulation of local order in condensed phases of silicon. Phys. Rev. B, 31:5262, 1985.
[TD07]
B.D. Todd and Peter J. Daivis. Homogeneous non-equilibrium molecular dynamics simulations of viscous flow: techniques and applications. Molecular Simulation, 33:189–229, 2007.
[TE97]
B. D. Todd and D. J. Evans. Temperature profile for poiseuille flow. Phys. Rev. E, 55(3), 1997.
[TG00]
K.P. Travis and K. E. Gubbins. Poiseuille flow of lennard-jones fluids in narrow slit pores. J. Chem. Phys., 112(4), 2000.
[TTKB98] Riina Tehver, Flavio Toigo, Joel Koplik, and Jayanth R. Banavar. Thermal walls in computer simulations. Phys. Rev. E, 57(1):R17–R20, Jan 1998. [VDR84]
J.P. Van Doormal and G. D. Raithby. Enhancements of the simple method for predicting incompressible fluid flows. Numer. Heat Transfer, 7:147–163, 1984.
[Ver67]
L. Verlet. Computer ”experiments” on classical fluids. i. thermodynamical properties of lennard-jones molecules. Physical Review, 159:98–103, 1967.
[VM95]
H. K. Versteerg and W. Malalasekera. An introduction to Computational Fluid Dynamics: The Finite Volume Method. Longman Group Ltd, 1995.
[WHM80] R.B. Hickman A.J.C. Ladd W.T. Ashurst W.G. Hoover, D.J. Evans and B. Moran. Lennard-jones triple-point bulk and shear viscosities. green-kubo theory, hamiltonian mechanics, and nonequilibrium molecular dynamics. Phys. Rev. A, 22, 1980. [Wtr01]
J. Wtrwy. Three-dimensional model of navier stokes equations for water waves. Port, Coastal, and Ocean Engineering, 127:16–25, 2001. 51
[WV04]
G. Widmalm and R. M. Venable. Molecular dynamics simulation and nmr study of a blood group h trisaccharide. Biopolymers, 34:1079–1088, 2004.
[XFD02]
N. T. Yong X.J. Fan, N. Phan-Thien and X. Diao. Molecular dynamics simulation of a liquid in a complex nano channel flow. Physics of Fluids, 14(3), 2002.
[ZT04]
J. Zhang and B.D. Todd. Viscosity of confined inhomogeneous nonequilibrium fluids. J. Chem. Phys., 121(21), 2004.
52
Chapter 8
Appendix A 8.1
Sample LAMMPS Input File
# 3 D Poiseuille Flow dimension boundary
3 p p p
atom_style neighbor neigh_modify
atomic 0.3 bin delay 5
# geometry lattice region create_box
fcc 0.65 box block 0 10.0 -10.0 7.5 0 10.0 units box 2 box
# create atomic lattices mass mass
1 1.0 2 1.0
region region units box region units box region box
1 block INF INF -10.0 -7.5 INF INF units box 20 block INF INF -10.0 -9.16667 INF INF 21 block INF INF -9.16667 -8.33333 INF INF 22 block INF INF -8.33333 -7.5 INF INF units
53
region
2 intersect 2 1 box side out units box
create_atoms lattice lattice create_atoms
1 region 2 none fcc 0.85 2 region 1
group group group group group
wall region 1 first region 20 second region 21 third region 22 flow subtract all wall
# potential calculation pair_style pair_coeff
lj / cut 1.12246 * * 1.0 1.0 1.12246
# initial velocities compute compute fix
mobile flow temp stationary wall temp 1 all nve
# Poiseuille flow fix
2 flow addforce 0.1 0.0 0.0
# wall fix fix
7 wall temp / rescale 1 0.722 0.722 0.0001 1.0 5 wall spring / self 57.1
fix fix fix
20 first recenter NULL INIT NULL 21 second recenter NULL INIT NULL 22 third recenter NULL INIT NULL
# run timestep thermo thermo_modify
0.0001 1000 temp mobile
dump 1 flow custom 200 out . flow tag y z vx vy vz sxx syy szz epair sxy dump 2 all atom 25 vmd . flow run 5000000
54
8.2
MD Post-processing Python Code
# input file format # tag y z vx vy vz sxx syy szz epair sxy import sys , getopt def Main ( FILENAME , SLICES , NUMBER_OF_TIMESTEPS , TIMESTEP , WALL_WIDTH ): # print a decent header print " Input filename :" , FILENAME print " Number of timesteps :" , N U M BE R _ OF _ T IM E S TE P S print " Number of slices :" , SLICES print " Starting timestep :" , TIMESTEP print " Wall width :" , WALL_WIDTH NAN_CODE = "0\ n " OUTPUTS = { ’ temp ’ ’ massdensity ’ ’ pressure ’ ’pe ’ ’ xvel ’ ’pxy ’ ’ numberdensity ’
: : : : : : :
’ temp . output . txt ’ , ’ massdensity . output . txt ’ , ’ pressure . output . txt ’ , ’ pe . output . txt ’ , ’ xvel . output . txt ’ , ’ pxy . output . txt ’ , ’ numberdensity . txt ’}
# we need to burn off the 5 lines of header crap f = open ( FILENAME , " r ") # create buckets to hold atoms for each timestep timesteps = [] for i in range (0 , N U MB E R _O F _ TI M E ST E P S ) : timesteps . append ([]) for i in range (0 ,1) : f . readline () cur_timestep = int ( f . readline () ) f . readline () # get the number of atoms number_of_atoms = int ( f . readline () ) f . readline ()
55
# now get the box bounds for x ,y , z xbound = f . readline () . strip () . split ( ’ ’) ; ybound = f . readline () . strip () . split ( ’ ’) ; zbound = f . readline () . strip () . split ( ’ ’) ; # figure out sliceWidth = SLICES print " Slice topOfBuckets
the size of each slice ( float ( ybound [1]) - float ( ybound [0]) - WALL_WIDTH ) / width : " , sliceWidth = []
for i in range (0 , SLICES ) : # print sliceWidth *( i +1) + float ( ybound [0]) + WALL_WIDTH topOfBuckets . append ( sliceWidth *( i +1) + float ( ybound [0]) + sliceWidth + WALL_WIDTH )
# burn ITEM : ATOMS line f . readline () # find the correct timestep while cur_timestep != TIMESTEP : for line in range (0 , number_of_atoms ) : f . readline () f . readline () cur_timestep = int ( f . readline () ) for line in range (0 ,7) : f . readline () print "" print " Reading input file ..." # read in atoms for timestep in range (0 , N U MB E R _O F _ TI M E ST E P S ) : # print timestep # burn next 10 lines if it is not the first timestep if timestep != 0: for i in range (0 ,9) : f . readline () # and now we ’ re at the atoms themselves for atom in range (0 , number_of_atoms ) : line = f . readline ()
56
# print line timesteps [ timestep ]. append ( map ( lambda x : float ( x ) , line . strip () . split ( ’ ’) ) ) f . close () # now atoms is a list with one entry per atom # each atom is a list of those 10 numbers ( see format above ) # let ’ s make buckets to stick them in steps = [] for i in range (0 , N U MB E R _O F _ TI M E ST E P S ) : steps . append ([]) for j in range (0 , SLICES ) : steps [ i ]. append ([]) print " Placing atom in slices for computations ..." # now let ’ s read through the atoms , check their y - coord , and see # what bucket to stick them in j = 0 for timestep in timesteps : # print " Timestep : " , j for atom in timestep : i = 0 for bucketLid in topOfBuckets : if atom [1] < cmath > < string > < cstdlib >
# include " props . h " # include " computations . h " # include " logs . h " using namespace std ; int main ( int argc , char * argv []) { double lx = 10;
62
double ly = 20; int nt = 250000; int nx = 52; int ny = 50; double dt = 0.0001; double dx = lx /( nx -3) ; double dy = ly /( ny -1) ; double U = 0; double fe = .1; double residual = 0; Props * props = new Props ( nx , ny ) ; Computations * computations = new Computations ( dx , dy , dt , fe , nx , ny ) ; computations - > i ni t E qu a t io n O fS t a te () ; // initial conditions double u = 0.0; double v = 0.0; double rho = 0.45; double T = 1.5; double p = computations - > t h e r m a l E q u a t i o n O f S t a t e ( rho , T ) ; computations - > i n i t s h e a r V i s c o s i t y E q u a t i o n O f S t a t e () ; // output cout T ) ; } } } return props ; } // based on equation of state introduced by J . K . Johnson et al . double Computations :: t h e r m a l E q u a t i o n O f S t a t e ( double rho , double T ) { double a [8]; double b [6]; double aSum = 0; double bSum = 0; a [0] = x [0]* T + x [1]* sqrt ( T ) + x [2] + ( x [3]/ T ) + ( x [4]/ pow (T ,2) ) ; a [1] = x [5]* T + x [6] + ( x [7]/ T ) + ( x [8]/ pow (T ,2) ) ; a [2] = x [9]* T + x [10] + ( x [11]/ T ) ;
73
a [3] a [4] a [5] a [6] a [7]
= = = = =
b [0] = b [1] = b [2] = b [3] = b [4] = b [5] = );
x [12]; x [13]/ T + ( x [14]/ pow (T ,2) ) ; x [15]/ T ; ( x [16]/ T ) + ( x [17]/ pow (T ,2) ) ; x [18]/ pow (T ,2) ; ( x [19]/ pow (T ,2) ) ( x [21]/ pow (T ,2) ) ( x [23]/ pow (T ,2) ) ( x [25]/ pow (T ,2) ) ( x [27]/ pow (T ,2) ) ( x [29]/ pow (T ,2) )
+ + + + + +
( x [20]/ pow (T ,3) ) ; ( x [22]/ pow (T ,4) ) ; ( x [24]/ pow (T ,3) ) ; ( x [26]/ pow (T ,4) ) ; ( x [28]/ pow (T ,3) ) ; ( x [30]/ pow (T ,3) ) + ( x [31]/ pow (T ,4)
// first sum for ( int i = 1; i rho , props - >u ,i ,j , ’f ’) - ( dt / dy ) * F1 ( props - > rho , props - >v ,i ,j , ’f ’) ; // x - momentum U2Predicted [ i ][ j ] = U2 ( props - > rho , props - >u ,i , j ) - ( dt / dx ) * E2 ( props - > rho , props - >u , props - >v , props - >p ,i ,j , props - > nx , props - > ny , ’f ’) - ( dt / dy ) * F2 ( props - > rho , props - >u , props - >v ,i ,j , props - > nx , props - > ny , ’f ’) ; // y - momentum U3Predicted [ i ][ j ] = U3 ( props - > rho , props - >v ,i , j ) - ( dt / dx ) * E3 ( props - > rho , props - >u , props - >v ,i ,j , props - > nx , props - > ny , ’f ’) - ( dt / dy ) * F3 ( props - > rho , props - >u , props - >v , props - >p ,i ,j , props - > nx , props - > ny , ’f ’) ; } } props = decode ( props , ’f ’) ; return props ; } Props * Computations :: bound aryPre dictor ( Props * props ) { int nx = props - > nx ; int ny = props - > ny ; double double double double
initialWidth = 20.0; initialDensity = 0.8; externalForce = 0.1; initialMu = 2.253;
// apply boundary conditions to for ( int i = 1; i < nx -1; i ++) { // top props - > uNext [ i ][ ny -1] = props - > vNext [ i ][ ny -1] = props - > rhoNext [ i ][ ny -1]
77
top and bottom
0.0; 0.0; = props - > rho [ i ][ ny -1] + ( dt
/(2* dy ) ) *( - props - > rho [ i ][ ny -3]* props - > v [ i ][ ny -3] + 4* props - > rho [ i ][ ny -2]* props - > v [ i ][ ny -2]) ; props - > pNext [ i ][ ny -1] = this - > t h e r m a l E q u a t i o n O f S t a t e ( props - > rhoNext [ i ][ ny -1] , props - > T ) ;; // bottom props - > uNext [ i ][0] = 0.0; props - > vNext [ i ][0] = 0.0; props - > rhoNext [ i ][0] = props - > rho [ i ][0] - ( dt /(2* dy ) ) *( - props - > rho [ i ][2]* props - > v [ i ][2] + 4* props - > rho [ i ][1]* props - > v [ i ][1]) ; props - > pNext [ i ][0] = this - > t h e r m a l E q u a t i o n O f S t a t e ( props - > rhoNext [ i ][0] , props - > T ) ; } // apply boundary conditions to left and right double count = 0; for ( int j = 0; j < ny ; j ++) { // left props - > uNext [0][ j ] = (( initialDensity * externalForce * initialWidth * initialWidth ) /(2* initialMu ) ) *(0.25 (( count /( ny -1) ) -0.5) *(( count /( ny -1) ) -0.5) ) ; props - > vNext [0][ j ] = 0.0; props - > rhoNext [0][ j ] = initialDensity ; props - > pNext [0][ j ] = t h e r m a l E q u a t i o n O f S t a t e ( props - > rhoNext [0][ j ] , props - > T ) ; // right props - > uNext [ nx -1][ j ] = 2* props - > uNext [ nx -2][ j ] props - > uNext [ nx -3][ j ]; props - > vNext [ nx -1][ j ] = 2* props - > vNext [ nx -2][ j ] props - > vNext [ nx -3][ j ]; props - > rhoNext [ nx -1][ j ] = initialDensity ; props - > pNext [ nx -1][ j ] = t h e r m a l E q u a t i o n O f S t a t e ( props - > rhoNext [ nx -1][ j ] , props - > T ) ; count = count + 1.0; } return props ; } Props * Computations :: inter nalCor rector ( Props * props ) { for ( int i = 1; i < ( props - > nx ) -1; i ++) { for ( int j = 1; j < ( props - > ny ) -1; j ++) {
78
// continuity U1Corrected [ i ][ j ] = .5*( U1 ( props - > rho ,i , j ) + U1Predicted [ i ][ j ] -( dt / dx ) * E1 ( props - > rhoNext , props - > uNext ,i ,j , ’b ’) -( dt / dy ) * F1 ( props - > rhoNext , props - > vNext ,i ,j , ’b ’) ) ; // x - momentum U2Corrected [ i ][ j ] = .5*( U2 ( props - > rho , props - >u ,i , j ) + U2Predicted [ i ][ j ] -( dt / dx ) * E2 ( props - > rhoNext , props - > uNext , props - > vNext , props - > pNext ,i ,j , props - > nx , props - > ny , ’b ’) -( dt / dy ) * F2 ( props - > rhoNext , props - > uNext , props - > vNext ,i ,j , props - > nx , props - > ny , ’b ’) ); // y - momentum U3Corrected [ i ][ j ] = .5*( U3 ( props - > rho , props - >v ,i , j ) + U3Predicted [ i ][ j ] -( dt / dx ) * E3 ( props - > rhoNext , props - > uNext , props - > vNext , i ,j , props - > nx , props - > ny , ’b ’) -( dt / dy ) * F3 ( props - > rhoNext , props - > uNext , props - > vNext , props - > pNext ,i ,j , props - > nx , props - > ny , ’b ’) ); } } props = decode ( props , ’b ’) ; return props ; } Props * Computations :: bound aryCor rector ( Props * props ) { int nx = props - > nx ; int ny = props - > ny ; double double double double
initialWidth = 20.0; initialDensity = 0.8; externalForce = 0.1; initialMu = 2.253;
// apply boundary conditions to top and bottom for ( int i = 1; i < nx -1; i ++) { // top props - > uFinal [ i ][ ny -1] = 0.0; props - > vFinal [ i ][ ny -1] = 0.0; props - > rhoFinal [ i ][ ny -1] = .5*( props - > rhoNext [ i ][ ny -1]+ props - > rho [ i ][ ny -1]+( dt /(2* dy ) ) *( - props - >
79
rhoNext [ i ][ ny -3]* props - > vNext [ i ][ ny -3]+4* props - > rhoNext [ i ][ ny -2]* props - > vNext [ i ][ ny -2]) ) ; props - > pFinal [ i ][ ny -1] = this - > t h e r m a l E q u a t i o n O f S t a t e ( props - > rhoNext [ i ][ ny -1] , props - > T ) ; // bottom props - > uFinal [ i ][0] = 0.0; props - > vFinal [ i ][0] = 0.0; props - > rhoFinal [ i ][0] = .5*( props - > rhoNext [ i ][0]+ props - > rho [ i ][0] -( dt /(2* dy ) ) *( - props - > rhoNext [ i ][2]* props - > vNext [ i ][2]+4* props - > rhoNext [ i ][1]* props - > vNext [ i ][1]) ) ; props - > pNext [ i ][0] = this - > t h e r m a l E q u a t i o n O f S t a t e ( props - > rhoFinal [ i ][0] , props - > T ) ; } double count = 0; // apply boundary conditions to left and right for ( int j = 0; j < ny ; j ++) { // left props - > uFinal [0][ j ] = (( initialDensity * externalForce * initialWidth * initialWidth ) /(2* initialMu ) ) *(0.25 - (( count /( ny -1) ) -0.5) *(( count /( ny -1) ) -0.5) ) ; props - > vFinal [0][ j ] = 0.0; props - > rhoFinal [0][ j ] = initialDensity ; props - > pFinal [0][ j ] = t h e r m a l E q u a t i o n O f S t a t e ( props - > rhoFinal [0][ j ] , props - > T ) ; // right props - > uFinal [ nx -1][ j ] = 2* props - > uFinal [ nx -2][ j ] props - > uFinal [ nx -3][ j ]; props - > vFinal [ nx -1][ j ] = 2* props - > vFinal [ nx -2][ j ] props - > vFinal [ nx -3][ j ]; props - > rhoFinal [ nx -1][ j ] = initialDensity ; props - > pFinal [ nx -1][ j ] = t h e r m a l E q u a t i o n O f S t a t e ( props - > rhoFinal [ nx -1][ j ] , props - > T ) ; count = count + 1.0; } return props ; } // MacCormack discretizations of U , E , F matrices # include " dissipation . h " # include " U . h "
80
# include " E . h " # include " F . h " double ** Computations :: getMu () { return mu ; } double * Computations :: zeros ( int ny ) { double * temp = new double [ ny ]; for ( int i = 0; i < ny ; i ++) { temp [ i ] = 0.0; } return temp ; } double ** Computations :: zeros ( int nx , int ny ) { double ** temp = new double *[ nx ]; for ( int i = 0; i < nx ; i ++) { temp [ i ] = new double [ ny ]; } for ( int i = 0; i < nx ; i ++) { for ( int j = 0; j < ny ; j ++) { temp [ i ][ j ] = 0.0; } } return temp ; }
8.3.6 /* * * * * * * */
U.h
U.h Flow Created by Jeremy Fried on 6/15/07. Copyright 2007 Virginia Tech . All rights reserved .
81
double Computations :: U1 ( double ** rho , int i , int j ) { return rho [ i ][ j ]; } double Computations :: U2 ( double ** rho , double ** u , int i , int j ) { return rho [ i ][ j ]* u [ i ][ j ]; } double Computations :: U3 ( double ** rho , double ** v , int i , int j ) { return rho [ i ][ j ]* v [ i ][ j ]; }
8.3.7 /* * * * * * * */
F.h
F.h Flow Created by Jeremy Fried on 6/15/07. Copyright 2007 Virginia Tech . All rights reserved .
double Computations :: F1 ( double ** rho , double ** v , int i , int j , char diff ) { if ( diff == ’f ’) return ( rho [ i ][ j +1]* v [ i ][ j +1] - rho [ i ][ j ]* v [ i ][ j ]) ; else return ( rho [ i ][ j ]* v [ i ][ j ] - rho [ i ][ j -1]* v [ i ][ j -1]) ; } double Computations :: F2 ( double ** rho , double ** u , double ** v , int i , int j , int nx , int ny , char diff ) { double left ; double right ; if ( diff == ’f ’) { left = rho [ i ][ j +1]* u [ i ][ j +1]* v [ i ][ j +1] - tauXY (u ,v , nx , ny ,i , j +1 ,2) ; right = rho [ i ][ j ]* u [ i ][ j ]* v [ i ][ j ] - tauXY (u ,v , nx , ny ,
82
i ,j ,2) ; return ( left - right ) ; } else { left = rho [ i ][ j ]* u [ i ][ j ]* v [ i ][ j ] - tauXY (u ,v , nx , ny ,i ,j ,4) ; right = rho [ i ][ j -1]* u [ i ][ j -1]* v [ i ][ j -1] - tauXY (u ,v , nx , ny ,i ,j -1 ,4) ; return ( left - right ) ; } } double Computations :: F3 ( double ** rho , double ** u , double ** v , double ** p , int i , int j , int nx , int ny , char diff ) { double left ; double right ; if ( diff == ’f ’) { left = rho [ i ][ j +1]* v [ i ][ j +1]* v [ i ][ j +1] + p [ i ][ j +1] tauYY (u ,v , nx , ny ,i , j +1 ,2) ; right = rho [ i ][ j ]* v [ i ][ j ]* v [ i ][ j ] + p [ i ][ j ] - tauYY ( u ,v , nx , ny ,i ,j ,2) ; return ( left - right ) ; } else { left = rho [ i ][ j ]* v [ i ][ j ]* v [ i ][ j ] + p [ i ][ j ] - tauYY (u ,v , nx , ny ,i ,j ,4) ; right = rho [ i ][ j -1]* v [ i ][ j -1]* v [ i ][ j -1] + p [ i ][ j -1] - tauYY (u ,v , nx , ny ,i ,j -1 ,4) ; return ( left - right ) ; } }
8.3.8 /* * * * * * * */
dissipation.h
dissipation . h Flow Created by Jeremy Fried on 6/15/07. Copyright 2007 Virginia Tech . All rights reserved .
83
double Computations :: tauXX ( double ** u , double ** v , double nx , double ny , int i , int j , int n ) { double ux , vy ; // in predictor use x backward difference , y central difference if ( n == 1) { // if on the bottom edge , use forward difference if ( j == 0) vy = ( v [ i ][ j +1] - v [ i ][ j ]) / dy ; // if on the top edge , use backward difference else if ( j == ( ny -1) ) vy = ( v [ i ][ j ] - v [ i ][ j -1]) / dy ; // otherwise use central difference else vy = ( v [ i ][ j +1] - v [ i ][ j -1]) /(2* dy ) ; // if on the if ( i == 0) ux = // otherwise else ux =
left edge , use forward difference ( u [ i +1][ j ] - u [ i ][ j ]) / dx ; use backward difference
( u [ i ][ j ] - u [i -1][ j ]) / dx ; } // in corrector use x forward difference , y central difference else { // if on the bottom edge , use forward difference if ( j == 0) vy = ( v [ i ][ j +1] - v [ i ][ j ]) / dy ; // if on the top edge , use backward difference else if ( j == ( ny -1) ) vy = ( v [ i ][ j ] - v [ i ][ j -1]) / dy ; // otherwise use central difference else vy = ( v [ i ][ j +1] - v [ i ][ j -1]) /(2* dy ) ; // if on the right edge , use backward difference if ( i == ( nx -1) ) { ux = ( u [ i ][ j ] - u [i -1][ j ]) / dx ; } // otherwise use forward difference else ux = ( u [ i +1][ j ] - u [ i ][ j ]) / dx ;
84
} return ( -(2/3) * mu [ i ][ j ]*( ux + vy ) + 2* mu [ i ][ j ]* ux ) ; // return ( -(2/3) * mu [ i ][ j ] + b [ i ][ j ]) *( ux + vy ) + (2* mu [ i ][ j ]) * ux ; } double Computations :: tauYY ( double ** u , double ** v , double nx , double ny , int i , int j , int n ) { double ux , vy ; // in predictor use x central difference , y backward difference if ( n == 2) { // if on left edge , use forward difference if ( i == 0) ux = ( u [ i +1][ j ] - u [ i ][ j ]) / dx ; // if on the right edge , use backward difference else if ( i == ( nx -1) ) ux = ( u [ i ][ j ] - u [i -1][ j ]) / dx ; // otherwise use central difference else ux = ( u [ i +1][ j ] - u [i -1][ j ]) /(2* dx ) ; // if on the if ( j == 0) vy = // otherwise else vy =
bottom edge , use forward difference ( v [ i ][ j +1] - v [ i ][ j ]) / dy ; use backward difference
( v [ i ][ j ] - v [ i ][ j -1]) / dy ; } // in corrector use x central difference , y forward difference else { // if on the left edge , use forward difference if ( i == 0) ux = ( u [ i +1][ j ] - u [ i ][ j ]) / dx ; // if on the right edge , use backward difference else if ( i == ( nx -1) ) ux = ( u [ i ][ j ] - u [i -1][ j ]) / dx ; // otherwise use central difference else ux = ( u [ i +1][ j ] - u [i -1][ j ]) /(2* dx ) ; // if on the top edge , use backward difference if ( j == ( ny -1) ) vy = ( v [ i ][ j ] - v [ i ][ j -1]) / dy ;
85
// otherwise use forward difference else vy = ( v [ i ][ j +1] - v [ i ][ j ]) / dy ; } return ( -(2/3) * mu [ i ][ j ]*( ux + vy ) + 2* mu [ i ][ j ]* vy ) ; // return ( -(2/3) * mu [ i ][ j ] + b [ i ][ j ]) *( ux + vy ) + (2* mu [ i ][ j ]) * vy ; } double Computations :: tauXY ( double ** u , double ** v , double nx , double ny , int i , int j , int n ) { double uy , vx ; // in x predictor use x backward difference , y central difference if ( n == 1) { // if on the left edge , use forward difference if ( i == 0) vx = ( v [ i +1][ j ] - v [ i ][ j ]) / dx ; // otherwise use backward difference else vx = ( v [ i ][ j ] - v [i -1][ j ]) / dx ; // if on the if ( j == 0) uy = // if on the else if ( j == uy = // otherwise else uy =
bottom edge , use forward difference ( u [ i ][ j +1] - u [ i ][ j ]) / dy ; top edge , use backward difference ( ny -1) ) ( u [ i ][ j ] - u [ i ][ j -1]) / dy ; use central difference
( u [ i ][ j +1] - u [ i ][ j -1]) /(2* dy ) ; } // in y predictor use x central difference , y backward difference else if ( n == 2) { // if on the left edge , use forward difference if ( i == 0) vx = ( v [ i +1][ j ] - v [ i ][ j ]) / dx ; // if on the right edge , use backward difference else if ( i == ( nx -1) ) vx = ( v [ i ][ j ] - v [i -1][ j ]) / dx ; // otherwise use central difference else vx = ( v [ i +1][ j ] - v [i -1][ j ]) /(2* dx ) ;
86
// if on the if ( j == 0) uy = // otherwise else uy =
bottom edge , use central difference ( u [ i ][ j +1] - u [ i ][ j ]) / dy ; use backward difference
( u [ i ][ j ] - u [ i ][ j -1]) / dy ; } // in x corrector use x forward difference , y central difference else if ( n == 3) { // if on the right edge , use backward difference if ( i == ( nx -1) ) vx = ( v [ i ][ j ] - v [i -1][ j ]) / dx ; // otherwise use forward difference else vx = ( v [ i +1][ j ] - v [ i ][ j ]) / dx ; // if on the if ( j == 0) uy = // if on the else if ( j == uy = // otherwise else uy =
bottom edge , use forward difference ( u [ i ][ j +1] - u [ i ][ j ]) / dy ; top edge , use backward difference ( ny -1) ) ( u [ i ][ j ] - u [ i ][ j -1]) / dy ; use central difference
( u [ i ][ j +1] - u [ i ][ j -1]) /(2* dy ) ; } // in y corrector use x central difference , y forward difference else { // if on the left edge , use forward difference if ( i == 0) vx = ( v [ i +1][ j ] - v [ i ][ j ]) / dx ; // if on the right edge , use backward difference else if ( i == ( nx -1) ) vx = ( v [ i ][ j ] - v [i -1][ j ]) / dx ; // otherwise use central difference else vx = ( v [ i +1][ j ] - v [i -1][ j ]) /(2* dx ) ; // if on the top edge , use backward difference if ( j == ( ny -1) ) uy = ( u [ i ][ j ] - u [ i ][ j -1]) / dy ; // otherwise use forward difference else uy = ( u [ i ][ j +1] - u [ i ][ j ]) / dy ;
87
} return ( mu [ i ][ j ]*( uy + vx ) ) ; // return ( mu [ i ][ j ] + b [ i ][ j ]) *( uy + vx ) ; }
8.3.9 /* * * * * * * */
logs.h
logs . h IsoFlow Created by Jeremy Fried on 6/20/07. Copyright 2007 Virginia Tech . All rights reserved .
# ifndef LOGS_H # define LOGS_H # include < fstream > # include < string > using namespace std ; class Logs { public : Logs () ; ~ Logs () ; static void print2D ( double ** output , int nx , int ny , char * filename ) ; }; # endif
8.3.10 /* * * * * * * */
logs.cpp
logs . cpp IsoFlow Created by Jeremy Fried on 6/20/07. Copyright 2007 Virginia Tech . All rights reserved .
88
# include " logs . h " Logs :: Logs () {} Logs ::~ Logs () {} void Logs :: print2D ( double ** output , int nx , int ny , char * filename ) { ofstream out ; out . open ( filename ) ; for ( int j = ny -1; j >= 0; j - -) { for ( int i = 0; i < nx ; i ++) { out