adapted to estimate noise-free values and to evaluate patch-similarity when the observed image is damaged by additive white Gaussian noise. We describe in ...
POLARIMETRIC SAR ESTIMATION BASED ON NON-LOCAL MEANS Charles-Alban Deledalle, Florence Tupin
Lo¨ıc Denis
Institut Telecom, Telecom ParisTech CNRS LTCI Paris, France
Observatoire de Lyon, CNRS CRAL UCBL, ENS de Lyon, Universit´e de Lyon Lyon, France
ABSTRACT During the past few years, the non-local (NL) means [1] have proved their efficiency for image denoising. This approach assumes there exist enough redundant patterns in images to be used for noise reduction. We suggest that the same assumption can be done for polarimetric synthetic aperture radar (PolSAR) images. In its original version, the NL means deal with additive white Gaussian noise, but several extensions have been proposed for non-Gaussian noise. This paper applies the methodology proposed in [2] to PolSAR data. The proposed filter seems to deal well with the statistical properties of speckle noise and the multi-dimensional nature of such data. Results are given on synthetic and L-Band E-SAR data to validate the proposed method. Index Terms— Non local means, maximum likelihood, polarimetric synthetic aperture radar (PolSAR) 1. INTRODUCTION Non-local (NL) approaches have been proposed by Buades et al. in [1] to denoise images damaged by additive white Gaussian noise. While local filters lead to biases and resolution loss, NL techniques are known to efficiently reduce noise and preserve structures. Instead of combining neighbor pixels, the NL means average similar pixels. Let vs be the observed noisy value at site s and us its underlying noise-free value. NL means provide the estimate u ˆs defined by: � w(s, t)vt (1) uˆs = �t t w(s, t) where t is a pixel index and w(s, t) is a data-driven weight depending on the similarity between pixels with index s and t. For robustness reasons, pixel similarity is evaluated by comparing surrounding patches around s and t with the use of the Euclidean distance: � � � (vs,k − vt,k )2 w(s, t) = exp − k (2) h Thanks to the DLR for providing the E-SAR data.
978-1-4244-9564-1/10/$26.00 ©2010 IEEE
2515
where s,k and t,k denote respectively the k-th pixels in the patches centered on s and t, and h is a filtering parameter. Equation (1) and Equation (2) are well adapted to estimate noise-free values and to evaluate patch-similarity when the observed image is damaged by additive white Gaussian noise. We describe in the following how this approach can be extended to handle speckle noise in the polarimetric case.
2. WEIGHTED MAXIMUM LIKELIHOOD The weighted average performed by NL means can be seen as a particular case of the weighted maximum likelihood (WML) estimation. ML based filters assume there exists redundant pixels and search the value which maximizes the likelihood over the set of redundant pixel values. Since this set is unknown, we propose to approach its indicator function with weights, which leads to the WML estimation: u ˆs = arg max u
�
w(s, t) log p(vt |u).
(3)
t
PolSAR data are damaged by speckle noise, described by a zero-mean complex circular Gaussian � � distribution [3] with a 3 × 3 covariance matrix T = E kk† , where k is a 3-dimensional complex vector and † indicates the transpose complex conjugate. Usually, the vector k is √ defined by k = [SHH , 2SHV , SV V ]t where SHH , SHV and SV V are the scattering coefficients associated with the three different transmitting and receiving polarizations: HH, HV and VV. The superscript t indicates the transpose of a vector. However, this vector can also be decomposed in the Pauli basis as k = √12 [SHH + SV V , SHH − SV V , 2SHV ]t to better reflect polarimetric properties. Eventually, the WML estimate of the covariance matrix is given by: ˆs = T
� w(s, t)kt k†t � . w(s, t)
(4)
IGARSS 2010
(a)
(b)
(c)
(d)
(e)
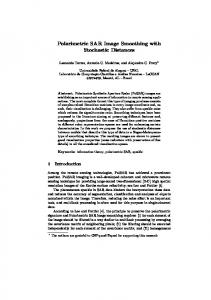
Fig. 1. Numerical experiment. Estimation of the complex covariance matrix (a) from corrupted data (b) following Goodman’s speckle model: (c) refined Lee estimation, (d) IDAN estimation, and (e) the proposed NL-PolSAR estimation. 3. SETTING OF THE WEIGHTS As mentioned in Section 2, the weights should approach the indicator function of the set of redundant patches. In order to consider the statistical nature of the observed image, we use the probabilistic criterion introduced in [2], where the weights are set according to: � 1/h [p(vs,k , vt,k |us,k = ut,k )p(us,k = ut,k )] . w(s, t) = k
(5) In the following the pixels s,k and t,k will be denoted respectively by 1 and 2 . The first term p(v1 , v2 |u1 = u2 ) reflects the likelihood of having identical (unknown) noise-free values with respect to the observed noisy image. A similar criterion has been applied in [4] to data damaged by additive white Gaussian noise. We extend here its definition as follows −1 −1 dΦ dΦ (v1 ) (v2 ) p(v1 , v2 |u1 = u2 ) = dv1 dv2
p(v1 |u1 = u)p(v2 |u2 = u) du (6) where the Jacobian terms are introduced to take into account the change of variables due to a mapping function Φ. The mapping Φ is introduced to obtain a dimensionless weight. Since the priors p(v1 |u1 = u) and p(v2 |u2 = u) are unknown, the authors in [2] assume the priors are uniform improper density functions. However, the integration is difficult to carry out over u while this quantity can instead be approached by the maximum likelihood similarity [5]:
ˆ MV from only two estimate of the covariance matrix T observations v1 and v2 becomes singular, i.e. it cannot be inverted. To avoid this problem, we suggest to ˆ MV to be diagonal. Then by choosing Φ : enforce T (|k.,1 |, |k.,2 |, |k.,3 |) �→ (|k.,1 |−1 , |k.,2 |−1 , |k.,3 |−1 ), equation (7) gives: � � |k1,1 | |k2,1 | − log p(k1 ,k2 |T1 = T2 ) ∝ log + + |k2,1 | |k1,1 | � � � � |k1,2 | |k2,2 | |k1,3 | |k2,3 | + + log + log . |k2,2 | |k1,2 | |k2,3 | |k1,3 | (8) It is important to note that the independence assumption is only done to compute the similarities between noisy patches. The final estimates, provided by the weighted maximum likelihood estimator, are full covariance matrices able to represent all polarimetric properties. The second term p(u1 = u2 ) tries to measure the prior probability to have equal noise-free values at sites 1 and 2 . In [6], the authors propose to use the Kullback-Leibler divergence on an estimate uˆ of u as a statistical test of the hypothesis u1 = u2 . We have also observed good performance in practice of such a definition: � 1 p(u1 = u2 ) = exp − SDKL T
p(v|ˆ u1 ) dv u1 ) − p(v|ˆ u2 )) log where SDKL = (p(v|ˆ p(v|ˆ u2 ) (9)
(7)
where u ˆ is an estimate of u and T a filtering parameter. For PolSAR data, the symmetric Kullback Leibler divergence between two zero-mean complex circular Gaussian distributions is given by: �
�
ˆ 2 + tr T ˆ 1 − 6. (10) ˆ −1 T ˆ 1, T ˆ 2 ) ∝ tr T ˆ −1 T SDKL (T 1 2
where u ˆMV is the maximum likelihood estimate over v1 and v2 . In the case of PolSAR data, the empirical
ˆ provides an iterative algoThe use of an estimate T rithm which refines the weights at each iteration. Start-
−1 −1 dΦ dΦ p(v1 , v2 |u1 = u2 ) ≈ (v1 ) (v2 ) dv1 dv2 p(v1 |u1 = u ˆMV )p(v2 |u2 = u ˆMV )
2516
ing with the identity matrix at each site s, the weights w(s, t) are then computed between each sites s and t as defined by Equation 5. Then a new covariance matrix ˆ s is given by using Equation 4. The procedure is then T repeated iteratively until convergence. Non-local approaches are known to leave a high variance in regions where there are too few redundant patches. In order to enforce a minimum amount of smoothing, we suggest to select when required, the ten most similar pixels according to the similarity between the patches at each iteration. 4. EXPERIMENTS AND RESULTS Synthetic single-look complex SAR images can be generated according to a given noise-free image of complex covariance matrices using the methodology proposed in [7]. Figure 1.a and 1.b present such a noise-free image and one of the noisy generated amplitude images. In all our experiments, the PolSAR images are presented with colorization based on the HSV (hue-saturation-value) color space built from intensity and entropy-alpha (Hα) decomposition [8]. Our proposed NL-PolSAR filter has been applied successfully on these noisy data. We use search windows of size 21 × 21, patches of size 7 × 7 and the parameters h and T are set automatically as explained in [2]. Our filter has been compared with the refined Lee estimator [9] and the IDAN estimator [10]. The obtained estimated images are given on Figure 1.ce. The proposed NL-PolSAR filter seems to provide the best quality image. The noise is well reduced while the resolution is well preserved. Moreover the use of intensity and H-α based color space shows that the scattering properties, such as interchannel information, seem better preserved by NL-PolSAR. We also applied our filter on three single-look complex SAR images (polarizations HH, HV and VV) of Dresden (Germany) sensed by E-SAR (L-Band). We used the same parameters as the ones used above on synthetic data. The result of NL-PolSAR is given on Figure 2 and compared to the original 512 × 512 single-look complex HH SAR data. Low saturated colors, close to gray colors, indicate regions of high entropy usually due to random scattering mechanisms (such as in homogeneous regions). By opposition, high saturated colors reflect low entropy regions, i.e. regions with usually double or triple bounce effects (such as building edges, streetlights...). The hue attributed to each pixel color depends on the estimated wave incidence angle α and the brightness depends on the estimated reflectivities. Comparisons with the other estimators are given on Figure 3. Preservation of building egdes and noise reduction in homogeneous areas seem to be better
Fig. 2. PolSAR images of Dresden (Germany) sensed by c E-SAR �DLR: (top) the single-look HH SAR image and (bottom) the NL-PolSAR filter. The colorization is based on intensity and entropy-alpha decomposition. achieved by NL-PolSAR. The entropy of the estimated images are also given. The NL-PolSAR provides higher and smoother entropy in homogeneous areas (random scattering mechanism) and low entropy with a better localization around building edges (double and triple bounce).
2517
6. REFERENCES [1] A. Buades, B. Coll, and J.M. Morel, “A Non-Local Algorithm for Image Denoising,” Computer Vision and Pattern Recognition, 2005. CVPR 2005. IEEE Computer Society Conference on, vol. 2, 2005. [2] C.A. Deledalle, L. Denis, and F. Tupin, “Iterative Weighted Maximum Likelihood Denoising with Probabilistic Patch-Based Weights,” IEEE Transactions on Image Processing, 2009.
(a)
(b)
[3] NR Goodman, “Statistical analysis based on a certain multivariate complex Gaussian distribution (an introduction),” Annals of Mathematical Statistics, pp. 152–177, 1963.
(c)
[4] Y. Matsushita and S. Lin, “A Probabilistic Intensity Similarity Measure based on Noise Distributions,” in IEEE Conference on Computer Vision and Pattern Recognition, 2007. CVPR’07, 2007, pp. 1–8. [5] F. Alter, Y. Matsushita, and X. Tang, “An intensity similarity measure in low-light conditions,” Lecture Notes in Computer Science, vol. 3954, pp. 267, 2006.
(d)
(e)
(f)
Fig. 3. (a)-(c) Estimated polarimetric image estimated by the refined Lee estimator, the IDAN estimator and our proposed NL-PolSAR estimator. (d)-(f) The estimated entropy for each of these respective estimators (black is zero and white is one). 5. CONCLUSION A non-local filter has been proposed to denoise polarimetric synthetic aperture radar images without significant loss of resolution. The proposed method searches iteratively the most suitable pixels to combine in order to produce the least biased noise-free estimate of the complex covariance matrix. The pixels are selected according to the joint similarity between the different channels of surrounding patches of noisy vectors and the joint similarity between patches extracted from preestimated noise-free covariance matrices. The obtained results demonstrate that the proposed method works well on synthetic and L-Band E-SAR data with good noise reduction without significant loss of spatial resolution. Moreover, the interchannel information seems to be well preserved during the denoising procedure. Comparison with other filters, such as the refined Lee and IDAN, demonstrates the efficiency of this new appealing methodology.
2518
[6] J. Polzehl and V. Spokoiny, “Propagationseparation approach for local likelihood estimation,” Probability Theory and Related Fields, vol. 135, no. 3, pp. 335–362, 2006. [7] J.S. Lee, SR Cloude, KP Papathanassiou, MR Grunes, and IH Woodhouse, “Speckle filtering and coherence estimation of polarimetric SAR interferometry data for forest applications,” IEEE Transactions on Geoscience and Remote Sensing, vol. 41, no. 10 Part 1, pp. 2254–2263, 2003. [8] S.R. Cloude and E. Pottier, “An entropy based classification scheme for land applications of polarimetric SAR,” IEEE Transactions on Geoscience and Remote Sensing, vol. 35, no. 1, pp. 68–78, 1997. [9] J.S. Lee, MR Grunes, and G. De Grandi, “Polarimetric SAR speckle filtering and its implication for classification,” IEEE Transactions on Geoscience and Remote Sensing, vol. 37, no. 5 Part 2, pp. 2363–2373, 1999. [10] G. Vasile, E. Trouv´e, J.S. Lee, and V. Buzuloiu, “Intensity-Driven Adaptive-Neighborhood Technique for Polarimetric and Interferometric SAR Parameters Estimation,” IEEE Transactions on Geoscience and Remote Sensing, vol. 44, no. 6, pp. 1609, 2006.