lung cancer cell can spread to brain and cause tumor, this is referred as lung .... Actual data from the diffusion weighted imaging is been used for computation of ...
International Journal of Computer Applications (0975 – 8887) Volume 95– No.5, June 2014
Review on Brain Tumor Detection and Segmentation Techniques Mansa S Mane
Nikita J Kulkarni
Santosh N Randive
PG Scholar Department of Computer engg. ZES’s DCOER, Pune
Assistant Professor Department of Computer engg. ZES’s DCOER, Pune
Assistant Professor Department of E & Tc engg. ZES’s DCOER, Pune
ABSTRACT Brain is a spongy mass of tissues protected under skull which controls entire body motion through signals. Brain tumor is caused due to formation of extra cells in brain due to new cells build up while existences of older or damaged cells for an unknown reason. Detection of brain tumor area is crucial for irregular shapes and their diverse volumes. This paper discusses on study of various brain tumor detection and segmentation techniques.
In general when cells grow older or gets damaged it is replaced by new cells, but think of a situation when the old or damaged cells doesn’t destroy and new cells build up, then this extra cells form a mass of tissue called as tumor.
General Terms Image processing, Detection, Thresholding and Watershed Segmentation
Keywords CCA, PCA, Eigen vector, Geodesic distance, Fourier Transform, 3D slicer
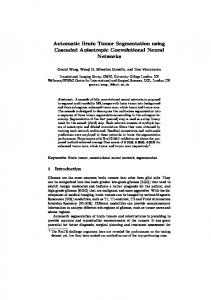
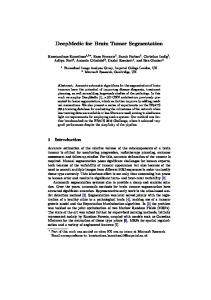
1. INTRODUCTION The brain is a soft, spongy mass of tissue. It is protected by: bones, three thin layers of tissue called as meninges and a watery fluid known as cerebrospinal fluid which flows between the meninges and ventricles within the brain. The brain is in charge of our senses, memory, emotions, and personality. A network of nerves carries messages back and forth between the brain and the rest of the body. Glial cells surround nerve cells and hold them in place. The three major parts of the brain are: (a) Cerebrum (instructs are body to respond to its surroundings), (b) Cerebellum (controls balance of our body) and (c) Brain Stem (it connects brain with the spinal cord).
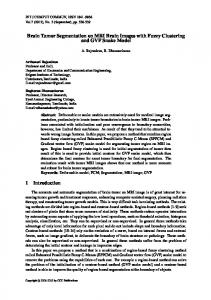
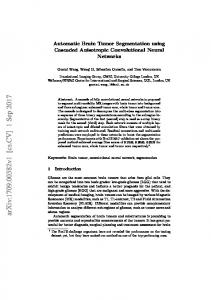
Fig 2: Image of brain detected with cancerous cells
1.1 Tumors Types 1.1.1 Primary brain tumors - A tumor which begins in brain is called primary brain tumor it can be either malignant (cancerous) or benign (non-cancerous).
1.1.2 Secondary brain tumors – A cancerous tumor which starts from other part of body and end up in brain is known as secondary or metastatic brain tumor. For example, lung cancer cell can spread to brain and cause tumor, this is referred as lung cancer with brain secondary. Depending upon the abnormality of cell appearance and aggressive growth (under microscope), tumors is classified into grades (more the grade number more aggressive is the tumor growth):
Grade I: The tissue is said to be benign, grows slowly and resembles like the healthy cell.
Grade II: The tissue is said to be malignant, tissues doesn’t resemble like the regular cell.
Fig 1: Brain structure image
Grade III: These malignant tissues are the cells which are more irregular to look at and rapidly growing.
34
International Journal of Computer Applications (0975 – 8887) Volume 95– No.5, June 2014
Grade IV: These malignant tissues are the most abnormal and tend to grow at faster rate.
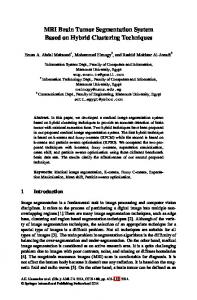
Infratentorial Supratentorial Hemispheric Supratentorial midline
Fig 3: Location and types of tumor in brain
1.2 Risk Factors for Brain Tumor Researchers have studied whether people with certain risk factors are more likely to develop brain tumors than others:
Ionizing radiation: Ionizing radiation contains high range of x-rays which cause cell damage that can lead to tumor. Family history: Small ratios of members from one family are seen with brain tumor cases. Other factors: Research is been carried on use of cell phones, head injury or more expose to chemicals might cause brain tumor.
1.3 Symptoms Few most common symptoms of brain tumors are: headaches, nausea and vomiting, change in speech, vision, or hearing, mood, personality, problems memory, balancing or walking, ability to concentrate, muscle jerking or twitching and numbness or tingling in the arms or legs.
1.4 Diagnosis and Treatment Certain diagnosis patient must undergo when suffering from brain tumor symptoms are: neurological exam, MRI, CT scan, angiogram, spinal tap, biopsy, etc. The treatment options are surgery, radiation therapy and chemotherapy. According to researchers there are 40 percent chances of regrowth of tumor cells. Vasioukhin et al [1] discovered a gene known as lethal giant larvae 1 (Lgl1) identified in Drosophila, which plays a critical role in shaping of cells during embryonic brain development in mammals. This study evaluates various techniques for detection and segmentation of tumor area in brain.
2. LITERATURE SURVEY Pratik et al [2] presented a paper that detects and calculates area of brain tumor from MR Image. The axial MR Image is loaded into memory as input. This input image is feed for conversion from RGB to Gray scale format to make image noise free. The gradient magnitude is computed using the linear filtering method and sobel mask, which is a 2D vector that points to the direction in which the image intensity grows fastest. The basic principle of watershed segmentation is to
transform the gradient of a gray level image in a topographic surface which can be built up by flooding process on a gray tone image. The drawback of watershed segmentation is that it produces number of segmented regions in image leading to over segmentation at each local minima of embedded image. The solution to this problem is introduction of internal and external markers which are produced by gray scale image and finding pixels between the internal markers respectively which in turn produce watershed ridgelines which are superimposed on the original image for final segmentation. CCA (Connected component analysis) extracts the region which is not separated by boundary of final segmented region called as connected component which is further partitioned into segments for calculation of affected area in pixels. Thus from the literature it is observed that use of marker watershed segmentation with connected component analysis calculates tumor area with the smallest unit measurement of pixel. Gouskir et al [3] presented a paper for detection, segmentation and contour extraction of MRI – T1 and T2 in biomedical images for brain tumor. Correlation is the basic operation performed to determine center coordinates of tumor and for information extraction from images by using related methods for finding location in an image that resemble a texture template as tumor and in the database. Covariance matrix obtained by covariance pixel is to have image histogram to automatically extract the area that contains the abnormality. PCA (principal component analysis) is a statistical method for elimination of redundant information and differentiate the classes containing the images by histogram of MRI. Classes are classified based on gray and white matter located in the brain tumor. Geodesic distance is an efficient image segmentation technique for distinguishing white matter and gray matter of pathological tissues such as edema and tumor. Geodesic ball can be evaluated by a fast marching algorithm for classifying each intensity pixel for region of interest. Eikonal equation is solution for fixed and unique viscosity of geodesic distance. To correctly identify the margin of tumor invasion Riemannian manifold of diffusion tensor is proposed. Actual data from the diffusion weighted imaging is been used for computation of geodesic distance. The principal eigen vector along with greater diffusion assign anisotropic and isotope diffusion for gray and white matter respectively. Hence by observation the segmentation is automatically retrieved from statistical calculation of distance between geodesic and tumor location. Large database is required for storing different texture templates and sometimes intensity of bone might be greater than tumor. Vinay et al [4] introduces contrast stretching technique to improve interpretability of information in images for human viewers. The input image is feed for enhancement which works by sorting the pixels within the adjacent, replacing the original pixel by finding median value. Contrast stretching method is used for adjusting intensity values in images. Image enhancement technique is of two kind spatial domain and frequency domain. In spatial domain all pixels composing an image is considered and different procedures are implemented whereas in frequency domain operates on the Fourier transform of an image. Gaussian high pass filtering use distance matrix to enhance image and highlight the intensity of transitions in the image. Histogram enhancement technique is used for uniform intensity throughout. Segmentation is done using a selected threshold value for series of morphological operations such as erosion (shrink), dilation (expand) and finally combine them. Thus the output of tumor image is clearly shaped and outlined for human eye.
35
International Journal of Computer Applications (0975 – 8887) Volume 95– No.5, June 2014 Kavitha et al [5] used a combination of watershed and thresholding algorithm on multilayer perceptron for segmentation of brain tumor in MRI. The input is a 2D MRI color image of size 256*256 is stored in the database. Unwanted signal is removed using Gaussian smoothing which produces a contour of concentric circles from the center point for building convolution matrix to be applied on the original matrix. Improved watershed segmentation is used which is a combination of thresholding and morphological operations. Thresholding converts of gray image to binary image for displaying affected tumor area. Light particles generated are separated from darker shades and set to black. Classification is performed based on the neural network method called as Multilayer Perceptron (MLP) which consists of multiple nodes in a directed graph, to map set of input data onto set of appropriate output. Peak signal to noise ratio (PSNR) is easily defined by mean squared error (MSE). The PSNR is used for analysis and gives better and accurate tumor part from the source image compared to k-means method. Thus from the literature it is observed that combination of algorithms and use of PSNR results in accurate calculation of affected area. Sushma et al [6] presents the solid cum cystic tumor in the form that can be easily recognized by any person using surface model making, automatic calculation of the volume using 3D slicer. Image enhancement is applied by loading the volume for all slices in the axial, sagittal and coronal views of T2 images from dicom file. Window level preset (WLP) is used for brighter appearance of solid and cyst with respect to T2 and contrast enhanced T1 images. The 3D slicer label mapping gives best and accurate result of boundary region with resulting area labeled automatically. Green and red colors are used for differencing cystic and solid part respectively. Models are loaded in the module for loading, saving, changing and organizing 3D surface models which are generated by marching cubes model and run triangle reduction and smoothing algorithms. Model hierarchy helps to view combination of solid cum cystic tumor. The brain model of the slicer is obtained on the default VTK. When the marching cubes algorithm is running voxel calculation is done and keeps the record of info tab. The results of 3D slicer are matched with the original radiology report for accuracy check. Evaluation is performed through quantitative comparison using volume and surface measures. The results show that the segmentation of caudate nuclei is better compared to thalamus due to their well defined borders and MPFCM method is faster than the multiphase level sets method. The observed response time for processing system is 176 milliseconds for each image analysis. Hence it saves lot of time of surgeons and radiologist providing modern technique and 99.9% efficiency in segmenting out tumor area. Deepak et al [7] presented a review paper that shows MR images stored in DICOM format (.dcm) produce more efficient results comparative to non medical images. Selka et al [8] proposed a system in which segmentation of brain tumor using watershed for grouping pixels based on their intensities and thresholding for conversion of gray scale image into binary format. A boundary extraction of tumor is done for removal of noise using canny edge detection which is further smoothed through convolution operation with Gaussian derivative in both x and y directions.
Result:
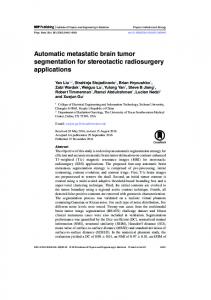
Fig 4: Result of marker watershed and CCA Calculated tumor area = 1263 pixel Marker based watershed segmentation forms watershed ridgeline from internal and external markers which is superimposed on input image and tumor area is calculated with CCA in pixels.
Technique 2: Contrast stretching, Fourier transform, Gaussian high pass filtering, morphological operations.
Result:
(a)
(d) (a) (b) (c) (d) (e)
(b)
(c)
(e) Contrast stretching Fourier Transform Histogram enhanced image Image after threshold Output Image
Fig 5: Result of contrast stretching, FFT and histogram Applying this technique increases the interpretability of output tumor image for human eye.
Technique 3: Geodesic distance, covariance matrix and pixels, Principal component Analysis, Eikonal equation, Riemannian manifold.
Result:
3. RESULTS Technique 1: Marker based watershed segmentation and Connected Component Analysis.
36
International Journal of Computer Applications (0975 – 8887) Volume 95– No.5, June 2014
Technique 5: 3D slicer, Window level preset (WLP), MPFCM.
Result: Classifying tumor type with the calculation of accuracy with the following formula where Ls and Lr are maximum tumor size of segmentation and radiology report resp. Error = Ls – Lr; RE (%) = (Ls – Lr/ Lr)* 100; Accuracy = 100 - error; Table 2. Tumor type classification based on accuracy check of the 3D slicer
(a) (b) (c) (d)
Test image Covariance histogram for detection Segmentation by geodesic distance Extracting the area of tumor cell accurately
Fig 6: Result of geodesic distance and Riemannian manifold Automatic extraction of brain tumor with geodesic distance, covariance histogram and statistical method.
Technique 4: Watershed, Thresholding, Multilayer Perceptron (MLP), Peak signal to noise ratio (PSNR).
Result: Comparison table for values of PSNR of k-means and IWMP method. Table 1. PSNR value for k-means and IWMP method
4. CONCLUSION AND FUTURE WORK From Literature survey, it is conclude that contrast stretching technique improves quality and interpretability of images. Storing of source images in DICOM format increases processing time and provides better results than other non medical image formats. Use of geodesic distance on Riemannian manifolds helps in automatic extraction and segmentation of brain tumor. PSNR and CCA analysis proves to calculate accurate tumor area in pixels. Through quantitative comparison of volume and surface measures MPFCM method is observed to be faster than the multiphase level sets method, which almost equals the response time to 176 milliseconds. The efficiency of 99.9% is achieved with these modern techniques and saves lot of time of radiologist and surgeons for better and in-time treatment of brain tumor. The work can be extended further by combing the existing algorithms and development of new technique for better computational time in detection and segmentation of brain tumor. The on going research on gene lethal giant larvae 1 (lg1) by Vasioukhin et al [1] at cold spring harbor laboratory is tested on mice for cell polarity (regulating the overall directionality of cell) if it can efficiently manage cell growth in mammals, then the gene can be injected into body of mammals for preventing further formation of new cancerous cell in brain.
37
International Journal of Computer Applications (0975 – 8887) Volume 95– No.5, June 2014
5. REFERENCES [1] Vasioukhin lab https://www.fhcrc.org/en/news/centernews/2004/04/brain-cancer.html
study,
[2] Pratik P. Singhai, Siddharth A. Ladhake, “Brain Tumor Detection Using Marker Based Watershed Segmentation from Digital MR Images”. IJITEE, ISSN 2278-3075, Volume (2), Issue (5), April 2013. [3] M. Gouskir, M. Boutalline, B. Bouikhalene, H. Aissaoui, B. Elhadadi, “Automatic Brain Tumor Extraction for MRI-T1 and T2 using Geodesic Distance and Statistical Methods”. IJARCSSE, ISSN 2277 128X, Volume (3), Issue (12), December 2013. [4] Vinay Parameshwarappa, Nandish S, “A Segmented Morphological Approach to Detect Tumor in Brain Images”. IJARCSSE, ISSN 2277 128X, Volume (4), Issue (1), January 2014.
IJCATM : www.ijcaonline.org
[5] A. R. Kavitha, S. Rekha, “Brain Cancer Segmentation In MRI Medical Image Using Combined Watershed Algorithm And Thresholding With Multilayer Perceptron (CWTMP) Neural Network”. IJCST, Volume (2), Issue (1), Jan-Feb 2014. [6] Sushma Laxman Wakchaure, Ganesh Dynandev Ghuge, Dyandev S. Musale, “The Detection and Visualization of Brain Tumors on T2- Weighted MRI Images Using Multiparameter Feature Blocks”. IJETAE, ISSN 22502459, Volume (4), Issue (2), February 2014. [7] Deepak. C. Dhanwani, Mahip M. Batere, “Survey on Various Techniques of Brain Tumor Detection From MRI Images”. IJCER, ISSN 2250-3005, Volume (4), Issue (1), January 2014. [8] R. G. Selka, M. N. Thakare, B. J. Chilke, “Review on Detection and Segmentation of Brain Tumor Using Watershed and Thersholding Algorithm”. IORD Journal of Science and Technology, E-ISSN 2348-0831, Volume (1), Issue (2), Jan-Feb 2014.
38