Estuaries
Vol. 27, No. 3, p. 378–388
June 2004
Spatial and Temporal Patterns in Sediment and Water Column Nutrients in a Eutrophic Southern California Estuary KARLEEN A. BOYLE, KRISTA KAMER, and PEGGY FONG* University of California, Los Angeles, Department of Organismic Biology, Ecology, and Evolution, 621 Charles E. Young Drive South, Los Angeles, California 90095-1606 ABSTRACT: Quarterly field sampling was conducted to characterize variations in water column and sediment nutrients in a eutrophic southern California estuary with a history of frequent macroalgal blooms. Water column and sediment nutrient measures demonstrated that Upper Newport Bay (UNB) is a highly enriched estuary. High nitrate (NO3⫺) loads from the river entered the estuary at all sampling times with a rainy season (winter) maximum estimated at 2,419 mol h⫺1. This resulted in water NO3⫺ concentration in the estuary near the river mouth at least one order of magnitude above all other sampling locations during every season; maximum mean water NO3⫺ concentration was 800 M during spring 1997. Phosphorus (P)-loading was high year round (5.7–90.4 mol h⫺1) with no seasonal pattern. Sediment nitrogen (N)-content showed a seasonal pattern with a spring maximum declining through fall. Sediment and water nutrients, as well as percent cover of three dominant macroalgae, varied between the main channel and tidal creeks. During all seasons, water column NO3⫺ concentrations were higher in the main channel than in tidal creeks while tidal creeks had higher levels of sediment total Kjeldahl nitrogen (TKN) and P. During each of the four sampling periods, percent cover of Enteromorpha intestinalis and Ceramium spp. was higher in tidal creeks than in the main channel, while percent cover of Ulva expansa was always higher in the main channel. Decreases in sediment N in both creek and channel habitats were concurrent with increases in macroalgal cover, possibly reflecting use of stored sediment TKN by macroalgae. Our data suggest a shift in primary nutrient sources for macroalgae in UNB from riverine input during winter and spring to recycling from sediments during summer and fall.
producers has been well documented (Nixon and Pilson 1983; Josselyn and West 1985; Hopkinson and Vallino 1995; Page et al. 1995; McClelland and Valiela 1998). Although the importance of riverine inputs to estuarine nutrient supplies has been well established in east coast and gulf estuaries of the United States, there are few studies of west coast estuaries (Page et al. 1995; Smith et al. 1996). In some estuaries, recycling of nutrients sequestered in sediments and macroalgae contributes to nutrient availability to a degree equal to or greater than allochthonous inputs (Gabrielson 1981; Sfriso et al. 1989; Marcomini et al. 1995). Shifts in nutrient supplies to primary producers from water column sources to benthic sources have been observed in many systems (Lavery and McComb 1991; Marcomini et al. 1995; Cowan et al. 1996; Risgaard-Petersen et al. 1998; Trimmer et al. 2000). Several studies have demonstrated recycling of nutrients within an estuary between sediments and macroalgal mats (McComb et al. 1981; Owens and Stewart 1983; Josselyn and West 1985; Lavery and McComb 1991). The roles of external nutrient loading versus internal cycling have not been established in most estuaries of the west coast of the United States (Williams and Zedler 1992; Bricker et al. 1999). While monitoring of Tomales Bay, California, has
Introduction Spatial and temporal variations in estuarine nutrients have been extensively studied, largely because of their importance to estuarine primary producers (Birch et al. 1981; Nixon et al. 1995; Cowan and Boynton 1996; Fong et al. 1996). In many regions, anthropogenic nutrient sources must be considered in conjunction with natural seasonal variations in estuarine nutrients (Boynton et al. 1996; Uncles et al. 1999; Michel et al. 2000). Recently, the effects of anthropogenic eutrophication on estuarine nutrient dynamics and its impacts on macroalgal blooms have received particular attention, especially in shallow estuaries (Sfriso et al. 1987; Lavery and McComb 1991; Valiela et al. 1992; Taylor et al. 1995; Peckol and Rivers 1996). In many estuaries, nutrient supplies are primarily controlled by the influx of freshwater from rivers (Cambridge and McComb 1984; Castel et al. 1996; Staver et al. 1996; Mackas and Harrison 1997) and vary both seasonally and annually, depending on the volume and nutrient concentration of river flow. The link between watershed inputs and nutrient supplies to estuarine primary * Corresponding author; tele: 310/825-5444; fax: 310/2063987; e-mail:
[email protected] 䊚 2004 Estuarine Research Federation
378
Nutrient Dynamics in a Eutrophic Estuary
provided one of the most comprehensive data sets for a west coast estuary (Smith et al. 1987, 1991; Dollar et al. 1991; Smith and Hollibaugh 1997), these data may not be directly applicable to southern California estuaries. Southern California systems function as marine embayments or lagoons much of the year (Fong 1986; Onuf 1987) and are subject to highly seasonal nutrient supply due to episodic freshwater flow associated with individual storms during the wet season (October–April). Seasonal shifts in macroalgal abundance and composition have been documented for one southern California estuary (Kamer et al. 2001). Algal blooms dominated by the green alga Enteromorpha intestinalis began in spring and continued into summer and fall when dominance shifted to the green alga Ulva expansa and a red alga in the genus Ceramium. This pattern of succession is similar to that of tidal inlets on the south coast of England (Trimmer et al. 2000) and eutrophic Mediterranean estuaries such as Venice Lagoon (Sfriso et al. 1989) and the Peel-Harvey estuarine system in Australia (Lukatelich and McComb 1986). The objectives of this study were to begin to characterize spatial and temporal variations in water column and sediment nutrient concentrations, to estimate loading of nutrients from the watershed in different seasons, and to investigate the relationship between water column and sediment nutrients and macroalgal blooms in two habitat zones of Upper Newport Bay. Materials and Methods Upper Newport Bay (UNB), Orange County, California, U.S., is one of the largest estuaries remaining in southern California. It has exhibited signs of eutrophication for over 25 yr, including extensive macroalgal blooms (California Regional Water Quality Control Board 1997; U.S. Environmental Protection Agency [U.S. EPA] 1998) and localized, episodic reductions in dissolved oxygen (Alex Horne and Associates [AHA] 1998). The Newport Bay watershed is 399 km2, and is comprised of urban areas (64%) interspersed with commercial nurseries and agriculture (12%; U.S. EPA 1998). San Diego Creek (SDC) is the primary source of freshwater to the estuary and has a history of high nitrate (NO3⫺) loads (Blodgett 1989). Total annual nitrogen (N) loading was estimated at 417,080 kg (8-yr average; U.S. EPA 1998). On average, 28% of this loading was attributed to urban sources, 55.1% to agricultural sources, 15.8% to point sources, and 1.2% to open space (U.S. EPA 1998). There was high seasonal variability in nutrient loading to the Bay. While dry season (May–September) NO3⫺ concentrations in SDC averaged 4 times higher than in the wet season (Oc-
379
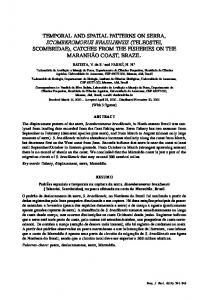
Fig. 1. Location of Upper Newport Bay (UNB) estuary in Orange County, California, with sampling sites marked (1–9).
tober–April), lower NO3⫺ concentrations in high flows during the wet season were thought to dominate annual loading (data from 1969–1999; Schiff and Kamer 2000). Nine stations along a 3-km section of UNB were sampled during winter (December 1996), spring (March 1997), summer ( June 1997), and fall (September 1997; Fig. 1). During each sampling period, water salinity and nutrients and sediment nutrients were quantified. We did not sample in the Lower Bay as it has been heavily modified by dredging and channelization. Station 1 was closest to the Lower Bay, which opens to the Pacific Ocean, while station 8 was closest to SDC but within the estuary. A ninth station was located in the mouth of SDC in order to characterize the freshwater flow entering the estuary. Only water data were collected at station 9 because the substrate was concrete. Stations were established on the main channel of the estuary (stations 1, 4, 5, and 8) as well as in smaller meandering tidal creeks (stations 2, 3, 6, and 7). All of the sampling stations were intertidal and were exposed to a mixed diurnal tide 1–2 times daily, depending on the season. Main channel stations were characterized by large expanses of mudflats, while creek stations had steeply sloped banks. The tidal creeks were extensions off the main channel, carved into tidal marshes by the incoming tide. With the exception of station 3, the tidal creeks had no direct freshwater source except precipitation. Station 3 was located near the outlet of a small freshwater marsh fed by street runoff. The dominant vegetation of tidal marshes adjacent to stations 1, 3, and 8 was Salicornia virginica (pickleweed); marshes adjacent to stations 2, 4, 5, 6, and 7 were dominated by Spartina foliosa (cordgrass). Three replicate water samples were taken at
380
K. A. Boyle et al.
each station on each sampling date. Previous data have shown that UNB is rarely stratified (U.S. Army Corps of Engineers 1993), so all samples were taken from midwater column. Samples were placed on ice in a dark cooler and transported to the laboratory within 6 h of collection. Salinity (⫾1) was measured using a hand-held refractometer. Samples were filtered through Whatman GF/C glass fiber filters, frozen, and analyzed for total Kjeldahl nitrogen (TKN), NO3⫺, ammonium (NH4⫹), and total phosphorous (TP) by the Division of Agriculture and Natural Resources (DANR) Analytical Laboratory at University of California, Davis. TKN was measured using the Kjeldahl method (Bremner and Mulvaney 1982) and does not include N from heterocyclic or oxidized forms. NH4⫹ and NO3⫺ were measured by the diffusion-conductivity method (Carlson 1978). TP in seawater was determined by inductively coupled plasma atomic emission spectrometry (Franson 1985) following a nitric acid-hydrogen peroxide microwave digestion ( Johnson and Ulrich 1959). The method detection limits (MDL) for all forms of N and P were 3.57 M N and 1.61 M P, respectively. Due to these relatively high detection limits, any values below the MDL were defined as one-half the detection limit for use in all statistical tests and loading rate calculations. Water nutrient and salinity data were analyzed using 2-factor analysis of variance (ANOVA; factors: season and station). Data were tested for normality and homogeneity of variance to ensure that they conformed to assumptions of ANOVA. No transformations were necessary for water column salinity, NO3⫺ or NH4⫹. Unequal variances in TKN and TP were corrected with a natural log transformation. Untransformed data were used when reporting means in text and graphics. Nutrient loading rates to UNB from SDC on each sampling date were estimated using stream flow data from a continuously operating stream gauging station near the confluence of SDC and UNB (operated by Orange County, California). To estimate nutrient loading we multiplied the mean daily discharge of SDC on the sampling date by the mean water column concentration of each nutrient recorded at station 9. Sediments were sampled concurrently with water samples and in spring (March) 1998, after a flood associated with an El Nin ˜ o Southern Oscillation (ENSO) event. A stratified random sampling design was used, with two parallel transects following elevational contours at each station. The upper transect was parallel to and 0.5 m downslope of the edge of vascular vegetation. The placement of lower transects differed between creeks and the main channel due to differences in topography. For sta-
tions along the main channel, the lower transects were established parallel to the upper strata and 1.5 m downslope of the vascular vegetation line. In tidal creeks, the lower transects were always positioned along the bottom of the creek. Because creeks were narrow, the lower transects were usually approximately 1.5 m below the upper transect. Sediment cores were taken at five randomly selected points along each 30-m transect. During the first sampling period (winter 1996) sediment samples were not taken for the lower strata of stations 6, 7, and 8. Sediments were cored (2.5-cm internal diam) to a depth of 5 cm; care was taken to exclude macroalgae. Cores were sealed in plastic bags, maintained on ice in a dark cooler, transported to the lab, and frozen within 6 h of collection. Frozen cores were dried at 60⬚C to a constant weight, ground with mortar and pestle, and analyzed for TKN and TP by DANR Analytical Laboratory. TKN was determined using standard Kjeldahl procedure with sulfuric acid and digestion catalyst (Issac and Johnson 1976; Carlson 1978). TP was determined by microwave acid digestion-dissolution of sample (Sah and Miller 1992) followed by atomic emission spectroscopy. The MDL for sediment N and P were 0.001% and 0.01%, respectively. All sediment data conformed to the assumptions of ANOVA; no transformations were necessary. Sediment nutrient data were analyzed using 3-factor ANOVA (factors: season, station, and stratum). Because the 3-factor ANOVAs showed no significant effect of stratum, these data were re-analyzed using 2-factor ANOVA (factors: season and station). When there was no interaction between the two factors, within factor post hocs (Fisher’s protected least significant difference; PLSD) were conducted. Percent cover of the three dominant macroalgae was measured synoptically with water and sediments during each season along the same sets of 30-m transects using a 0.25 m2 point-intercept quadrat (see Kamer et al. 2001). The quadrat was placed on the benthos at 10 randomly chosen points along the transect in each stratum and percent cover of each macroalgal species was recorded. Differences in water column and sediment nutrients and percent cover of macroalgae among seasons and between habitat types (main channel versus tidal creek) were evaluated. Data were tested for normality and homogeneity of variance to ensure that they conformed to the assumptions of ANOVA. No transformations were necessary for sediment, macroalgae, or water NH4⫹ or TKN. Unequal variances in water NO3⫺ and TP were corrected by applying a log(x ⫹ 1) transformation.
Nutrient Dynamics in a Eutrophic Estuary
381
Fig. 2. Spatial and seasonal variation of water column salinity, all forms of water nitrogen, and water column total phosphorus in Upper Newport Bay (UNB) during winter 1996, spring 1997, summer 1997, and fall 1997. Error bars are ⫾1 SE.
The effect of habitat type and season on water column nutrients was analyzed using 2-factor ANOVA (factors: season and habitat type). Because 3-factor ANOVA for channel versus creek sediment measures showed no significant effect of stratum, these data were re-analyzed using 2-factor ANOVA (factors: season and habitat type). The effects of habitat type on percent cover of all three macroalgae combined and individually were tested using 2-factor ANOVA (factors: season and habitat type) as strata was not significant. Within factor post hocs (PLSD) were conducted after ANOVA without interaction. Results SPATIAL AND TEMPORAL PATTERNS IN WATER COLUMN NUTRIENTS There was a strong seasonal pattern in salinity with lowest values in winter for all stations except 9, which was similar in winter and spring (Fig. 2). Freshwater influence was detected at all sampling stations during winter with salinity ⱕ24 throughout the estuary. Salinity was lower at station 3 than at adjacent stations in winter. For the rest of the year, UNB was a marine embayment as inflow from SDC had little influence on salinity at stations 1–7. During all seasons, salinity was depressed at stations 8
and 9, reflecting proximity to SDC. There was a significant interaction between season and station on salinity because salinity patterns during winter differed from all other seasons sampled. NO3⫺ concentrations were strongly affected by proximity to SDC (Fig. 2). Water NO3⫺ at stations 8 and 9 was at least five times higher than any other sampling location during each season, reaching maximum mean concentrations of 730 and 800 M, respectively, during spring. NO3⫺ levels at all other stations during spring were less than 85 M. Water NO3⫺ concentration was lowest during fall at all sampling stations. Significant interaction occurred between season and station for water column NO3⫺ because mean NO3⫺ concentration at station 3 was slightly elevated compared with adjacent stations in winter, but not in any other season. Mean water column NH4⫹ was highest and most variable during winter, when maximum NH4⫹ concentrations were measured at station 3 (Fig. 2). NH4⫹ declined at all sampling stations during spring and summer. In both of these seasons, NH4⫹ was highest midestuary at station 4. Water column NH4⫹ was lowest in fall for stations 1–7; during this season maximum concentrations were found near the head of the estuary. Significant interaction oc-
382
K. A. Boyle et al.
Fig. 3. Mean monthly discharge of San Diego Creek (SDC) into Upper Newport Bay (UNB) for water years July 1996 to June 1998 (Source: Orange County, California). Data were recorded by a continuously operating stream gauging station near the point where San Diego Creek enters Upper Newport Bay.
curred between season and station for water column NH4⫹ because patterns of NH4⫹ during winter differed from all other seasons sampled. Water column TKN concentrations were similar at all stations in winter and spring (Fig. 2). All stations showed an increase in TKN in summer with concentrations more than double that in spring. By fall, water column TKN levels declined to levels approximating winter and spring levels. There was significant interaction between season and station for water column TKN because spatial patterns varied within seasons. Water TP was highest in winter at all but one station (Fig. 2). During this season, water column P was highest at the head of the estuary then declined as distance from SDC increased. This pattern did not occur during spring, but TP was higher in stations 8 and 9 in both summer and fall. Significant interaction occurred between season and station for water column TP due to differing spatial patterns among seasons. SEASONAL PATTERNS IN NUTRIENT LOADING Flow rates of SDC were approximately seven times higher in winter than spring (Fig. 3) and
were especially high in the 1997–1998 ENSO season. Because mean daily flow rates of SDC were so much higher in winter, estimated loading of all forms of nutrients was highest in winter (Table 1). The lowest NO3⫺ loading to the bay occurred during fall when both water column NO3⫺ concentrations and SDC flow rates were lowest. Estimated NH4⫹ loading to the bay declined from the winter high to less than a third in both spring and fall. The lowest NH4⫹ loading to the Bay occurred in summer when NH4⫹ levels in all water samples from station 9 were below detection limits. TKN loading also peaked in winter and declined in spring. TKN loading more than doubled from spring levels in summer, declining again in fall 1997. Loading of P declined from winter values throughout the rest of the year. PATTERNS
SEDIMENT NUTRIENT CONCENTRATION AMONG STATIONS Sediment TKN concentrations were significantly affected by both season and station. Sediment TKN was highest in spring 1997 compared to all other seasons (within factor PLSD; p ⬍ 0.01 for all comparisons). Sediment TKN exhibited high spatial variability throughout the estuary; across all seasons, stations 5 and 8 were significantly lower than the other stations (within factor PLSD; p ⬍ 0.05 for all comparisons). A comparison of sediment TKN in spring 1997 and spring 1998 contrasts within season sediment TKN during flood and nonflood years. Sediment TKN at each station was lower in the spring following the flood than it had been the previous spring (PLSD; p ⫽ 0.0001). Sediment TP concentrations were significantly affected by station, but not season (Fig. 4). There was little spatial pattern along the estuarine gradient. Sediment TP showed far less spatial variability throughout the estuary than sediment TKN. IN
COMPARISONS
BETWEEN TIDAL CHANNEL
CREEKS
AND
MAIN
Water NO3⫺ concentration varied significantly with season and habitat type (Fig. 5). During all seasons, the main channel had higher concentra-
TABLE 1. Estimated nutrient loading to Upper Newport Bay (UNB) via San Diego Creek (SDC). Flow rate data presented are daily mean flows of SDC recorded by a continuously operating stream gauging station (County of Orange, California) near the point where San Diego Creek enters Upper Newport Bay. Estimations of nutrient loads were calculated using mean water column concentrations of the respective nutrients measured at station 9 on each sampling date. The notation MDL indicates levels of the nutrient in all water samples from that sampling date were below detection limits. Sampling Period
Mean Flow Rate (m3 s⫺1)
NO3⫺ Loading (mol h⫺1)
NH4⫹ Loading (mol h⫺1)
TKN Loading (mol h⫺1)
TP Loading (mol h⫺1)
Winter (December 1996) Spring (March 1997) Summer ( June 1997) Fall (September 1997)
1.51 0.49 0.31 0.34
2,419 1,402 770 434
54.2 14.6 MDL 13.4
374 100 219 87
90.4 12.8 5.8 7.0
Nutrient Dynamics in a Eutrophic Estuary
383
Fig. 4. Spatial and seasonal variation in sediment total Kjeldahl nitrogen (TKN) and total phosphorus in Upper Newport Bay (UBN). Error bars are ⫾1 SE. Note: For winter 1996, data for stations 6, 7, and 8 represent upper strata only. In all other cases, data reflect both upper and lower strata at each station.
Fig. 5. Comparison of seasonal variation of water column NO3⫺, water column NH4⫹, water column total Kjeldahl nitrogen (TKN), and water column total phosphorus in channel and creek habitats in Upper Newport Bay (UNB). Error bars are ⫾1 SE.
tions of NO3⫺ than tidal creeks. For both habitat types, the lowest NO3⫺ concentration occurred in fall (within factor PLSD ⬍ 0.01 for all comparisons). Channel measurements of water column NO3⫺ showed higher variability than creek samples. Water column NH4⫹ concentrations were at least 1.5 times higher in both habitat types during winter than during all other seasons sampled. Significant interaction occurred between season and habitat type on water column NH4⫹. During winter, water column NH4⫹ was higher in creeks than in the main channel, while channel and creek values were either similar or showed the opposite pattern during all other seasons sampled. Water column TKN was significantly affected by season, but not habitat type, with levels during summer elevated 3 times higher than other sampling periods (within factor PSLD; p ⫽ 0.0001 for all comparisons). Water column TP concentrations were significantly effected by season, but not habitat type. In contrast to NO3⫺ and TKN, water column TP was highest in winter (within factor PSLD; p ⫽ 0.0001 for all comparisons) then declined through spring and summer. Sediment levels of both TKN and TP were significantly affected by habitat type, with tidal creek sediments always enriched compared to the main channel (Fig. 6). This is opposite the pattern observed for water column NO3⫺ and TP, which were higher in the main channel than in tidal creeks. There was a significant effect of season on sediment TKN, but not on sediment TP. Sediment TKN was highest in spring 1997, coinciding with maximum water column NO3⫺ concentration, and gradually declined both in channel and creek habitats in the following seasons (within factor PLSD; p ⬍ 0.05 for all comparisons).
384
K. A. Boyle et al.
Fig. 6. Effect of habitat type on sediment nutrients in the main channel and tidal creeks in Upper Newport Bay (UNB): sediment total Kjeldahl nitrogen (TKN) and sediment total phosphorus. Error bars are ⫾1 SE.
E. intestinalis was present in all seasons with maximum cover in summer; cover was always greater in tidal creek compared to channel habitats (Fig. 7). Although Ceramium spp. was only present in 3 seasons, percent cover of this alga was also always higher in tidal creeks. U. expansa was present in only 2 seasons and percent cover was higher in channels than creeks. Interactions occurred between season and habitat type on total percent cover of all three macroalgal species (2-factor ANOVA; p ⫽ 0.0102), as well as for each of the species individually (2-factor ANOVA; p ⫽ 0.0001 for each) because the abundance of macroalgae showed seasonal patterns that varied among habitat types. SUMMARY
CHANNEL VERSUS CREEK COMPARISON: TEMPORAL TRENDS Temporal trends in sediment TKN, water column NO3⫺, and macroalgal percent cover differed between channel and tidal creek habitats (Fig. 8). In tidal creeks, sediments were enriched as water N was depleted. In main channel stations sediment and water nutrient concentrations covaried. In both habitat types water NO3⫺ and sediment TKN declined as algal cover increased through the year. OF
Discussion All measures demonstrated that UNB is a highly enriched estuary with water column nutrient concentrations exceeding levels reported for many es-
Fig. 7. Effect of habitat type on macroalgal percent cover (Data from Kamer et al. 2001) in channels versus creeks in Upper Newport Bay (UNB). Error bars are ⫾1 SE.
tuaries, and comparable to values in other eutrophic systems. Water column NO3⫺ concentrations in UNB exhibited a higher maximum and a wider range than concentrations documented for some eutrophic estuaries in Mediterranean (Svensson et al. 2000) and temperate (Trimmer et al. 2000) regions. Maximum mean water TP concentrations measured in UNB were well above means documented for another enriched Mediterranean system, the Peel-Harvey estuary in western Australia (McComb et al. 1981). Our results suggest that at least a portion of the high NO3⫺ loading to UNB was being processed in the estuary. During spring and summer, water column NO3⫺ was highest near the mouth of SDC and NH4⫹ was highest midestuary. This suggests that N recycling, including remineralization, was occurring within the bay during these seasons. Knox et al. (1981) found broad midestuarine NH4⫹ maxima to be associated with a dominant benthic source. Rendell et al. (1997) reported a similar midestuarine NH4⫹ maximum (up to 37 M) during summer and autumn in the Great Ouse estuary, U.K. Summer elevations in water column TKN
Nutrient Dynamics in a Eutrophic Estuary
Fig. 8. Temporal trends in sediment total Kjeldahl nitrogen (TKN), water column NO3⫺ and macroalgal percent cover (data from Kamer et al. 2001) in tidal creeks (upper panel) and the main channel (lower panel) of Upper Newport Bay (UNB). Data represented are the means ⫾1 SE of four creek sampling stations and four channel sampling stations during each season. Note that y-axis scales for water column NO3⫺ differ between the two panels.
measured throughout UNB provide another indication of nutrient recycling within the bay, possibly reflecting release of dissolved inorganic nitrogen from macroalgae during active growth (Tyler et al. 2001) or decomposition during bloom senescence (Flindt et al. 1999). Nutrient loading to UNB was greatest during the winter wet season for all nutrients. This pattern is typical of estuaries in Mediterranean climates including the Peel-Harvey estuarine system and Venice Lagoon (Marcomini et al. 1995; McComb and Lukatelich 1995). For most of the year, the estuary is a marine embayment, developing a salinity gradient only during the winter rainy season. When adjusted for estuarine area (see Schiff and Kamer 2000), maximum loading rates of NO3⫺ estimated in winter for UNB (7.9 mol ha⫺1 h⫺1) were higher than maximum estimated NO3⫺ loads for Carpinteria Marsh, California (4.3 mol ha⫺1 h⫺1; Page et
385
al. 1995). Our loading rate estimates for UNB represent only one date during each sampling season. More intensive sampling will be necessary to test the significance of the patterns we observed. Sediment N content in UNB was also comparable to other eutrophic systems. Maximum sediment TKN concentrations measured in Newport (0.166 ⫾ 0.01%) were similar to sediment levels of total N recorded for the Great Ouse estuary (max ⫽ 0.14 ⫾ 0.05% dry wt. [Trimmer et al. 1998]) but well below maximum values recorded for Venice Lagoon (total N ⫽ 0.53% [Marcomini et al. 1995]; 0.27%, [Sfriso 1995]) and the Peel-Harvey estuarine system (approximately 0.45% [McComb et al. 1998]). It is unclear if our values of N were truly lower, as NO3⫺ is not included in measures of TKN. Sediment N showed strong seasonal variations in UNB, reaching its highest levels after the winter– spring wet season (1997–1998) and declining through summer and fall. Increased summer season release of sediment nutrients has been attributed to increased salinity (Hopkinson et al. 1999), anaerobic conditions under algal mats (Sfriso et al. 1987; McGlathery et al. 1997), and aerobic diffusive exchange between sediments and the water column (Floderus and Hakanson 1989; Lavery and McComb 1991). One explanation of these strong seasonal patterns is that macroalgae may be depleting the water of N when biomass is high but input from the watershed low, increasing fluxes of N from sediment to water during summer and fall. Sediment N was also low after the ENSO flood of 1997–1998 compared to the previous spring. It is possible that higher flows transported much of the nutrient-rich water out of the estuary before extensive sediment-water exchange could occur. Nutrient-rich surface sediments also may have been scoured and transported to the ocean. Sediment pools of TP in UNB are comparable to other eutrophic systems. Maximum mean values of TP (0.072%) were similar to maximum values of sediment P reported for Venice Lagoon (0.06% [Sfriso 1995]; range ⫽ 0.03–0.07% [Marcomini et al. 1995]) and the Peel-Harvey estuarine system (range at sites with highest sediment P ⫽ 0.06– 0.07% [McComb et al. 1998]). The differences observed in patterns of macroalgal abundance between tidal creeks and the main channel were likely the result of interaction among several factors shown to be important determinants of macroalgal success, including temperature, light (Fong and Zedler 1993; Herna´ndez et al. 1997), and hydrodynamic regime (Runca et al. 1996; Larned 1998; Hurd 2000). Creeks are shallower, warmer habitats with slower water movement; this may result in deposition of floating mats and subsequent rapid growth. The same factors
386
K. A. Boyle et al.
also contribute to phytoplankton blooms, however these are currently uncommon in UNB (chl a ⬍ 2–4 g l⫺1; AHA 1997). Although preliminary, our results suggest that tidal creeks in UNB may function as nutrient uptake and trapping environments while the main channel primarily serves to transport nutrients in the water column. The lag between declines in tidal creek water column NO3⫺ and sediment TKN implies that water column N may be exchanged with and stored in sediments at these stations to a greater degree than at stations in the main channel. This could be due to interactions between many factors including longer water residence times or higher rates of denitrification in tidal creeks, or sandier sediments with low N uptake capacity in the main channel. More research on sediment characteristics and nutrient storage kinetics in UNB is necessary to understand the patterns we observed. Primary producers also act to retain nutrients in tidal creeks. The lower water column nutrient concentrations observed in creeks may reflect higher rates of nutrient uptake by epiphytes and macrophytes in creeks than in channels in UNB. Mineralization of nutrients from the higher cover of macroalgae in tidal creeks may have increased the sediment stores of N in these habitats in UNB. Many studies have suggested that decomposition of algal biomass increases sediment nutrients (Pregnall and Rudy 1985; Sfriso et al. 1987; Pihl et al. 1999). Both sediment TKN and water column NO3⫺ in UNB reached the lowest levels when macroalgae were most abundant. Peckol et al. (1994) found a similar effect on water column N in Waquoit Bay, Maryland, documenting extremely low levels of water column N during summer due to use by macroalgal blooms. Inorganic nutrients in the usually enriched water of Roskilde Fjord were reduced to almost zero during the algal growing season (Flindt et al. 1999). We hypothesize that the decline in sediment TKN that coincided with an increase in macroalgal biomass reflects, in part, macroalgal use of stored sediment N. This is supported by a microcosm experiment modeling UNB during summer bloom conditions (Boyle et al. unpublished data). A study in another southern California estuary, Famosa Slough, suggested that algae were sequestering N from both water and sediment sources (Fong and Zedler 2000). It is possible that macroalgae in UNB may shift between use of sediment and water column N sources as the sizes of these nutrient pools change. Macroalgae have been reported to exploit sediment nutrient pools to maintain growth during periods of low water column nutrients in many estu-
aries, including Kane’ohe Bay (Larned and Atkinson 1997), Venice Lagoon (Sfriso et al. 1987; Marcomini et al. 1995), San Francisco Bay ( Josselyn and West 1985), and the Peel-Harvey estuarine system (Lavery and McComb 1991). In Tijuana Estuary, southern California, Winfield (1980) estimated that approximately 6% of the N demands of algae and vascular plants were met by imported N, and concluded that nutrient recycling within the estuary supplied the unmet demand. Trimmer et al. (2000) showed that external nutrient inputs were likely insufficient to support peak summer macroalgal biomass in two marine embayments in England and suggested that internal recycling of sediment N sustained summer macroalgal blooms. Phytoplankton in Chesapeake Bay (Cowan and Boynton 1996) and Mobile Bay (Cowan et al. 1996) have been found to obtain a large percentage of their nutrient requirements from seasonal sediment nutrient flux. Our results demonstrate that sediment nutrient pools in UNB are high. If available to macroalgae, they may play an important role in sustaining blooms during summer and fall when water column N levels and external nutrient inputs are low. ACKNOWLEDGMENTS This work was funded by the California Water Resources Center, the Environmental Protection Agency water and watersheds Program #R825381, and a University of California Academic Senate grant. We thank the California Department of Fish and Game for site access and the use of their canoes. Special thanks to Damion Gastellum and Steve Kim for help in the field and to Dario Diehl for invaluable assistance with Fig. 1. We also thank two anonymous reviewers whose input greatly improved this manuscript.
LITERATURE CITED ALEX HORNE AND ASSOCIATES (AHA). 1998. Macroalgae (seaweeds) and phytoplankton in Newport Bay-estuary, Summer– Fall 1996. Alex Horne Associates, Berkeley, California. BIRCH, P. B., D. M. GORDON, AND A. J. MCCOMB. 1981. Nitrogen and phosphorous nutrition of Cladophora in the Peel-Harvey estuarine system, Western Australia. Botanica Marina 24:381– 387. BLODGETT, P. L. 1989. Newport Clean Water Strategy—A report and recommendations for future action. California Regional Water Quality Control Board, Santa Ana Region, Riverside, California. BOYNTON, W. R., L. MURRAY, J. D. HAGY, C. STOKES, AND W. M. KEMP. 1996. A comparative analysis of eutrophication patterns in a temperate coastal lagoon. Estuaries 19:408–421. BREMNER, J. M. AND C. S. MULVANEY. 1982. Nitrogen-total, p. 595–624. In A. L. Page (ed.), Methods of Soil Analysis: Part 2. Chemical and Microbiological Properties. American Society of Agronomy (ASA) Monograph Number 9. ASA: Soil Science Society of America, Madison, Wisconsin. BRICKER, S. B., C. G. CLEMENT, D. E. PIRHALLA, S. P. ORLANDO, AND D. R. G. FARROW. 1999. National estuarine eutrophication assessment: Effects of nutrient enrichment in the nation’s estuaries. NOAA, National Ocean Service, Silver Spring, Maryland. CALIFORNIA REGIONAL WATER QUALITY CONTROL BOARD. 1997.
Nutrient Dynamics in a Eutrophic Estuary
Staff report on the nutrient total maximum daily load for Newport Bay/San Diego Creek, August 29, 1997. California Regional Water Quality Control Board, Santa Ana, California. CAMBRIDGE, M. L. AND A. J. MCCOMB. 1984. The loss of seagrass in Cockburn Sound, Western Australia. I. The time course and magnitude of seagrass decline in relation to industrial development. Aquatic Botany 20:229–243. CARLSON, R. M. 1978. Automated separation and conductimetric determination of ammonia and dissolved carbon dioxide. Analytical Chemistry 50:1528–1531. CASTEL, J., P. CAUMETTE, AND R. HERBERT. 1996. Eutrophication gradients in coastal lagoons as exemplified by the Bassin ` vost. Hydrobiologia 329:9–28. dı´Arcachon and the Etang du PrE COWAN, J. L. AND W. R. BOYNTON. 1996. Sediment-water oxygen and nutrient exchanges along the longitudinal axis of Chesapeake Bay: Seasonal patterns, controlling factors and ecological significance. Estuaries 19:562–580. COWAN, J. L., W. PENNOCK, R. JONATHAN, AND W. R. BOYNTON. 1996. Seasonal and interannual patterns of sediment-water nutrient and oxygen fluxes in Mobile Bay, Alabama (USA): Regulating factors and ecological significance. Marine Ecology Progress Series 141:229–245. DOLLAR, S. J., S. V. SMITH, S. M. VINK, S. OBREBSKI, AND J. T. HOLLIBAUGH. 1991. Annual cycle of benthic nutrient fluxes in Tomales Bay, California, and contribution of the benthos to total ecosystem metabolism. Marine Ecology Progress Series 79: 115–125. FLINDT, M. R., M. A. PARDAL, A. I. LILLEBO, I. MARTINS, AND J. C. MARGUES. 1999. Nutrient cycling and plant dynamics in estuaries: A brief review. Acta Oeolojia 20:237–248. FLODERUS, S. AND L. HAKANSON. 1989. Resuspension, ephemeral mud blankets and nitrogen cycling in Laholmsbukten, south east Kattegat. Hydrobiologia 176/177:61. FONG, P. 1986. Monitoring and manipulation of phytoplankton dynamics in a southern California estuary. Master’s Thesis, San Diego State University, San Diego, California. FONG, P., K. E. BOYER, J. S. DESMOND, AND J. B. ZEDLER. 1996. Salinity stress, nitrogen competition, and facilitation: What controls seasonal succession of two opportunistic green macroalgae? Journal of Experimental Marine Biology and Ecology 206: 203–221. FONG, P. AND J. B. ZEDLER. 1993. Temperature and light effects on the seasonal succession of algal communities in shallow coastal lagoons. Journal of Experimental Marine Biology and Ecology 171:259–272. FONG, P. AND J. B. ZEDLER. 2000. Sources, sinks, and fluxes of nutrients (N ⫹ P) in a small highly-modified estuary in southern California. Urban Ecosystems 4:125–144. FRANSON M. A. H. 1985. Method 424-F, p. 448–450. In A. D. Eaton, L. S. Clesceri, A. E. Greenberg, and M. H. Franson (eds.), Standard Methods for the Examination of Water and Wastewater, 16th edition. APHA, AAWA, and WPCF, Washington, D.C. GABRIELSON, J. O. 1981. The Peel-Harvey estuarine system study (1976–1980): Sediment contribution to nutrient cycling— Technical report. Department of Conservation and Environment of Western Australia, Bulletin 96. HERNA´NDEZ, I., G. PERALTA, J. L. PC¸REZ-LLORC¸NS, J. J. VERGARA, AND F. X. NIELL. 1997. Biomass and growth dynamics of Ulva species in Palmones River estuary. Journal of Phycology 33:764– 772. HOPKINSON, C. S., A. E. GIBLIN, J. TUCKER, AND R. H. GARRITT. 1999. Benthic metabolism and nutrient cycling along an estuarine salinity gradient. Estuaries 22:863–881. HOPKINSON, C. S. AND J. J. VALLINO. 1995. The relationships among man’s activites in watersheds and estuaries: A model of runoff effects on patterns of estuarine community metabolism. Estuaries 18:598–621.
387
HURD, C. L. 2000. Water motion, marine macroalgal physiology, and production. Journal of Phycology 36:453–472. ISSAC, R. A. AND W. C. JOHNSON. 1976. Determination of total nitrogen in plant tissue, using a block digestor. Journal of the Association of Analytical Chemistry 59:98–100. JOHNSON, C. M. AND A. ULRICH. 1959. Analytical methods for use in plant analysis, p. 26–78. In Bulletin 766. University of California Press, Agricultural Experimental Station, Berkeley, California. JOSSELYN, M. N. AND J. A. WEST. 1985. The distribution and temporal dynamics of the estuarine macroalgal community of San Francisco Bay. Hydrobiologia 129:139–152. KAMER, K., K. A. BOYLE, AND P. FONG. 2001. Macroalgal bloom dynamics in a highly eutrophic southern California estuary. Estuaries 24:623–635. KNOX, S., D. R. TURNER, A. G. DICKSON, M. I. LIDDICOAT, M. WHITFIELD, AND E. I. BUTLER. 1981. A statistical analysis of estuarine profiles: Application to manganese and ammonium in the Tamar estuary. Estuarine, Coastal and Shelf Science 13: 357–371. LARNED, S. T. 1998. Nitrogen- versus phosphorus-limited growth and sources of nutrients for coral reef macroalgae. Marine Biology 132:409–421. LARNED, S. T. AND M. J. ATKINSON. 1997. Effects of water velocity on NH4 and PO4 uptake and nutrient-limited growth in the macroalga Dictyosphaeria cavernosa. Marine Ecology Progress Series 157:295–302. LAVERY, P. S. AND A. J. MCCOMB. 1991. Macroalgal-sediment nutrient interactions and their importance to the nutrition of macroalgae in a eutrophic estuary. Estuarine, Coastal and Shelf Science 32:281–296. LUKATELICH, R. J. AND A. J. MCCOMB. 1986. Distribution and abundance of benthic microalgae in a shallow southwestern Australian estuarine system. Marine Ecology Progress Series 27: 287–297. MACKAS, D. L. AND P. J. HARRISON. 1997. Nitrogenous nutrient sources and sinks in the Juan de Fuca Strait/Strait of Georgia/Puget Sound estuarine system: Assessing the potential for eutrophication. Estuarine, Coastal and Shelf Science 44:1–21. MARCOMINI, A., A. SFRISO, B. PAVONI, AND A. A. ORIO. 1995. Eutrophication of the lagoon of Venice: Nutrient loads and exchanges, p. 59–80. In A. J. McComb (ed.), Eutrophic Shallow Estuaries and Lagoons. CRC Press, Inc., Boca Raton, Florida. MCCLELLAND, J. AND I. VALIELA. 1998. Linking nitrogen in estuarine producers to land-derived sources. Limnology and Oceanography 43:577–585. MCCOMB, A. J., R. P. ATKINS, P. B. BIRCH, D. M.GORDON, AND R. J. LUKATELICH. 1981. Eutrophication in the Peel-Harvey estuarine system, Western Australia, p. 323–342. In B. Nielson and E. Cronin (eds.), Estuaries and Nutrients. Humana Press, Clifton, New Jersey. MCCOMB, A. J. AND R. J. LUKATELICH. 1995. The Peel-Harvey estuarine system, western Australia, p. 5–18. In A. J. McComb (ed.), Eutrophic Shallow Estuaries and Lagoons. CRC Press, Inc., Boca Raton, Florida. MCCOMB, A. J., S. QIU, R. J. LUKATELICH, AND T. F. MCAULIFFE. 1998. Spatial and temporal heterogeneity of sediment phosphorus in the Peel-Harvey estuarine system. Estuarine, Coastal and Shelf Science 47:561–577. MCGLATHERY, K. J., D. KRAUSE-JENSEN, S. RYSGAARD, AND P. B. CHRISTENSEN. 1997. Patterns of ammonium uptake within dense mats of the filamentous macroalga Chaetomorpha linum. Aquatic Botany 59:99–115. MICHEL, P., B. BOUTIER, AND J. F. CHIFFOLEAU. 2000. Net fluxes of dissolved arsenic, cadmium, copper, zinc, nitrogen and phosphorus from the Gironde Estuary (France): Seasonal variations and trends. Estuarine, Coastal and Shelf Science 51:451– 462.
388
K. A. Boyle et al.
NIXON, S. W., S. L. GRANGER, AND B. L. NOWICKI. 1995. An assessment of the annual mass balance of carbon, nitrogen, and phosphorous in Narragansett Bay. Biogeochemistry 31:15–61. NIXON, S. W. AND M. E. Q. PILSON. 1983. Nitrogen in estuarine and coastal marine ecosystems, p. 565–648. In E. J. Carpenter and D. G. Capone (eds.), Nitrogen in the Marine Environment. Academic Press, New York. ONUF, C. P. 1987. The ecology of Mugu Lagoon, California: An estuarine profile. U.S. Fish and Wildlife Service, Biology Report 85:1–122. OWENS, N. J. P. AND W. D. P. STEWART. 1983. Enteromorpha and the cycling of nitrogen in a small estuary. Estuarine, Coastal and Shelf Science 17:287–296. PAGE, H. M., R. L PETTY, AND D. E. MEADE. 1995. Influence of watershed runoff on nutrient dynamics in a southern California salt marsh. Estuarine, Coastal and Shelf Science 41:163–180. PECKOL, P., B. DEMEO-ANDERSON, J. RIVERS, I. VALIELA, M. MALDONADO, AND J. YATES. 1994. Growth, nutrient uptake capacities, and tissue constituents of the macroalgae Cladophora vagabunda and Gracilaria tikvahiae related to site-specific nitrogen loading rates. Marine Biology 121:175–185. PECKOL, P. AND J. S. RIVERS. 1996. Contribution by macroalgal mats to primary production of a shallow embayment under high and low nitrogen-loading rates. Estuarine, Coastal and Shelf Science 43:311–325. PIHL, L., A. SVENSON, P.-O. MOKSNES, AND H. WENNHAGE. 1999. Distribution of green algal mats throughout shallow soft bottoms of the Swedish Skagerrak archipelago in relation to nutrient sources and wave exposure. Journal of Sea Research 41: 281–294. PREGNALL, A. M. AND P. P. RUDY. 1985. Contribution of green macroalgal mats (Enteromorpha sp.) to seasonal production in an estuary. Marine Ecology Progress Series 24:167–176. RENDELL, A. R., T. M. HORROBIN, T. D. JICKELLS, H. M. EDMUNDS, J. BROWN, AND S. J. MALCOLM. 1997. Nutrient cycling in the Great Ouse estuary and its impact on nutrient fluxes to The Wash, England. Estuarine, Coastal and Shelf Science 45:653–668. RISGAARD-PETERSEN, N., T. DALSGAARD, S. RYSGAARD, P. B. CHRISTENSEN, J. BORUM, K. MCGLATHERY, AND L. P. NIELSEN. 1998. Nitrogen balance of a temperate eelgrass Zostera marina bed. Marine Ecology Progress Series 174:281–291. RUNCA, E., A. BERNSTEIN, L. POSTMA, AND G. DI SILVIO. 1996. Control of macroalgae blooms in the Lagoon of Venice. Ocean and Coastal Management 30:235–257. SAH, R. N. AND R. O MILLER. 1992. Spontaneous reaction for acid dissolution of biological tissues in closed vessels. Analytical Chemistry 64:230–233. SCHIFF, K. AND K. KAMER. 2000. Comparison of nutrient inputs, water column concentrations, and macroalgal biomass in upper Newport Bay, California. Southern California Coastal Water Research Project, Westminster, California. SFRISO, A. 1995. Temporal and spatial responses of growth of Ulva rigida C. Ag. to environmental and tissue concentrations of nutrients in the Lagoon of Venice. Botanica Marina 38:557– 573. SFRISO, A., A. MARCOMINI, AND B. PAVONI. 1987. Relationships between macroalgal biomass and nutrient concentrations in a hypertrophic area of the Venice lagoon. Marine Environmental Research 22:297. SFRISO, A., B. PAVONI, AND A. MARCOMINI. 1989. Macroalgae and phytoplankton standing crops in the central Venice lagoon. Primary production and nutrient balance. Science of the Total Environment 80:139. SMITH, S. V., R. M. CHAMBERS, AND J. T. HOLLIBAUGH. 1996. Dissolved and particulate nutrient transport through a coastal watershed-estuary system. Journal of Hydrology 176:181–203. SMITH, S. V. AND J. T. HOLLIBAUGH. 1997. Annual cycle and in-
terannual variability of ecosystem metabolism in a temperate climate embayment. Ecological Monographs 67:509–533. SMITH, S. V., J. T. HOLLIBAUGH, S. J. DOLLAR, AND S. VINK. 1991. Tomales Bay metabolism: C-N-P stoichiometry and ecosystem heterotrophy at the land-sea interface. Estuarine, Coastal and Shelf Science 33:223–257. SMITH, S. V., W. J. WIEBE, J. T. HOLLIBAUGH, S. J. DOLLAR, S. W. HAGER, B. E. COLE, G. W. TRIBBLE, AND P. A. WHEELER. 1987. Stoichiometry of C, N, P and Si fluxes in a temperate-climate embayment. Journal of Marine Research 45:427–460. STAVER, L. W., K. W. STAVER, AND J. C. STEVENSON. 1996. Nutrient inputs to the Choptank River estuary: Implications for watershed management. Estuaries 19:342–358. SVENSSON, J. M., G. M. CARER, AND M. BOCCI. 2000. Nitrogen cycling in sediments of the Lagoon of Venice, Italy. Marine Ecology Progress Series 199:1–11. TAYLOR, D., S. W. NIXON, S. L. GRANGER, AND B. A. BUCKLEY. 1995. Nutrient limitation and the eutrophication of coastal lagoons. Marine Ecology Progress Series 127:235–244. TRIMMER, M., D. B. NEDWELL, D. B. SIVYER, AND S. J. MALCOLM. 1998. Nitrogen fluxes through the lower estuary of the river Great Ouse, England: The role of the bottom sediments. Marine Ecology Progress Series 163:109–124. TRIMMER, M., D. B. NEDWELL, D. B. SIVYER, AND S. J. MALCOLM. 2000. Seasonal organic mineralisation and denitrification in intertidal sediments and their relationship to the abundance of Enteromorpha sp. and Ulva sp. Marine Ecology Progress Series 203:67–80. TYLER, A. C., K. J. MCGLATHERY, AND I. C. ANDERSON. 2001. Macroalgae mediation of dissolved organic nitrogen fluxes in a temperate coastal lagoon. Estuarine, Coastal and Shelf Science 53:155–168. UNCLES, R. J., R. J. M. HOWLAND, A. E. EASTON, M. L. GRIFFITHS, C. HARRIS, R. S. KING, A. W. MORRIS, D. H. PLUMMER, AND E. M. S. WOODWARD. 1998. Concentations of dissolved nutrients in the tidal Yorkshire Ouse River and Humber estuary. Science of the Total Environment 210–211:377–388. UNCLES, R. J., R. J. M. HOWLAND, A. E. EASTON, M. L. GRIFFITHS, C. HARRIS, R. S. KING, A. W. MORRIS, D. H. PLUMMER, AND E. M. S. WOODWARD. 1999. Seasonal variability of dissolved nutrients in the Humber-Ouse estuary, United Kingdom. Marine Pollution Bulletin 37:234–246. U.S. ARMY CORPS OF ENGINEERS. 1993. Reconnaissance Report Upper Newport Bay Orange County, California. Numerical modeling of hydrodynamics and transport, February 1993. Los Angeles District, California. U.S. ENVIRONMENTAL PROTECTION AGENCY (U.S. EPA). 1998. Total maximum daily loads for nutrients San Diego Creek and Newport Bay, California, Draft Proposal, February 27, 1998. Region 9. U.S. EPA, San Francisco, California. VALIELA, I., C. D’AVANZO, K. FOREMAN, M. BABIONE, M. LAMONTAGNE, D. HERSH, J. COSTA, C.-H. SHAM, AND J. BRAWLEY. 1992. Couplings of watersheds and coastal waters: Sources and consequences of nutrient enrichment in Waquoit Bay, Massachusetts. Estuaries 15:443–457. WILLIAMS, S. L. AND J. B. ZEDLER. 1992. Restoring sustainable coastal ecosystems on the Pacific coast: Establishing a research agenda. California Sea Grant College, University of California, La Jolla, California. WINFIELD, P. 1980. Dynamics of carbon and nitrogen in a southern California salt marsh. Ph.D. Dissertation, University of California Riverside, San Diego State University, San Diego, California. Received, December 12, 2002 Revised, July 17, 2003 Accepted, September 5, 2003