MARINE ECOLOGY PROGRESS SERIES Mar Ecol Prog Ser
Vol. 233: 55–71, 2002
Published May 21
Temporal and spatial patterns of intertidal sediment-water nutrient and oxygen fluxes in the Douro River estuary, Portugal Catarina M. Magalhães 1,*, Adriano A. Bordalo 1, William J. Wiebe 2 1
Laboratory of Hydrobiology, Institute of Biomedical Sciences, University of Porto, 4099-003 Porto, Portugal 2 Department of Marine Sciences, University of Georgia, Athens, Georgia 30602, USA
ABSTRACT: The Douro River watershed drains 17% of the Iberian Peninsula; the present average freshwater discharge into the estuary is 488 m3 s –1. The Douro River estuary receives largely untreated sewage from about 1 million inhabitants of Greater Porto. A major portion of the intertidal sediments is currently scheduled for removal by dredging. In order to assess their role in nutrient dynamics and productivity, sediment-water fluxes of ammonium, inorganic phosphorus, nitrate, nitrite, silicate and oxygen were determined quarterly in muddy and sandy intertidal sediments of the lower estuary. Fluxes were estimated with both light and dark incubations. The range of net nutrient uptake rates from all sites was as follows: ammonium 28 to 978 µmol m –2 h–1; nitrate 40 to 810 µmol m –2 h –1; nitrite 1 to 128 µmol m –2 h–1; dissolved orthophosphate 1 to 152 µmol m –2 h–1 and silicate 69 to 369 µmol m –2 h–1. Stepwise multiple regression analysis revealed strong coupling between the concentrations of most nutrients in the water column and the corresponding flux into the sediment. Mean net nutrient effluxes to the overlying water were observed in only 6 cases out of a total of 120, and only at the muddy sediment site. Net oxygen production (light incubation) ranged from 58 to 618 mg O2 m –2 h–1, while oxygen consumption (dark incubation) ranged from 11 to 64 mg O2 m –2 h–1. Primary production correlated significantly with chlorophyll a concentrations in the top (0.5 cm) sediment layer at the sandy sites, but showed no correlation at the muddy site. All sampling sites were net daily sources of oxygen to the water. The net productivity of the intertidal flats and their capacity for water-column inorganic nutrient removal assumes particular importance in the Douro River estuary, a eutrophic system with a permanently heterotrophic water column. KEY WORDS: Douro River estuary · Intertidal flat · Sediment-water interface · Nutrient uptake · Oxygen fluxes Resale or republication not permitted without written consent of the publisher
INTRODUCTION Estuaries constitute a boundary between the land and the sea; freshwater from rivers mixes with ocean water to form biologically rich, highly productive systems. Materials brought from the ocean and, via rivers, from the land, are processed in the different estuarine compartments (water column and shallow and lightlimited subtidal and intertidal sediments); these trans*Present address: Largo Abel Salazar 2, 4099-003 Porto, Portugal. E-mail:
[email protected] © Inter-Research 2002 · www.int-res.com
formations depend on the rates of external inputs, the recycling and removal efficiency by biological, chemical and/or physical processes (Seitzinger 1990), as well as the hydrodynamics of each estuary (Balls 1994). Progressive anthropogenic modification of estuarine systems, in particular the increase in inorganic nutrients and organic matter, has resulted in severe eutrophication of estuarine and coastal waters in many parts of the world (see e.g. Jickells 1998). Inorganic nutrient exchanges between the watersediment interface of intertidal and subtidal sediments can play 2 important, but opposite, roles in coastal sys-
56
Mar Ecol Prog Ser 233: 55–71, 2002
tems. In some cases release of regenerated nutrients into the water column can supply most of the nitrogen and phosphorus required for phytoplankton primary production (Rizzo 1990, Gómez-Parra & Forja 1993, Cowan et al. 1996). In contrast, microbial mats can remove significant amounts of inorganic nutrients from the overlying water column (Teague et al. 1988, Ogilvie et al. 1997). Removal of nutrients from the water column attenuates the nutrient discharge into coastal waters and consequently facilitates control of coastal water eutrophication. Since removal and production processes act simultaneously, the direction of net nutrient flux depends on which process dominates. Because sediments can modify nutrient exchange into and between the systems, understanding what factors regulate subtidal and intertidal sediment-water fluxes has become an important concern. The nature of the substrate (e.g. sand or clay), quantity and quality of organic matter reaching the sediment surface (Rizzo 1990, van Luijn et al. 1999), infauna community characteristics (Davey & Watson 1995), chemical status of the surface sediments and overlying waters (Ogilvie et al. 1997, Asmus et al. 1998), effect of tidal action (Asmus et al. 1998, Rocha & Cabral 1998, Usui et al. 1998) and wind regimes (de Jonge & van Beusekom 1995) all affect sediment-water nutrient exchange. The nature of the oxygenated zone in the sediment surface can also control sediment and water column nutrient exchanges (Baillie 1986). The rates of sediment photosynthesis and respiration often determine which biogeochemical processes will dominate. The Douro River estuary is located in one of the most populated zones of Portugal. It receives high freshwater nutrient-loading and largely untreated sewage from approximately 1 million inhabitants (Bordalo 1991). The Douro River estuary is also subject to progressive human intervention; currently, intertidal sediments of the lower estuary are planned for removal by dredging, jetties are to be constructed and marine facilities built, and the depth of the channel is to be increased. In order to assess the role of the present intertidal sediments in nutrient dynamics and primary productivity, sediment-water inorganic nutrient and oxygen fluxes were measured quarterly for 1 yr. In addition, physical and chemical (water-column salinity and nutrient concentrations, pH of interstitial water, sediment particle size and water content, temperature, irradiance during incubation period) and biological (chlorophyll a, pheopigments, total organic matter) environmental variables were measured.
These variables have been identified as potential regulating factors of the oxygen and/or nutrients fluxes at the sediment-water interface. The absence of consistent results in the literature with respect to the net nutrient flux direction across the sediment-water interface, the severely eutrophic condition of the Douro River estuarine system, and the planned removal of virtually the entire intertidal flat of the lower estuary emphasize the timeliness of conducting this study in order to answer the following questions: (1) What is the role of intertidal sediments in modifying water-column inorganic nutrients concentrations? (2) What is the magnitude of benthic community metabolism? (3) Which factors regulate sedimentwater exchange of oxygen and inorganic nutrients?
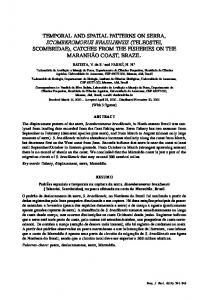
MATERIALS AND METHODS Study area. The Douro River drains approximately 17% of the Iberian Peninsula (Fig. 1). The Douro River estuary is presently a small, drowned, granitic valley, 21 km long with a total surface area of 7 km2, ending at the Crestuma-Lever dam which was built in 1985. It is a mesotidal, semi-diurnal estuary, with an average depth of 8.2 m and a mean tidal amplitude of 2.8 m; freshwater discharge ranges from virtually 0 to 13 000 m3 s–1 (average 488 m3 s–1), with a residence time between 0.3 and 16.5 d (Vieira & Bordalo 2000). The estuary is salinity-stratified under low riverflow conditions (Vieira & Bordalo 2000). Water-column tem-
Fig. 1. Douro River estuary and location of sampling stations sites (I, II, III) in intertidal flat
Margalhães et al.: Nutrient and oxygen fluxes in the Douro River estuary
peratures range from 7°C in winter to 22°C in summer, and salinity in the lower estuary ranges from 0 to nearly 35 ‰. The width of the upper 18.5 km of the estuary is narrow (375 m); it expands up to 1.3 km about 2.5 km from the mouth. The most extensive intertidal flat (0.65 km2) is in this lower portion of the estuary, and is composed of sand (0.60 km2) and a small muddy marsh (0.05 km2). At high tide this zone has a mean depth of 2 m. This flat represents 37 % of the area of the lower estuary and 9% of the total estuary. Sampling and experimental procedures. The intertidal flat of the lower Douro River estuary is shown in Fig. 1. Fluxes of inorganic nutrients (ammonium, nitrate, nitrite, orthophosphate and dissolved silicate) and oxygen between the sediment and water column were measured at 1 muddy (Site I) and 2 sandy (Sites II and III) sites (Fig. 1). Site III is a nutrient-enriched zone adjacent to a small eutrophic tributary creek. The 3 sites are characterized by a low Shannon and Wiener diversity index for the macrozoobenthic community (i.e. between 0.08 and 0.90). Macrofauna abundance varied between 6 to 42 thousand animals per square meter in both sandy and muddy sediments. Representative macrobenthic populations included polychaetes (Hediste diversicolor), oligochaetes, isopods (Cyathura carinata and Sphaeroma serratum) and amphipods (Corophium volutator) (Magalhães et al. 2000). At all 3 sampling sites, the microphythobenthos was composed mainly of benthic diatoms; from a total of 60 taxa identified, 50 were diatoms of the order Pennales. The quantitative importance of cyanobacteria was low (Magalhães et al. 2000). Sampling was performed quarterly in 1998 and 1999 (see Table 1 for dates), always at low tide. Sediment was collected by hand with transparent Plexiglas tubes (11 cm diameter and 12 cm depth) by inserting them 6 to 8 cm into the sediment. Cores were gently removed, sealed, kept cool, and transported in the dark to the laboratory for processing no later than 1 h after collection. Estuarine water was collected from near each sampling site, assuming that this water would cover the area at high tide. In the laboratory, triplicate light and dark cores (wrapped with several layers of aluminum foil) were prepared for incubation; these were kept submerged overnight at the environmental temperature (Conley et al. 1997). On the following day (09:00 to 10:00 h), incubation chambers with sediment were filled carefully with filtered estuarine water (0.2 µm), and all air bubbles were removed. Controls consisted of filtered estuarine water in the same Plexiglas tubes. Light and dark chambers were incubated under natural light and at in situ temperature. Ten minutes after filling the tubes, a T0 sample (6% of the total volume) was taken from each chamber, and the volume of water removed was
57
replaced. Five 50 ml subsamples of overlying water were taken from each chamber during the 6 to 8 h incubation period. Water was gently stirred before removing samples. Control chambers were sampled only at the beginning and the end of the incubation period. All subsamples were immediately syringe-filtered through 0.45 µm acid-washed membrane filters, and stored at –21°C in acid-cleaned, polyethylene flasks until analysis. For each incubation period, inorganic nutrient concentrations (µM) were corrected for the corresponding volume of chamber water (µmol). Fluxes of inorganic nutrients were calculated using the slope of the linear relationship between the change in the nutrient concentration in the water chamber versus the time of incubation (e.g. Barbanti et al. 1992), following the equation: α F = × 104 A where F is the flux of each inorganic nutrient in µmol m–2 h–1, α is the slope of the linear regression, A is the sediment surface area in cm2, and 104 is the conversion factor from cm2 to m2. Primary production and respiration were estimated from the difference between initial and final dissolved oxygen concentrations in triplicate light and dark incubation chambers (e.g. Hargrave et al. 1983). Incubation times were between 1 to 2 h, depending on the season; natural light conditions were always > 800 µE m–2 s–1. The oxygen concentrations of the experimental chamber were corrected for the oxygen variations in the filtered overlying water (control chambers). Hourly respiration and primary production rates were calculated on a square meter basis as: (1) hourly net primary production rate (NPP) = mean net oxygen production (mg m–2) in transparent chambers/incubation time (h); (2) hourly respiration rate (R) = mean oxygen consumption (mg m–2) in dark chambers/incubation time (h). Daily gross (GPP) and net (NPP) primary production were calculated using a sigmoidal irradiation curve in the daytime by dividing the photoperiod by 2. It was assumed that during immersion, primary production rates would not be affected, since at 2 m depth watercolumn irradiance profiles showed that 25 ± 6% of the surface water irradiance reached the sediment surface (268 ± 138 µE m–2 s–1). These irradiance values correspond to measured light-saturation values for primary production in other intertidal flats (Lamontagne et al. 1986, Pinckney & Zingmark 1993, Brotas & Catarino 1995). The photoperiod was 10 h in winter, 12 h in spring and fall, and 14 h in summer: (1) daily NPP = (hourly net primary production rate × 0.5 × photoperiod) – (hourly respiration rate × night period); (2) daily GPP/R = ([hourly net primary production rate × 0.5 × photoperiod] + [hourly respiration rate × photoperiod])/(hourly respiration rate × 24 h).
12.7 ± 0.6 13.1±1.1 65.6 ± 7.4 18.0 ± 0.1 41.14 ± 0.46 87.25 ± 0.19 1.28 ± 0.16 28.70 ± 0.32 0.50 ± 0.02 5.89 ± 0.84 72.69 ± 5.21 149.31± 2.73 9.02 ± 2.51 350.49 ± 6.88 11.0 6.5 I, II III Winter 02/02/99 27/01/99
7.36 ± 0.13 8.02 ± 0.10
15.8 ±1.2 22.1± 0.8 33.5 ±1.8 43.3 ± 3.4 20.46 ±1.59 46.09 ± 2.90 1.27 ± 0.09 1.93 ± 0.23 0.61± 0.08 2.05 ± 0.12 20.84 ± 2.39 62.74 ±1.65 25.10 ± 0 17.93 ± 3.73 18.8 12.0 I, II III Fall 19/10/98 12/10/98
6.51± 0.25 6.89 ± 0.10
24.0 ±1.2 23.9 ±1.0 67.1± 6.3 9.7 ± 0.5 17.14 ± 0.35 58.90 ± 2.87 0.91± 0.01 30.14 ± 0.88 1.11± 0.01 23.57 ± 3.64 42.98 ± 0.38 11.90 ± 2.01 16.90 ± 5.19 225.30 ± 0.38 9.8 14.0 I, II III Summer 23/07/98 06/08/98
6.11± 0.43 2.18 ± 0.28
22.3 ±1.4 5.5 ±1.1 73.3 ±12.5 84.0 ± 7.82 28.82 ± 0.24 51.37 ± 2.61 1.05 ± 0.02 1.68 ± 0.15 0.76 ± 0.05 1.74 ± 0.29 66.28 ±12.78 122.03 ± 23.87 10.11±1.29 18.36 ±1.51 8.8 4.8 I, II III Spring 14/05/98 25/05/98
7.56 ± 0.30 7.17 ± 0.15
N/P DSi (µM) PO43 – (µM) NO2– (µM) NO3– (µM) NH4+ (µM) Salinity (‰) O2 (µg l–1) Site Sampling dates
Annual production and respiration were estimated by the summation of all daily values; Colijn & De Jonge (1984) found almost no differences between annual production values based on accurately determined photoperiods and those based on approximation. Analytical determinations. Dissolved oxygen was determined using a modification of the Winkler method (Carpenter 1965). Nutrient analyses were performed in triplicate. Orthophosphate, nitrite, ammonium and dissolved silicate (DSi) were quantified using methods described in Grasshoff et al. (1983). Samples for dissolved silicate analysis did not have contact with glass, and after thawing were kept for 1 wk at 5°C; this procedure completely depolymerizes the silicate (Grasshoff et al. 1983). Nitrate was assayed using an adaptation of the spongy cadmium reduction technique (Jones 1984), with the nitrite value subtracted from the total. The precision of all determinations was in the range 0.1 to 8%, depending on the particular nutrient concentration. Sediment characteristics. Surface triplicate sediment subcores (1 cm diameter and 0.5 cm depth) were collected from each incubation chamber at the end of an experiment and placed into scintillation vials for chlorophyll a (chl a) and organic matter (OM) analyses. Samples for chl a measurements were kept frozen (–21°C) until analysis. Extraction was performed in a mixed solution of acetone, methanol and water (45:45:10, respectively), according to Joye et al. (1996). Chl a and pheopigment concentrations were determined spectrophotometrically, using standard equations (Parsons et al. 1984), and expressed as µg chl a per g dry sediment weight. Samples for sediment organic matter content were processed immediately by drying to constant weight at 60°C, followed by ignition at 500°C for 4h and reweighting. Particle size distribution was performed by wet (< 0.063 mm) and dry (> 0.063, > 0.125, > 0.25, > 0.5, >1 and > 2 mm) sieving of samples previously treated with hydrogen peroxide. Data analysis. Data analysis was performed at the 95% confidence level (p < 0.05). Data were tested for normality using the Kolmogorov-Smirnov test, and for homoscedasticity using Leven’s test (Zar 1996). In order to compare the means of each variable between the different stations and seasons, a 1-way ANOVA was performed (Zar 1996). Stepwise multiple regression analysis (Draper & Smith 1981) was carried out using all physical and chemical (water-column salinity and nutrient concentrations, pH of interstitial water, sediment particle size and water content, temperature and irradiance during the incubation period) and biological (chl a, pheopigments and total organic matter in surface sediment) environmental variables in order to investigate which factors correlated with inorganic nutrient exchanges and metabolic processes (primary
Incubation temperature (°C)
Mar Ecol Prog Ser 233: 55–71, 2002
Table 1. Characteristics of Time Zero filtered estuarine water used for experiments (means ± SD; dates given as dd/mm/yy)
58
59
Margalhães et al.: Nutrient and oxygen fluxes in the Douro River estuary
production and respiration). Student’s t-test (Zar 1996) was used to examine differences in mean hourly flux rates (triplicate chambers) between light and dark incubations.
beginning of experiments, with the exception of summer at Site III, where the Time zero oxygen concentration of the incubation water was low (Table 1). The N:P ratios of incubation water were generally high; the low values at Site III in summer and winter resulted from disproportionate phosphate-loading (Table 1).
RESULTS Sediment and water-column characteristics
Oxygen fluxes
The general characteristics of the 3 sediments are reported in Table 2. Site I surface sediments were characterized by a much higher percent of total organic matter, water content and fine sediment than sandy sites (II and III). In muddy sediments (Site I), the interstitial water pH was higher than at the sandy sites (II and III), probably reflecting higher rates of sulfate reduction (Berner 1971). Mean chl a concentrations for all seasons were 50.30 ± 27.1, 77.4 ± 28.7 and 21.2 ± 11.4 µg chl a g dry wt–1 for Sites I, II and III, respectively. A 1-way ANOVA analysis showed that statistical differences existed between the 3 sampling sites in fall and winter (p < 0.05); in spring and summer, only Site II had significantly different values (ANOVA, p < 0.01). Concentrations of pheopigments were always lower than for chl a, but followed the same seasonal patterns (Table 2). Variations in oxygen, salinity, inorganic nutrients and N:P molar ratios in the water used for incubation experiments, as well as incubation temperature, are given in Table 1. Nutrient concentrations fluctuated greatly only in the nutrient-enriched zone (Site III), presumably due to the intermittent discharge of nutrients into the tributary. This station had the highest water-column inorganic nutrient concentrations. Little variation was found in oxygen concentrations at the
Mean hourly net primary production and respiration rates (triplicate chambers) in sediments ranged from 58.5 to 617.9 mg O2 m–2 h–1 and 11.3 to 64.4 mg O2 m–2 h–1, respectively (Fig. 2). Site II always showed the highest NPP (ANOVA, p < 0.05), except in winter. During fall and winter, muddy sediments (Site I) showed the highest respiration rates (ANOVA, p < 0.05). At Site II, the highest rates of O2 consumption (in summer; ANOVA, p < 0.05) coincided with the highest NPP rates. At both sandy sites (II, III), winter NPP rates were significantly lower than in other seasons (ANOVA, p < 0.05); at Site I, no statistical differences between seasons were observed. During the entire year, communities from all 3 sampling sites were strongly autotrophic, with GPP/R ratios always >1, with the exception of site III in winter, where the GPP/R ratio equalued 1 (Fig. 3).
Nutrient fluxes Net nutrient fluxes were linear for the entire incubation period (Fig. 4). Control chambers showed no significant differences in nutrient concentrations between Time zero and the end of the experiments (ANOVA, p > 0.05).
Table 2. Seasonal variation (means ± SD) of Douro River estuary sediment characteristics. na: not available Seasons Sites Spring I II III Summer I II III Fall I II III Winter I II III
Chl a (µg g dry wt–1)
Pheopigments (µg g dry wt–1)
pH of Organic matter interstitial water (%)
Water content (%)
Grain size (% of dry wt) > 0.5 mm < 0.5 mm
26.23 ± 3.67 76.16 ± 7.91 37.01 ± 12.19
3.82 ± 3.17 15.91 ± 7.67 9.78 ± 3.23
8.55 7.30 7.20
3.80 ± 0.09 1.11 ± 0.06 1.41 ± 0.20
35.27 ± 1.03 15.41 ± 0.91 18.55 ± 2.18
29 97 na
71 3 na
26.56 ± 7.09 107.83 ± 10.64 22.02 ± 6.73
3.81 ± 3.20 37.57 ± 8.92 5.98 ± 3.44
8.75 7.22 7.40
6.10 ± 0.50 1.26 ± 0.10 1.05 ± 0.15
44.23 ± 1.47 17.88 ± 0.86 9.86 ± 2.18
22 97 84
78 3 16
72.52 ± 9.96 87.86 ± 12.78 26.74 ± 2.70
17.66 ± 8.74 30.86 ± 9.39 9.85 ± 4.38
9.41 8.40 7.05
5.66 ± 0.14 1.40 ± 0.36 1.05 ± 0.49
44.30 ± 0.97 5.25 ± 0.34 12.42 ± 0.52
24 94 86
76 6 14
74.57 ± 15.52 37.56 ± 3.95 6.33 ± 4.40
15.69 ± 8.51 12.82 ± 4.10 1.64 ± 0.81
8.14 7.39 7.25
6.59 ± 0.13 0.74 ± 0.06 0.62 ± 0.62
56.88 ± 0.55 7.86 ± 0.25 14.13 ± 1.97
3 95 90
97 5 10
60
Mar Ecol Prog Ser 233: 55–71, 2002
140
µmol NH4+
120 100 80 60 40 20
µmol NO3-
0 0
2
4
6
8
0
2
4
6
8
0
2
4
6
8
0
2
4
6
8
0
2
4
6
8
40 35 30 25 20 15 10 5 0
µmol NO2-
1.4 1.2 1 0.8 0.6 0.4 0.2 0
µmol PO43-
Fig. 2. Seasonal hourly net production (white bars = light incubation) and respiration (shaded bars = dark incubation) rates at each sampling site (means ± SD): (a) Site I; (b) Site II; (c) Site III
16 14 12 10 8 6 4 2 0
35
Fig. 3. Seasonal variation in gross primary production/respiration (GPP/R) ratios at the 3 sampling sites. Dashed horizontal line represents GPP/R = 1
Seasonal ammonium fluxes ranged between –977.7 ± 24.0 and +105.8 ± 23.2 µmol m–2 h–1 (Fig. 5a). Release of NH4+ from sediments occurred only at the muddy site (Site I) during dark incubation; in spring, summer and winter, light incubations produced a net uptake of NH4+, whereas the dark incubations resulted
µmol DSi
30 25 20 15 10 5 0
Time (h) Fig. 4. Typical variations in water nutrient concentrations over the incubation period. The different symbols represent individual values for 3 different chambers
61
Margalhães et al.: Nutrient and oxygen fluxes in the Douro River estuary
µmol NH4+ m-2 h-1
a)
Site II
Site I
200
Site III
200
200
0
0
0
-200
-200
-200
-400
-400
-400
-600
-600
-600
-800
-800
-800
-1000
-1000
-1000
0
0
0
-200
-200
-200
-400
-400
-400
-600
-600
-600
-800
-800
-800
-1000
-1000
-1000
30 20 10 0 -10 -20 -30
30 20 10 0 -10 -20 -30
30 20 10 0 -10 -20 -30
-125
-125
-125
-150
-150
-150
0 -5 -10 -15 -20 -120 -140 -160 -180
0 -5 -10 -15 -20 -120 -140 -160 -180
0
0
0
-100
-100
-100
-200
-200
-200
-300
-300
-300
-400
-400
-400
-500
-500
Winter
µmol NO3- m-2 h-1
b)
µmol NO2- m-2 h-1
c)
Spring
Summer
Fall
Winter
µmol PO43- m-2 h-1
d) 0
-5 -10 -15 -20 -120 -140 -160 -180
µmol DSi m-2 h-1
e)
Spring
Summer
Fall
Winter
-500
Spring
Summer
Fall
Winter
Spring
Summer
Fall
Winter
Fig. 5. Seasonal mean water-sediment fluxes (± SD) of NH4+, NO3–, NO2–, PO4– and DSi in Douro River estuary (white bars = light incubation; shaded bars = dark incubation)
62
Mar Ecol Prog Ser 233: 55–71, 2002
Fig. 6. Relationship between chlorophyll a concentrations and net primary production rates (NPP) at sampling sites
in a net release of NH4+. At Site II in summer and fall, NH4+ uptake occurred in light incubations, but there was no net flux in the dark chambers. In these cases, differences between light and dark chambers were significant (Student t-test, p < 0.01). All sediments consistently removed nitrate from the overlying water under both light and dark conditions (Fig. 5b); rates ranged between –809.6 ± 45.3 and –39.7 ± 5.5 µmol m–2 h–1. No significant spatial variability was found between Sites I and II, with ANOVA revealing no significant differences between nitrate uptake rates at the 2 sites seasonally. Nitrite fluxes (–127.6 ± 7.4 to + 21.7 ± 7.1 µmol m–2 h–1) generally were directed into the sediments, with 2 exceptions in the dark chamber incubations from Site I (Fig. 5c). Net phosphate fluxes were usually into the sediments; mean values ranged between –152.4 ± 20.8 and 0 µmol m–2 h–1 (Fig. 5d). No consistent differences were found between light and dark incubations. A different seasonal pattern was found for each site (Fig. 5d). Dissolved silicate fluxes showed a general uptake by the sediments (Fig. 5e). The hourly flux rates ranged between –369.3 ± 87.5 µmol m–2 h–1 at Site III to 0 µmol m–2 h–1 at Site I. With the exception of Site I in summer, no significant differences were observed between DSi uptake rates in light and dark experiments.
Relationships of fluxes with physical, chemical and biological factors A linear regression analysis of hourly NPP rates against chl a concentrations in sandy sediments (Sites
II and III) revealed a significant, positive correlation (Fig. 6b,c), i.e. the higher the chl a content, the larger the O2 efflux. At Sites II and III, chl a concentration per se accounted for 89 and 79% of the NPP variance, respectively. However, at the muddy site (site I), no statistically significant relationship between these 2 variables was found (Fig. 6a). A stepwise regression analysis including all physical and biological environmental variables measured revealed that incubation temperature, together with the chl a concentration in the surface sediment accounted for the majority of the variance in NPP rates at the sandy sites (I, II) (r2 = 0.93; p < 0.001; n = 24). This same statistical analysis showed that in the case of the muddy sediments (Site I), sediment organic matter and net NH4+ flux accounted for 78% of the variance in NPP rates (p < 0.05; n = 12). For respiration, a somewhat different picture emerged; there were significant correlation coefficients with chl a at Sites I and II (r = 0.62, r = 0.61 respectively; p < 0.05; n = 12) but not at Site III. A close relationship between NPP and respiration rate was only observed at Site II (r = 0.93; p < 0.001; n = 12). In agreement, at Site II, the stepwise multiple regression analysis showed that chl a in the surface sediment and NPP rates accounted for 81% of the variance in respiration rates (r2 = 0.81; p < 0.001; n = 12). In the muddy sediments (Site I), respiration rates were positively related to PO4– and DSI net fluxes, and together these factors accounted for 81% of the variance (r2 = 0.81; p < 0.01; n = 12). Finally, for Site III, stepwise regression analysis revealed that the pH in interstitial water accounted for 56% of the variance in the respiration rates (r2 = 0.56; p < 0.01; n = 12). This variable was inversely correlated with the O2 consumption.
63
Margalhães et al.: Nutrient and oxygen fluxes in the Douro River estuary
Almost all net nutrient-uptake rates showed no or only weakly significant correlations with NPP rates or with chl a (Table 3). The few significant relationships between rates from all net nutrient fluxes with R rates and %OM in surface sediments (Table 3) showed an absence of consistent pattern between these variables. With respect to nutrient exchanges between the sediment and water column, the net uptake rate of each inorganic nutrient was, in the majority the cases, significantly and positively correlated with the respective nutrient concentration in the water column (Table 3). The stepwise multiple regression analysis revealed that the water-column concentrations of NH4+, NO3–, NO2– and PO4– at Site III were important variables accounting for the variance measured in the respective nutrient net uptake rates (Table 4). This same relationship was true at Site I for NO3–, NO2–, PO4– and DSi and at Site II for NO2– and DSi net uptake.
DISCUSSION Benthic oxygen fluxes The intertidal sediments of the lower Douro River estuary are highly autotrophic (GPP/R > 1, Fig. 3). In contrast, the water column of the lower estuary during 1998 was consistently heterotrophic (GPP/R ratios ranged between 0.02 and 0.28, Bordalo et al. 2000). This net productivity subsystem is of particular interest, since the Douro River estuary is, as stated previously, a polluted system (Bordalo 1991, Frankignoulle et al. 1998). Hourly sediment NPP rates were relatively high compared to data from other intertidal areas (Table 5); curiously, our O2 data are, in closer agreement with 14C-derived NPP data than with directly comparable O2 measurements. Respiration rates were clearly within the range reported by other studies (Table 5). The importance of the benthic
Table 3. Results of correlation analysis of net nutrient uptake rates with net primary production rates (NPP), Chl a, R, %OM and water column nutrient concentrations. Negative values indicate inverse relationships. *p < 0.05; **p < 0.01; ***p < 0.001; ns: not significant; R: respiration; OM: organic matter Nutrient
NPP
Chl a
R
%OM NH4+
Site I NH4+ NO3– –
NO2
PO4– DSi Site II NH4+ NO3– NO2 PO4– DSi Site III NH4+ NO3– NO2– PO4– DSi
0.50 ns –0.35 ns 0.58 * 0.16 ns –0.41 ns
0.21 ns –0.22 ns –0.01 ns 0.59 ** 0.46 *
0.53 ns 0.33 ns –0.46 ns 0.56 ns 0.84 **
0.11 ns –0.20 ns 0.03 ns 0.55 ** 0.27 ns
0.30 ns
0.09 ns –0.08 ns –0.80 ** –0.65 * –0.78 *
–0.07 ns 0.15 ns 0.72 ** –0.75 *** –0.69 ***
–0.35 ns 0.54 ns 0.75 ** –0.63 * –0.46 ns
0.09 ns 0.23 ns 0.60 ** –0.81 *** –0.46 *
0.18 ns
–0.73 ** –0.51 ns –0.12 ns –0.76 ** 0.18 ns
–0.75 *** –0.32 ns –0.16 ns –0.74 *** 0.24 ns
–0.47 ns 0.40 ns –0.55 ns –0.55 ns 0.60 *
–0.23 ns –0.66 *** 0.44 ns –0.28 ns 0.07 ns
0.98 ***
Water column concentration NO3– NO2– PO4–
DSi
0.90 *** 0.28 ns 0.67 *** 0.86 ***
0.24 ns 0.84 *** 0.43 * 0.67 ***
0.77 *** 0.98 *** 0.95 *** –0.54 **
64
Mar Ecol Prog Ser 233: 55–71, 2002
Table 4. Results of stepwise regression analysis for each net inorganic nutrient flux, using all physical, chemical and biological environmental variables. Analysis was performed for each sampling site with data from light and dark incubations (n = 24) r2
p
Net nitrite and silicate fluxes Net phosphate and nitrite fluxes, pH of interstitial water NH4+ concentration in overlying water
0.56
< 0.004
0.59 0.98
< 0.000 < 0.000
NO3– concentration in overlying water NH4+ concentration in overlying water, O2 concentration in the overlying water, Net nitrite and silicate fluxes NO3– concentration in overlying water
0.80 0.70
< 0.000 < 0.000
0.86
< 0.000
NO2 concentration in overlying water, Net ammonium and silicate fluxes NO2– concentration in overlying water NO2– concentration in overlying water
0.69
< 0.000
0.70 0.98
< 0.000 < 0.000
PO43 – concentration in overlying water O2 concentration the overlying water, %OM in sediment surface PO43 – concentration in overlying water
0.45 0.74
< 0.000 < 0.000
0.96
< 0.000
DSi concentration in overlying water DSi concentration in overlying water, pH in interstitial water, Incubation water temperature Pheopigment in sediment surface, pH in interstitial water
0.75
< 0.000
0.80
< 0.000
0.76
< 0.000
Dependent variable
Sites
Predictors
NH4+
I II III
NO3–
I II
III –
NO2
I II III
PO43 –
I II III
DSi
I II
III
–
microalgal community for estuarine productivity has also been demonstrated in other studies (Nowicki & Nixon 1985, Varela & Penas 1985, Plante-Cuny & Bodoy 1987, MacIntyre & Cullen 1996); thus, the sediment subsystem constitute an important source of O2 for the water column and of productivity for the animal biota. A significant, positive linear regression between NPP rates and chl a concentrations (Sites II and III: Fig. 6b,c) has also been reported by several authors for other temperate intertidal systems (Davis & McIntire 1983, Hargrave et al. 1983, Colijn & de Jonge 1984, Sundbäck et al. 1991, Brotas & Catarino 1995). The absence of a statistically significant relationship between these 2 variables at Site I (Fig. 6a) has also been noted by other investigators, and is explained by the strong light-attenuation affect associated with muddy sediments (e.g. Yallop et al. 1994) or by diatom migration into the sediments (e.g. Blanchard & Le Gall 1994). Barranguet (1997) also found no statistical relationship between chl a and NPP rates in subtidal muddy sediments used for mussel culture. The significant correlation between respiration rates and chl a concentrations at Sites I and II suggests that the microphytobenthos are responsible for a significant
fraction of the oxygen consumption measured at these sites, either directly or, more likely, indirectly. Caffrey et al. (1998) found a similar trend in the water column of San Francisco Bay, and concluded that phytoplankton may be responsible for a significant fraction of the pelagic respiration. The absence of this relationship at Site III emphasizes the importance of other organisms. Also, chemical redox reactions can account for significant O2 uptake in dark-incubation chambers (Joye et al. 1996). The linear relationship between NPP and respiration rates at Site II but not at Site I suggests a tight coupling between oxidative and reductive processes, and consequently faster organic matter turnover, in the sandy sediments. Cammen (1991) suggested that the latter possibility is related to the more ‘dynamic’ nature of sandy flats and the tendency for a slower response of mudflats, i.e. more rapid organic matter turnover and lower storage in sandy sediments. Some authors have demonstrated the importance of photosynthetic benthic organisms in reducing inorganic nutrient release in subtidal and intertidal sediments (Rizzo 1990, Sundbäck et al. 1991, Rizzo et al. 1992, Cabrita & Brotas 2000). In this study, weakly positive relationships between sediment chl a and PO4– and DSi net uptake rates were found (Table 3). How-
Margalhães et al.: Nutrient and oxygen fluxes in the Douro River estuary
65
Table 5. Annual variability in hourly net primary production (NPP) and respiration (R) rates for selected intertidal and subtidal systems. Oxygen data were converted to carbon assuming that 1 mg of oxygen produced or respired is equivalent to 0.375 mg of organic carbon (Uthicke & Klumpp 1998) Location
Technique
Net primary production Ems-Dollard estuary (Netherlands) Gulf of Fos (France) Neuse estuary (USA) Mississippi salt marsh (USA) Westerschelde estuary (Netherlands) Ria Arosa (Spain) Dourduff estuary (France) Tagus estuary (Portugal) Douro estuary (Portugal) Site I Site II Site III
14
C O2 O2 14 C 14 C 14 C 14 C O2 O2 O2 O2
Respiration Gulf of Fos (France) Funfy bay (Canada) Marennes–Oléron bay (France) Neuse estuary (USA) Rhode Island bay (USA) Chesapeake bay (USA) Magu lagoon (California) Georgia marsh (USA) Fourleague bay (Louisiana, USA) Gulf of Fos (France) Tagus estuary (Portugal) Douro estuary (Portugal) Site I Site II Site III
O2 O2 O2 O2 O2 O2 O2 O2 O2 O2 O2 O2 O2 O2
NPP or R (mg C m–2 h–1)
Type of sediment
Source
5–120 0–15 0–31 2–21 5–100 10–24 350–900 6–24 75–112 65–231 22–112
Intertidal Intertidal/subtidal Intertidal Intertidal Intertidal Intertidal Intertidal Intertidal Intertidal Intertidal Intertidal
Colijn & de Jonge (1984) Barranguet (1997) Rizzo et al. (1992) Sullivan & Moncreiff (1988) Barranguet et al. (1998) Varela & Penas (1985) Riaux-Gobin et al. (1993) Brotas & Catarino (1995) This study This study This study
10–18 11–29 4–6 4–5 6–71 2–85 14–46 8–50 0–53 1–51 2–56 10–21 4–24 6–13
Intertidal/subtidal Intertidal Intertidal Intertidal Intertidal Intertidal/subtidal Intertidal Intertidal Subtidal Intertidal/subtidal Intertidal Intertidal Intertidal Intertidal
Barranguet (1997) Hargrave et al. (1983) Gouleau et al. (1994) Rizzo et al. (1992) Nowicki & Nixon (1985) Rizzo & Wetzel (1985) Shaffer & Onuf (1983) Pomeroy (1959) Teague et al. (1988) Barranguet et al. (1996) Cabrita & Brotas (2000) This study This study This study
ever, at Site II an inverse relationship between NPP rates and chl a concentration with PO4– and DSi net uptake rates was seen; this inverse relationship was also seen at Site III with NH4+ and PO4– net influx (Table 3). In subtidal sediments, Cowan et al. (1996) reported a similar trend of positive, significant relationships between average chl a concentrations and the release of NH4+, PO4– and DSi from the sediments. In the present study, the lack of significant relationships between NPP or chl a and net inorganic nutrient fluxes, and the lack of consistent directions of the relationships at the 3 sites, indicates the absence of tight coupling between net nutrient fluxes and benthic primary producers.
Benthic nutrient fluxes Inorganic nitrogen During this study, uptake of NH4+ was generally observed for both light and dark incubations (Fig. 5a). The usual explanation for the higher uptake of NH4+
observed in some light chambers at Sites I and II would be by the direct influence of benthic microalgae on water-sediment nutrient fluxes (Sundbäck et al. 1991, Asmus et al. 1998). Nevertheless, the ratios of C:NH4+ (between 79 and 368), for which differences between light and dark treatments were found, show that the rates of NH4+ uptake alone could not have fulfilled the requirements of the benthic primary producers. This suggests that nutrients regenerated within the sediments must also supply primary producers. Nitrification could represent a major process for NH4+ removal from the water column. The oxygen produced by benthic microalgae could also create better conditions for nitrification and account for the higher rates of NH4+ influx in the light chambers. In order to assess the oxygen requirements for nitrification of the ammonium influx measured, atomic ratios of oxygen consumption and NH4+ uptake were compared with the oxygen required to produce nitrate during nitrification (O2:N-NH4+ = 1.8: Metcalf & Eddy 1991). In general, high O2:NH4+ ratios occurred at all sites (between 15 to 61), whereas at Site III, some were close to 1.8 (between 1 and 1.5) and were even lower during sum-
66
Mar Ecol Prog Ser 233: 55–71, 2002
mer and winter (between 0.4 and 0.8). In the last 2 cases, aerobic nitrification could not account for the ammonium net fluxes, because even when values are similar to the expected O2:NH4+ ratio, nitrification cannot be the only process responsible for O2 uptake. These suggest that processes other than aerobic autotrophic nitrification must be responsible for this NH4+ influx. Anaerobic NH4+ oxidation, in which NH4+ is oxidized with nitrate serving as the electron acceptor (Mulder et al. 1995), might also account for the NH4+ uptake rates at Site III. Ammonium efflux occurred only at Site I (muddy sediments) in dark incubations (Fig. 5a). In this case, molar ratios of oxygen consumed versus rates of ammonium release (O:NH4+) were calculated and compared with those expected from the decomposition of phytoplankton, O:N = 13.25 (Redfield 1934). During spring higher ratios were found (21.8 ± 3.4). Whereas in summer ratios were smaller (8.4 ± 3.4), suggesting, in this case, that aerobic decomposition was not the dominant process. In winter, the high variability between replicates did not allow any conclusion regarding the role of respiration in the flux of NH4+. The expected lower ammonium assimilation by microalgae during the night period (Yin et al. 1998) could also account for the efflux of NH4+ in the dark chambers. The fine particle size of muddy sediments (Site I) could also contribute to the absence of nitrification during the dark treatment by limiting O2 diffusion into the sediments. Furthermore, the high percentage of organic matter in the reduced sediments could promote H2S production and, consequently, the inhibition of nitrification (Joye & Hollibaugh 1995). In this study nitrate sediment influxes were observed at all 3 sites and all 4 sampling times (Fig. 5b). The uptake of nitrate into sediments has also been described in other studies (Keizer et al. 1989, Falcão & Vale 1990, Ogilvie et al. 1997, Asmus et al. 1998, Cabrita & Brotas 2000). The absence of significant differences between light and dark incubations together with the high ratios of C:NO3– net fluxes in light chambers compared with the Redfield ratio (34.5 ± 20.2; 40.9 ± 22.7; 58.7 ± 90.1 for Sites I, II and III, respectively) and the lack of statistical relationships between NPP or chl a and NO3– net uptake rates (Table 3), suggests that primary production does not influence the NO3– influx. Also, Yin et al. (1998) demonstrated light-dependence for NO3– uptake rates by cultures of marine diatoms, and Ogilvie et al. (1997) observed higher denitrification rates when nitrate uptake was higher. The general nitrite influx observed (Fig. 5c) strengthens the idea that denitrification is important in these sediments. While there are numerous reports of muddy sediments with higher rates of denitrification than sandy sediments (cf. Chalamet 1985, Ogilvie et al.
1997), this is clearly not the case here (Fig. 5b). Lohse et al. (1995) also reported similar denitrification rates of some sandy and muddy stations in North Sea subtidal sediments.
Inorganic phosphate The results from this study show that intertidal sediments of the Douro River estuary sequester (Fig. 5d) inorganic phosphate. The lack of consistent differences between light and dark treatments (Fig. 5d) suggests that photosynthesis was not directly responsible for the net flux rates observed, since the microalgae would be expected to assimilate more inorganic phosphate during the light period (Crisholm & Stross 1976). Also C:P ratios of hourly net influxes in the lightincubation chambers were always much higher (2747.4 ± 1648.2) than those expected by the Redfield ratio (C:P = 106), with the exception of Site III during the high PO4– loading (summer and winter). Rizzo (1990) proposed that when phosphate concentrations within a sediment are in excess of benthic algal requirements, net sediment-water fluxes will not be measurably affected by photosynthesis. The absence of significant, positive relationships between net PO4– uptake rates and NPP in the sediment (Table 3) also supports the idea that the net PO4– uptake rates measured did not reflect phosphate assimilation by microphytobenthos. The mobility of phosphate in sediments depends upon the pH, O2 concentration, and salinity, but each phosphate fraction responds in a particular manner (de Jonge & Villerius 1989, Gómez et al. 1999). In the Douro River estuary, the autotrophic nature of intertidal sediments combined with the rather oxygenated water column (Bordalo 1991) probably maintain a permanently aerobic sediment layer with capacity for PO4– adsorption. Gómez et al. (1999) found that when sediments shifted to oxic conditions, storage of phosphate was proportional to the relative concentration in the overlying water. In agreement, significant positive relationships were observed between phosphate uptake and its concentration in the overlying water at all 3 sites (Table 3); this last variable emerged as an important regulating factor explaining the PO4– uptake rates at Sites I and III (Table 4). At Site II, a significant positive correlation between the O2 concentration in the incubation water and net PO4– uptake rates was observed (r = 0.73, p < 0.001, n = 24). This variable, together with the percentage organic matter in the surface sediment, accounted for 74% of the variance in net PO4– flux (Table 4). At this stage, we cannot resolve whether physicochemical, biological or a combination of these pro-
Margalhães et al.: Nutrient and oxygen fluxes in the Douro River estuary
cesses was responsible for the measured PO4– net fluxes. Nevertheless, rates of desorption of phosphate by reduction of iron oxides in the deeper layers (Sundby et al. 1992), calcite dissolution (de Jonge & Villerius 1989, Gómez et al. 1999) or phosphate regenerated by mineralization, must have been less than the rates of uptake processes combined (biological uptake, sediment ‘binding’)
Inorganic silicate The assimilation of DSi for the formation of silicious skeletons of diatoms assumes great importance in terms of total biogenic silicate production (Tréguer et al. 1991, 1995, Conley 1997). Biological uptake of DSi and transformation into biogenic silicate during diatom growth could account for the net uptake of DSi observed in these intertidal sediments. Tréguer et al. (1991) reported rates of pelagic biogenic silicate production of between 90 and 950 µmol Si m–2 h–1 in the Weddell-Scotia Sea. The net DSi uptake rates found in the present study are generally within those values (Fig. 5e). Several investigators have used benthicexchange chambers to demonstrate the importance of biogenic silicate dissolution at the sediment-water interface to DSi availability in surface waters; in these cases, DSi release was constant (Yamada & d’Elia 1984, Gómez-Parra & Forja 1993, Cowan et al. 1996). During the present study, sediment removal of dissolved silicate from the water suggests that the rates of silicate dissolution within the sediments were not sufficient for the requirements of the sediment diatom communities. Consequently, not only did regenerated DSi not reach the water column, but even water-column DSi was utilizid by the benthic diatoms. Contrary to our expectation, the net uptake rates of DSi did not show significant differences between light and dark incubations, with the exception of Site I during summer. In agreement with this, Cowan et al. (1996) reported no differences between light (48 µE m–2 s–1) and dark DSi fluxes in a subtidal sediment. However, Sundbäck et al. (1991) found a lower DSi efflux in chambers exposed to the light/dark daily cycle compared with those exposed to permanent darkness. Light-limitation of biogenic silicate production was reported by Tréguer et al. (1991), who observed lower biogenic silicate production rates in deeper waters. Davis (1976) also demonstrated that light levels affected silicate uptake by marine diatoms in culture. Non light-limited processes (e.g. adsorption of DSi by hydrated oxides of aluminium, iron, manganese and magnesium: Edwards & Liss 1973), can also play a role in the net uptake rates of DSi measured. Mackenzie et
67
al. (1967) found that all silicate minerals tested adsorbed dissolved silicate during incubation with enriched DSi seawater. For the sediments of the Douro River estuary, it is likely that a combination of biogenic silicate production and adsorption-desorption processes were responsible for the constant removal of DSi from the water column, and accounted for the lack of light/dark differences in net fluxes. At Sites I and II, uptake rates were proportional to the DSi concentration in the overlying water (Table 3) and stepwise regression analysis identified this variable as important in accounting for the measured variance in net DSi (Table 4). However, this relationships was not found at Site III (nutrient enriched zone), perhaps due to saturation of the uptake processes.
Nutrient flux dynamics In most cases, the direction of nutrient flux was into the sediments (Fig. 5). Compared to other studies, the uptake rates reported here are high (Table 6). Only Cabrita & Brotas (2000) and Ogilvie et al. (1997) found much higher values of nitrate uptake rates, and Asmus et al. (1998) and Ogilvie et al. (1997) measured higher NH4+ influx rates. Generally, results from other estuarine systems have shown nutrient flux rates that vary seasonally in either direction. In the Douro River estuary, nutrient release from sediments was occasionally observed, but only at the saltmarsh (Site I, Fig. 5c). Sundbäck et al. (1991) reported that release of nutrients from muddy sediments was always higher than that from sandy sediments. With respect to the factors that might regulate nutrient fluxes, the results clearly show that in the majority of cases nutrient concentrations in the water column were important variables determining the variability in net nutrient fluxes (Table 4). Thus, the seasonal patterns observed for each site may in fact be related to the seasonal availability of nutrients in the water column. The dependence of sediment-water nutrient uptake on the nutrient concentrations in the water column has also been reported by other authors, especially for nitrate (Boynton & Kemp 1985, Ogilvie et al. 1997, Asmus et al. 1998), and phosphate (Cowan et al. 1996). The high response capacity of these sediments to rapid changes in nutrient loading was particularly clear at Site III, where the water column had very high inorganic nutrient concentrations (Table 1, Fig. 5). Thus, remineralization in these intertidal sediments almost never contributed to the inorganic nutrient demands of phytoplankton in the Douro River estuary, as has been reported for other systems (Rizzo 1990, Gómez-Parra & Forja 1993, Cowan et al. 1996).
68
Mar Ecol Prog Ser 233: 55–71, 2002
Table 6. Range (min/max) of sediment-water nutrient exchange rates (µmol m–2 h–1) in selected intertidal and subtidal coastal systems (negative values = uptake; positive values = release) NH4+
NO3–
NO2–
PO43–
Location
Depth (m)
DSi
Mobile Bay (USA) Fourleague Bay (USA) York River (USA) Neuse River estuary (USA) Bay of Fundy (Canada) Konigshafen Bay (Germany) Thau lagoon (France) Chesapeake Bay (USA) Colne estuary (UK) Gulf of Finland (Finland) Louisiana continental shelf (USA) Mangrove lagoon (Puerto Rico) Mangrove (Jamaica) Everglades mangrove (USA) Indo delta (South-East Asia) Tagus estuary (Portugal) Douro estuary (Portugal) Site I Site II Site III
3 –22/181 –14/67 –3/20 –2/20 –16/342 1.5 –50/450 –625/600a –50/14a 2 –162/364 –45/22a –6/80 1 –12/22 –6/10b –12/23 Intertidal 17/37 –30/0a –50/130a Intertidal –6700/15400 –492/173 5 –30/600 –158/24 –15/53 6 36/821 –125/288a –5/40a Intertidal –800/1800 –3000/1000a 35–85 9/35 –7/13 –0.1/3 2/29 72/84 20 95/151 –24/–9 0.05/3.4 –10/4 252/317 Intertidal –5/–2b Intertidal –150/–100 –35/–19 Intertidal –200/–50 –45/–12 Intertidal –660/–550b Intertidal –116/150a –14900/5300a –0.7/0.6a Intertidal –109/106 –512/–129 –7/22 –8/0 –213/0 Intertidal –104/0 –608/–115 –9/0 –9/0 –287/–100 Intertidal –978/–54 –810/–40 –128/0 –152/0 –369/–119
Source Cowan et al. (1996) Teague et al. (1988) Rizzo (1990) Rizzo et al. (1992) Keizer et al. (1989) Asmus et al. (1998) Mazouni et al. (1996) Boynton & Kemp (1985) Ogilvie et al. (1997) Conley et al. (1997) Miller-Way et al. (1994) Corredor & Morell (1989) Merickel & Wiebe (unpubl.) Merickel & Wiebe (unpubl.) Kristensen et al. (1988) Cabrita & Brotas (2000) This study This study This study
a
Data derived from figures Values for nitrate + nitrite
b
Ecological implications Extrapolated annual NPP calculations result in a net primary production of 230.57, 316.17 and 194.96 g C m–2 yr–1, for Sites I, II and III, respectively. These values correspond well with those for other estuaries (cf. Colijn & de Jonge 1984, Brotas & Catarino 1995). Annual respiration rates however, were rather low (142.65, 125.00 and 78.72 g C m–2 yr–1, for Sites I, II and III, respectively). In contrast, water-column annual net primary productivity in the Douro River estuary (1998 to 1999) ranged between 44.2 and 264.8 g C m–2 yr–1, whereas respiration rates varied between 199.9 and 617.7 g C m–2 yr–1 (Bordalo et al. 2000). This emphasizes the importance of intertidal sediments for the net productivity of the Douro River estuary. The planned dredging of the intertidal flat for navigation and marinas will eliminate much of the sediment microbial food web, since the microphytobenthos moderates carbon flow in sediments (Middelburg et al. 2000). The role of the microphytobenthos as an important food resource for benthic deposit- and suspension-feeders has been reported in several studies (e.g. Miller et al. 1996, Pace & Carman 1996, Riera et al. 1996). In addition, dredging will decrease phytoplankton abundance and productivity within the water column because of the increased suspended matter (de Jonge 1983) and because of the loss of the intertidal microphytobenthos, which are suspended into the water column via
wind-induced waves (de Jonge & van Beusekom 1995, Middelburg et al. 2000). In order to assess the role of intertidal sediments in inorganic nutrient concentration in the estuarine water column during summer, the season most suitable for coastal phytoplankton (including red tide blooms) total inorganic nutrient availability was compared with sediment removal. Nutrient availability was estimated by multiplying the water-column concentrations with the total river discharge in August 1999 (2.22 × 10⁸ m3 mo–1). The hourly net nutrient-flux rates were integrated over time, and inorganic nutrient uptake was estimated as the sum of daily summer values divided by 2, assuming that intertidal sediments were covered by water half of the time. During the summer, all intertidal sediments of the Douro River estuary (1.5 km2) removed nutrients from the water column (0.6% of PO4–, 0.3% of NH4+, 3.3% of NO3–, 3.8% of NO2–, and 2.9% of DSi). While these numbers are small, in situations where freshwater discharge is even less, and consequently residence time longer (Vieira & Bordalo 2000), the percentage removal would be higher (Balls 1994). The attenuation of water-column nutrient concentrations during periods of the year when coastal algal blooms occur assumes particular importance in eutrophic systems like the Douro River estuary. Oxygenation of the water column above the intertidal zones, through the benthic producers and inherent hydrodynamics characteristics of the intertidal flats (Baillie 1986) will be changed by
Margalhães et al.: Nutrient and oxygen fluxes in the Douro River estuary
dredging, switching from an intertidal to a subtidal environment. The changes in oxygen conditions as well as changes in benthic communities will directly impact the inorganic nutrient dynamics of these sediments. The forecast is for more and longer-lasting coastal summer phytoplankton blooms and a severe reduction in animals that require grazing of intertidal flats during some stage of their development.
Acknowledgements. We thank J. Sheldon and V. Brotas for technical advice and assistance in learning techniques. We thank M. Hilário, M. J. Magalhães and P. Mucha for their assistance in fieldwork and incubation experiments. We also thank Professor de Jonge and 2 anonymous reviewers for extremely helpful comments and suggestions. This study was partially funded by the Luso-American Foundation (FLAD), Institute of Marine Research (IMAR) through a mobility grant to C.M.M. and the NSF through project 10-21-RR100-199 to W.J.W. LITERATURE CITED Asmus RM, Jensen MH, Jensen KM, Kristensen E, Asmus H, Wille A (1998) The role of water movement and spatial scaling for measurement of dissolved inorganic nitrogen fluxes in intertidal sediments. Estuar Coast Shelf Sci 46: 221–232 Baillie PW (1986) Oxygenation of intertidal estuarine sediments by benthic microalgal photosynthesis. Estuar Coast Shelf Sci 22:143–159 Balls PW (1994) Nutrient inputs to estuaries from nine Scottish east coast rivers: influence of estuarine processes on inputs to the North Sea. Estuar Coast Shelf Sci 39:329–352 Barbanti A, Ceccherelli VU, Frascari F, Reggiani G, Rosso G (1992) Nutrient regeneration processes in bottom sediments in a Po delta lagoon (Italy) and the role of bioturbation in determining the fluxes at the sediment-water interface. Hydrobiologia 228:1–21 Barranguet C (1997) The role of microphytobenthic primary production in a Mediterranean mussel culture area. Estuar Coast Shelf Sci 44:753–765 Barranguet C, Plant-Cuny MR, Alivon E (1996) Microphytobenthos production in the Gulf of Fos, French Mediterranean coast. Hydrobiologia 333:181–193 Barranguet C, Kromkamp J, Peene J (1998) Factors controlling primary productivity and photosynthetic characteristics of intertidal microphytobenthos. Mar Ecol Prog Ser 173:117–126 Berner RA (1971) Principles of chemical sedimentology. McGraw-Hill, New York Blanchard GF, Le Gall VC (1994) Photosynthetic characteristics of microphytobenthos in Marennes-Oléron Bay, France: preliminary results. J Exp Mar Biol Ecol 182:1–14 Bordalo AA (1991) Ecology of River Douro estuary. Spatial and temporal relationships in the microbial compartmant. PhD thesis, University of Porto Bordalo AA, Magalhães C, Wiebe WJ (2000) The importance of primary productivity in a polluted mesotidal estuary (Douro, Portugal). In: 31st Ann Symp Estuar Coast Sci Assoc, p 21 (Abstract) Boynton WR, Kemp WM (1985) Nutrient regeneration and oxygen consumption by sediments along an estuarine salinity gradient. Mar Ecol Prog Ser 23:45–55
69
Brotas V, Catarino F (1995) Microphytobenthos primary production of Tagus estuary intertidal flats (Portugal). Neth J Aquat Ecol 29:333–339 Cabrita MT, Brotas V (2000) Seasonal variation in denitrification and dissolved nitrogen fluxes in intertidal sediments of the Tagus estuary, Portugal. Mar Ecol Prog Ser 202: 51–65 Caffrey JM, Cloern JE, Grenz C (1998) Changes in production and respiration during a spring phytoplankton bloom in San Francisco Bay, California, USA: implications for net ecosystem metabolism. Mar Ecol Prog Ser 172:1–12 Cammen LM (1991) Annual bacterial production in relation to benthic microalgal production and sediment oxygen uptake in an intertidal sandflat and an intertidal mudflat. Mar Ecol Prog Ser 71:13–25 Carpenter JH (1965) The accuracy of the Winkler method for dissolved oxygen. Limnol Oceanogr 10:135–140 Chalamet A (1985) Effects of environmental factors on denitrification. In: Golterman HL (ed) Denitrification in the nitrogen cycle. Plenum Press, New York, London, p 7–29 Colijn F, de Jonge VN (1984) Primary production of microphytobenthos in the Ems-Dollard estuary. Mar Ecol Prog Ser 14:185–196 Conley DJ (1997) Riverine contribution of biogenic silica to the oceanic silica budget. Limnol Oceanogr 42:774–777 Conley DJ, Stockenberg A, Carman R, Johnstone RW, Rahm L, Wulff F (1997) Sediment-water nutrient fluxes in the Gulf of Finland, Baltic Sea. Estuar Coastal Shelf Sci 45: 591–598 Corredor JE, Moller JM (1989) Assessment of inorganic nitrogen fluxes across sediment-water interface in a tropical lagoon. Estuar Coastal Shelf Sci 28:339–345 Cowan JLW, Pennock JR, Boynton WR (1996) Seasonal and interannual patterns of sediment-water nutrient and oxygen flux in Mobile Bay, Alabama (USA): regulating factors and ecological significance. Mar Ecol Prog Ser 141: 229–245 Crisholm SW, Stross RG (1976) Phosphate uptake kinetics in Euglena gracillis (Euglenophyceae) grown on light/dark cycles. I. Synchronized batch cultures. J Phycol 12: 210–217 Davey JT, Watson PG (1995) The activity of Nereis diversicolor (Polychaeta) and its impact on nutrient fluxes in estuarine waters. Ophelia 41:57–70 Davis CO (1976) Continuous culture of marine diatoms under silicate limitation. II. Effect of light intensity on growth and nutrient uptake of Skeletonema costatum. J Phycol 12: 291–300 Davis MW, McIntire CD (1983) Effects of physical gradients on the production dynamics of sediment-associated algae. Mar Ecol Prog Ser 13:103–114 de Jonge VN (1983) Relations between annual dredging activities, suspended matter concentrations, and the development of the tidal regime in the Ems estuary. Can J Fish Aquat Sci 40:289–300 de Jonge VN, van Beusekom JEE (1995) Wind and tide induced resuspension of the sediment and microphytobenthos from tidal flats in the Ems estuary. Limnol Oceanogr 40:766–778 de Jonge VN, Villerius LA (1989) Possible role of carbonate dissolution in estuarine phosphate dynamics. Limnol Oceanogr 34:332–340 Draper N, Smith H (1981) Applied regression analysis. John Wiley and Sons, New York Edwards AMC, Liss PS (1973) Evidence for buffering of dissolved silicon in fresh waters. Nature 243:341 Falcão M, Vale C (1990) Study of the Ria Formosa ecosystem:
70
Mar Ecol Prog Ser 233: 55–71, 2002
benthic nutrient remineralization and tidal variability of nutrients in the water. Hydrobiologia 207:137–146 Frankignoulle M, Abril G, Borges A, Bourge I, Canon C, Delille B, Libert E, Théate JM (1998) Carbon dioxide emission from European estuaries. Science 282:434–436 Gómez E, Durillon C, Rofes G, Picot B (1999) Phosphate adsorption and release from sediments of brackish lagoons: pH, O2 and loading influence. Water Res 33: 2437–2447 Gómez-Parra A, Forja JM (1993) Benthic nutrient fluxes in Cadiz Bay. Hydrobiol 252:23–34 Gouleau D, Blanchard G, Cariou-Le Gall V (1994) Production potentielle et consommation d’oxygène sur une vasière intertidale au cours d’une émersion. Vie Millieu 44: 109–115 Grasshoff K, Ehrhardt M, Kremling K (1983) Methods of seawater analysis. Verlag Chemie, Weinheim Hargrave BT, Prouse NJ, Philips GA, Neame PA (1983) Primary production and respiration in pelagic and benthic communities at two intertidal sites in the upper Bay of Fundy. Can J Fish Aquat Sci 40:229–243 Jickells TD (1998) Nutrient biogeochemistry of the coastal zone. Science 281:217–222 Jones MN (1984) Nitrate reduction by shaking with cadmium: alternative to cadmium columns. Water Res 18:643–646 Joye SB, Hollibaugh JT (1995) Influence of sulfide inhibition of nitrification on nitrogen regeneration in sediments. Science 270:623–625 Joye SB, Mazzotta ML, Hollibaugh JT (1996) Community metabolism in microbial mats: the occurrence of biologically-mediated iron and manganese reduction. Estuar Coast Shelf Sci 43:747–766 Keizer PD, Hargrave BT, Gordon JDC (1989) Sediment-water exchange of dissolved nutrients at an intertidal site in the upper reaches of the Bay of Fundy. Estuaries 12:1–12 Kristensen E, Anderson FO, Kofoed (1988) Preliminary assessment of benthic community metabolism in a south-east Asian mangrove swamp. Mar Ecol Prog Ser 48:137–145 Lamontagne I, Cardinal A, Fortier L (1986) Intertidal microalgal production and the auxiliary energy of tides. Mar Biol 91:409–419 Lohse L, Malschaert JFP, Slomp CP, Helder W, van Raaphorst W (1995) Sediment-water fluxes of inorganic nitrogen compounds along the transport route of organic matter in the North Sea. Ophelia 41:173–197 MacIntyre HL, Cullen JJ (1996) Primary production by suspended and benthic microalgae in a turbid estuary: timescales of variability in San Antonio Bay, Texas. Mar Ecol Prog Ser 145:245–268 Mackenzie FT, Garrels RM, Brickler OP, Bickley F (1967) Silica in sea water: control by silica minerals. Science 155: 1404–1405 Magalhães C, Bordalo AA, Wiebe WJ (2000) Intertidal environments in the Douro estuary: seasonal community metabolism, microphytobenthic composition and nutrient fluxes. In: 31st Ann Symp Estuar Coast Sci Assoc, p 81 (Abstract) Mazouni N, Gaertner JC, Deslous-Paoli JM, Landrein S, d’Oedenberg GM (1996) Nutrient and oxygen exchanges at the water-sediment interface in a shellfish farming lagoon (Thau, France). J Exp Mar Biol Ecol 205:91–113 Metcalf L, Eddy HP (1991) Wastewater engineering: treatment, disposal and reuse. McGraw-Hill, Singapore Middelburg JJ, Barranguet C, Boschker HTS, Herman PMJ, Moens T, Heip CHR (2000) The fate of intertidal microphytobenthos carbon: an in situ 13C-labeling study. Limnol Oceanogr 45:1224–1234
Miller DC, Geider RJ, MacIntyre HL (1996) Microphytobenthos: the ecological role of the ‘secret garden’ of unvegetated, shallow-water marine habitats. II. Role in sediment stability and shallow-water food webs. Estuaries 19: 202–212 Miller-Way T, Boland GS, Twilley RR (1994) Sediment oxygen consumption and benthic nutrient fluxes on the Louisiana continental shelf: a methodological comparation. Estuaries 17:809–815 Mulder A, van de Graaf, AA, Robertson, LA, Kuenen JG (1995) Anaerobic ammonium oxidation discovered in a denitrifying fluidized bed reactor. FEMS Microbiol Ecol 16:177–184 Nowicki BL, Nixon SW (1985) Benthic nutrient remineralization in a coastal lagoon ecosystem. Estuaries 8:182–190 Ogilvie B, Nedwell DB, Harrison RM, Robinson A, Sage A (1997) High nitrate, muddy estuaries as nitrogen sinks: the nitrogen budget of the River Colne estuary (United Kingdom). Mar Ecol Prog Ser 150:217–228 Pace MC, Carman KR (1996) Interspecific differences among meiobenthic copepods in the use of microalgal food resources. Mar Ecol Prog Ser 143:77–86 Parsons TR, Maita Y, Lalli CM (1984) A manual of chemical and biological methods for seawater analysis. Pergamon Press, Elmsford, NY Pinkney J, Zingmark RG (1993) Photophysiological responses of intertidal benthic microalgal communities to in situ light environments: methodological considerations. Limnol Oceanogr 38:1373–1383 Plante-Cuny MR, Bodoy A (1987) Biomasse et production primaire du phytoplancton et du microphytobenthos de deux biotopes sableux (Golf de Fos, France). Oceanol Acta 10: 223–237 Pomeroy LR (1959) Algal productivity in salt marshs of Georgia. Limnol Oceanogr 4:386–397 Redfield AC (1934) On the proportions of organic derivatives in seawater and their relation to the composition of the plankton. In: Johnstone memorial volume. University Press, Liverpool, p 176–192 Riaux-Gobin C, Wafar MVM, Klein B (1993) Production primaire potentielle microphytobenthique d’une slikke de Nord Bretagne: stratification vertical. J Exp Mar Biol Ecol 169:215–231 Riera P, Richard P, Grémare A, Blanchard G (1996) Food source of intertidal nematodes in the bay of MarennesOléron (France), as determined by dual stable isotope analysis. Mar Ecol Prog Ser 142:303–309 Rizzo WM (1990) Nutrient exchanges between the water column and subtidal benthic microalgal community. Estuaries 13:219–226 Rizzo WM, Wetzel RL (1985) Intertidal and shoal benthic community metabolism in a temperate estuary: studies of spatial and temporal scales of variability. Estuaries 8:342–351 Rizzo WM, Lackey GJ, Christian RR (1992) Significance of euphotic, subtidal sediments to oxygen and nutrient cycling in a temperate estuary. Mar Ecol Prog Ser 86: 51–61 Rocha C, Cabral AP (1998) The influence of tidal action on porewater nitrate concentration and dynamics in intertidal sediments of the Sado estuary. Estuaries 21:635–645 Seitzinger SP (1990) Denitrification in aquatic sediments. In: Revsbech NP, Sørensen J (eds) Denitrification in soil and sediment. Plenum Press, New York, p 301–322 Shaffer GP, Onuf CP (1983) An analysis of factors influencing the primary production of the benthic microflora in a Southern California Lagoon. Neth J Sea Res 17:126–144 Sullivan MJ, Moncreiff C (1988) Primary production of
Margalhães et al.: Nutrient and oxygen fluxes in the Douro River estuary
71
edaphic algal communities in a Mississipi salt marsh. J Phycol 24:49–58 Sundbäck K, Enoksson V, Granéli W, Pettersson K (1991) Influence of sublittoral microphytobenthos on the oxygen and nutrient flux between sediment and water: a laboratory continuous-flow study. Mar Ecol Prog Ser 74:263–279 Sundby B, Gobeil C, Silverberg N (1992) The phosphorus cycle in coastal marine sediments. Limnol Oceanogr 37: 1129–1145 Teague KG, Madden C, Day JW (1988) Sediment-water oxygen and nutrient fluxes in a river-dominated estuary. Estuaries 11:1–9 Tréguer P, Lindner L, van Bennekom AJ, Leynaert A, Panouse M, Jacques G (1991) Production of biogenic silica in the Weddell-Scotia Seas measured with 32Si. Limnol Oceanogr 36:1217–1227 Tréguer P, Nelson DM, van Bennekom AJ, DeMaster DJ, Leynaert A, Quéguiner B (1995) The silica balance in the world ocean: a reestimate. Science 268:375–379 Usui T, Koike I, Ogura N (1998) Tidal effect on dynamics of pore water nitrate in intertidal sediment of a eutrophic estuary. J Oceanogr 54:205–216 Uthicke S, Klumpp DW (1998) Microphytobenthos commu-
nity production at a near-shore coral reef: seasonal variation and response to ammonium recycled by holothurians. Mar Ecol Prog Ser 169:1–11 van Luijn F, Boers PCM, Lijklema L, Sweerts JPRA (1999) Nitrogen fluxes and processes in sandy and muddy sediments from shallow eutrophic lake. Water Res 33:33–42 Varela M, Penas E (1985) Primary production of benthic microalgae in an intertidal sand flat of the Ria de Arosa NW Spain. Mar Ecol Prog Ser 25:111–119 Vieira MEC, Bordalo AA (2000) The Douro estuary (Portugal): a mesotidal salt wedge. Oceanol Acta 23:585–594 Yallop ML, Winder B, Paterson DM, Stal LJ (1994) Comparative structure, primary production and biogenic stabilization of cohesive and non-cohesive marine sediments inhabited by microphytobenthos. Estuar Coastal Shelf Sci 39:565–582 Yamada SS, D’Elia CF (1984) Silicic acid regeneration from estuarine sediment cores. Mar Ecol Prog Ser 18:113–118 Yin K, Harrison PJ, Dortch Q (1998) Lack of ammonium inhibition of nitrate uptake for a diatom grow under low light conditions. J Exp Mar Biol Ecol 228:151–165 Zar JH (1996) Biostatistical analysis. 3rd edn. Prentice-Hall, Upper Saddle River, NJ
Editorial responsibility: Victor de Jonge (Contributing Editor), Haren, The Netherlands
Submitted: April 1, 2000; Accepted: May 23, 2001 Proofs received from author(s): April 26, 2002