Nestle Waters of North America, the University of Maine Graduate School, ...... C. T., G. B. Lawrence, A. J. Bulger, T. J. Butler, C. S. Cronan, C. Eagar, K. F..
SPATIAL AND TEMPORAL PATTERNS OF AMPHIBIAN DISEASE IN ACADIA NATIONAL PARK WETLANDS
By Megan K. Gahl B.S. Ohio State University, 1995
A THESIS Submitted in Partial Fulfillment of the Requirements for the Degree of Doctor of Philosophy (in Ecology and Environmental Sciences)
The Graduate School The University of Maine May, 2007
Advisory Committee: Aram J.K. Calhoun, Associate Professor of Wetland Ecology, Advisor William E. Glanz, Associate Professor of Zoology David E. Green, Veterinary Pathologist, USGS-National Wildlife Health Center Joyce E. Longcore, Assistant Research Professor of Biology Katherine E. Webster, Assistant Professor of Biology
© Megan K. Gahl All Rights Reserved
SPATIAL AND TEMPORAL PATTERNS OF AMPHIBIAN DISEASE IN ACADIA NATIONAL PARK WETLANDS
By Megan K. Gahl Thesis Advisor: Dr. Aram J.K. Calhoun
An Abstract of the Thesis Presented in Partial Fulfillment of the Requirements for the Degree of Doctor of Philosophy (in Ecology and Environmental Sciences) May, 2007
Amphibian mortality events in protected and relatively pristine settings have increased dramatically over the past two decades. We investigated larval die-off events in Acadia National Park (ANP), Maine, USA, to determine disease ecology and incidence on three scales: landscape, within a single breeding pond, and species-specific responses. For the landscape approach, we examined 60 amphibian breeding wetlands of varying disease history to determine landscape features specific to wetlands that sustained mortality events caused by ranavirus. We used logistic regression and model selection criterion (QAICc) to identify landscape features key to predicting ranavirus incidence. High catchment position was the most important landscape feature associated with larval mortality events. No spatial autocorrelation of disease events was observed, suggesting that within our study area, epizootics are not clustered and landscape and within-pond stressors may be more influential in ranavirus occurrence than vector movement.
At the breeding pond scale, we used field measurements of biological, chemical, and physical stressors in wetland sites that were concurrently being monitored for die-off events to identify stressors associated with disease incidence that merit more detailed investigation. Few sublethal stressors were significantly associated with ranavirus or the Perkinsus-Mke organism in our statistical results. From our work, we suggest that for ranavirus, the Perkinsus-like, organism, and Ichthyophonus, disease ecology is more important than environmental conditions, with the potential exception of aluminum and temperature stressors. However, for chytridiomycosis (Bd) and Saprolegnia, environmental conditions may be important in controlling and instigating outbreaks. To approach amphibian species level responses, we used three years of comprehensive disease screenings of free-living amphibians combined with in-field health screenings in 26 wetlands to determine potential amphibian reservoir hosts, vectors, and amplifying hosts for four emerging amphibian diseases. We confirmed five major amphibian diseases within ANP: ranavirus, chytridiomycosis (Bd), Ichthyophonus, Saprolegnia, and a Perkinsus-\ikc organism, but did not confirm suspected occurrences of Riberoia. Ichthyophonus, Bd, and Saprolegnia were relatively benign in our study, and may have natural controls in ANP. Although some amphibian populations in ANP experienced extensive die-off events caused by ranavirus and the Perkinsus-like organism, disease events do not seem to exacerbate natural breeding population fluctuations.
ACKNOWLEDGMENTS The success of this work relied upon the support and knowledge of many other people. Members of my doctoral committee were incredible mentors, especially Aram Calhoun who provided endless support, motivation, and feedback. Aram was, and is, a mentor for both life and career and her belief in me buoyed me through many hours of writer's block. Special thanks to David E. Green who completed all of the amphibian diagnoses over many long hours of labwork dissecting the over 500 amphibians I sent each year. Joyce Longcore remains an incredible mentor and navigator into the world of amphibian disease research and laboratory science. Katherine Webster continually helped me to keep the larger picture in view through the many details of this project. And many thanks to Bill Glanz for keeping my field work in context and making sure I was not trying to do too much at once. Many thanks to the resource management team at Acadia NP, especially D. Manski, B. Gawley, E. Seger, K. Sheehan, and K. Anderson, for their logistical support, advice, and use of the ANP work space during my four years at the Park. Special thanks to Bruce Connery at ANP who provided assistance and moral support throughout this project. Many people beyond my committee members extended advice with difficult parts of this work and methods new to me such as statistics, sampling methods, and chemical analyses, or offered historical Acadia NP data. Many thanks to all them, including T.R. Morley, J. Cunningham, M.B. Kolozsvary, K. Johnson, D. Oscarson, R. Baldwin, and Aram's wetland laboratory group. I am particularly grateful to Steve Norton for his time
iii
helping me to decipher the mysteries of biogeochemistry and to Bill Halteman who offered much needed statistical advice. I extend much gratitude to the many field technicians and volunteers who spent innumerable hours in the field with me, especially A.L.T. Arbo, R.M. Graves, R.K. Gahl, D. Kelly, A. Michaud, J. Morgan, V. Peacock, E. Twomey, and S. Walczyk. Special thanks goes to ALTA whose initials are probably on even more data sheets than mine. I am incredibly thankful to F. Jernigan who provided me a beautiful location to live during my three years of field work in Acadia NP and to C.A. and P. Goodman who shared their beautiful seaside space in which to finish this writing. Many thanks for the continued support of my parents and sisters, who were with me when I caught my first amphibians. Most importantly, I am incredibly grateful to D. Kelly who allowed me the space and time to pursue this dream, this work truly gained from his insight, motivation, and belief in me. Funding for this work came from many generous sources including: the Eastern National Robert Utley Research Grant Program, Declining Amphibian Populations Task Force Seed Grant, Norcross Wildlife Foundation AV Stout Fund, USGS- Amphibian Research and Monitoring Initiative, New England Society of Wetland Scientists, Maine Association of Wetland Scientists, the National Science Foundation (DEB-0415348), Nestle Waters of North America, the University of Maine Graduate School, Association of Graduate Students, and the Department of Plant, Soil, and Environmental Sciences. The American Association of University Women generously supported me with an American Fellowship during manuscript preparation.
TABLE OF CONTENTS
ACKNOWLEDGMENTS
iii
LIST OF TABLES
viii
LIST OF FIGURES
x
LIST OF PLATES
xii
1. LANDSCAPE SETTING AND THE RISK OF RANA VIRUS MORTALITY EVENTS INTRODUCTION
1
METHODS
3
Site Description
3
Amphibian Disease History and Wetland Selection
6
Spatial Analysis
7
Landscape Model
10
Amphibian Monitoring
14
RESULTS
15
Landscape Model
15
Model Accuracy and Amphibian Monitoring Results
18
DISCUSSION
19
CONCLUSIONS
25
v
2. MULTIPLE EMERGING INFECTIOUS DISEASES OF AMPHIBIANS AND POTENTIAL STRESSORS IN ACADIA NATIONAL PARK WETLANDS. INTRODUCTION
27
METHODS
30
Site Description
30
Amphibian Disease History and Wetland Selection
32
Amphibian Monitoring
34
Historical records
34
In-field health screening
35
Intensive disease screenings
36
Potential Stressors
36
Physical stressors
37
Chemical stressors
38
Biological stressors
40
Statistical Analysis of Potential Stressors RESULTS
41 44
Amphibian Health and Disease Screenings
44
Analysis of Within-Pond Stressors
50
Chemical Analyses
56
VI
DISCUSSION
64
Disease Ecology
64
Ranavirus
64
Batrachochytrium dendrobatidis
67
Ichthyophonus
73
Perkinsus-Xike, organism Saprolegnia
75 78
Potential Within-Pond Stressors
79
Fluctuations or Declines in ANP?
83
CONCLUSIONS AND MANAGEMENT RECOMMENDATIONS
LITERATURE CITED
84
88
APPENDICES
106
Appendix A
106
Appendix B
108
Appendix C
Ill
Appendix D
114
Appendix E
118
Appendix F
120
Appendix G
123
BIOGRAPHY OF THE AUTHOR
125
Vll
LIST OF TABLES Table 1.1. Landscape attributes included in the analysis of disease occurrence
8
Table 1.2. Landscape features of disease and non-disease wetlands used in model building
11
Table 1.3. Highest-ranked logistic regression models for predicting amphibian disease occurrence in ANP breeding pools
16
Table 1.4. Relative importance of individual parameters in models incorporating spatial autocorrelation
17
Table 1.5. Classification matrix for HCP + NEAR Model
17
Table 1.6. Mean water chemistry from 5 MCP and 5 HCP sites in June 2006
22
Table 2.1. Pearson correlation matrix
51
Table 2.2a. Relative importance of individual parameters correlated with Ranavirus-caused die-off events in ANP breeding ponds
55
Table 2.2b. Relative importance of individual parameters correlated with die-off events caused by the Perkinsus-like organism
55
Table A.l. Characteristics of 16 monitored sites (2003-2005) and 8 known disease sites (1999-2001)
107
Table B.l. Highest-ranked logistic regression models for predicting amphibian disease occurrence in ANP breeding pools, without accounting for spatial autocorrelation
109
Table B.2. Relative importance of individual parameters without accounting for spatial autocorrelation
110
Table C.l. Landscape features of model building wetlands by catchment position
112
Table C.2. Landscape features of model test wetlands by catchment position
113
viii
Table D.l. Amphibian diseases confirmed and suspected in Acadia National Park wetlands
115
Table E.l. Summary statistics of site physical, biological, and chemical attributes
119
Table F.l. Highest-ranked logistic regression models correlated with ranavirus die-off events
121
Table F.2. Highest-ranked logistic regression models correlated with Perkinsus-\\ke, organism die-off events Table G.l. Water chemistry in six primary wetlands, 2004-2005
IX
122 124
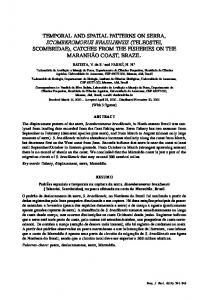
LIST OF FIGURES Figure 1.1. Spatial distribution of wetlands used for model building and model test sites for predicting amphibian disease occurrence in Acadia National Park, Maine, USA
4
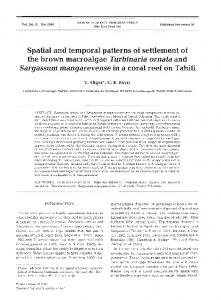
Figure 2.1. Species and stages of amphibians infected by the four major diseases
45
Figure 2.2. Amphibian die-off events caused by ranavirus in Acadia National Park, Maine, USA, during 2000-2006, shown by species
45
Figure 2.3. Relative difference in the duration of R. catesbeiana and R. sylvatica die-off events in two ANP wetlands in 2004
47
Figure 2.4. Composite number of infected amphibians observed 2003-2005, shown by month of capture
47
Figure 2.5. Factor loadings plots for principal components analysis for: (a) biological stressors, (b) physical stressors, (c) chemical stressors
53
Figure 2.6. Incidence of ranavirus (RV) in water with different conductivity (/xS/cm) in all monitored sites (n=26), 2004-2005, shown on the log scale
57
Figure 2.7. Incidence of ranavirus (RV) and closed-cell pH in all breeding wetlands, 2004-2005
58
Figure 2.8. Mean breeding season temperature in ranavirus-affected and non-ranavirus-affected wetlands, 2003-2005
58
Figure 2.9. Total aluminum (/Jg/L) in the six intensive sites for three sample periods in 2004 and 2005
60
Figure 2.10. Example water chemistry from six intensive sites from three sample periods in 2004 and 2005 X
61
Figure 2.11. The relationship of total aluminum (/xg/L) and DOC (mg/L) in six intensive wetland sites over three sampling periods in 2004 and 2005
62
Figure 2.12. Water chemistry in WMRN over three sample periods in 2004 and 2005
63
Figure 2.13. Number of Rana sylvatica egg masses in Otter Vernal Pool, Acadia National Park, Maine, USA, from 2000-2006
68
Figure 2.14. Air temperature in ANP during P. crucifer breeding, 2003-2005
70
Figure 2.15. Water temperature in BUBM, a Ztaf-infected site, during P. crucifer breeding, 2004, Acadia NP, Maine, USA
71
Figure 2.16. Acidity in 5d-infected sites, during P. crucifer breeding, 2004
72
Figure 2.17. Summer understory air temperature in ANP 2003-2005
74
XI
LIST OF PLATES Plate 2.1. Perkinsus-like organism infection of a Rana catesbeiana larvae, exhibiting massive enlargement of the abdomen
xii
77
1. LANDSCAPE SETTING AND THE RISK OF RANAVIRUS MORTALITY EVENTS INTRODUCTION Although many amphibian populations worldwide have declined due to easily understood ecological reasons such as overexploitation, habitat loss, and introduced species (Collins and Storfer 2003), the causes of many larger scale declines remain enigmatic (Lehtinen and Skinner 2006). Enigmatic declines may be caused by disease or multiple sublethal stressors, such as contaminants or changes in precipitation and temperature patterns, that can act singly or in concert with each other (Carey et al. 1999, Collins and Storfer 2003, Sparling et al. 2003). Amphibian mortality events in relatively pristine and protected settings cause particular concern because they may be linked to larger scale, off-site factors that interact with local landscape features (Young et al. 2001, Lips et al. 2003, Hero and Morrison 2004, Woodhams and Alford 2005, Drew et al. 2006). While we have some understanding of the landscape features of amphibian declines caused by chytridiomycosis and watermold infections, little is known about the landscape features associated with Ranavirus epizootics, even though Ranavirus mortality events have been widely reported in the literature (Bollinger et al. 1999, Green et al. 2002, Docherty et al. 2003, Greer et al. 2005). Unlike fungal and watermold infections that can cause declines, Ranavirus typically causes population fluctuations in host populations, but not necessarily extirpations (Collins et al. 2003) unless complicated with other stressors, such as habitat loss. In addition, Ranavirus mortality events may reoccur in subsequent years, or may not occur every year in a given "disease" wetland
1
(Carey et al. 2003). Because epizootics can be regular occurrences and host populations do not disappear, Ranavirus mortality events can be documented in one area over longer time periods and repeatedly in infected sites. Identification of /faftavz'rws-infected populations can be difficult. Amphibians in a wetland may or may not exhibit infection in a given year. Even when present in a population, Ranavirus can be difficult to identify by visual inspections of live amphibians because it infects the liver, and infected larval and metamorphic amphibians can die with no obvious external signs of infection (Daszak et al. 1999). Ranavirus mortality events can occur without precedent, affect multiple amphibian species at a site, and cause death rates regularly exceeding 90 percent (Green et al. 2002). Ranavirus can remain infectious in water for up to two weeks (Jancovich et al. 1997) and may be spread by transport of infected sediment (Harp and Petranka 2006). In addition, Ranavirus has been observed in potential vectors such as adult amphibians (Zupanovic et al. 1998, Brunner et al. 2004) and fish (Mao et al. 1999), but in general, the intermediate hosts or resting stage of Ranavirus are not well understood. For conservation and disease containment efforts, it is essential to be able to identify potentially high risk sites and take precautionary measures, such as amphibian population monitoring and equipment disinfection. Predictive models based on landscape features have been widely used in epidemiology to map sites of potential disease outbreak (Hess et al. 2002, Ostfeld et al. 2005). Because Ranavirus mortality events are widespread and affect multiple species in different biotic landscapes, a predictive model based on abiotic landscape features and landscape position to identify wetlands at risk is an important first step for conservation and disease control efforts.
2
In this paper, we examine potential links between landscape features and Ranavirus mortality events in the northeastern United States. We developed a predictive model to identify sites with the potential for amphibian mortality events through observations from 60 small amphibian breeding wetlands monitored in Acadia National Park, Maine, USA, during 1999-2001. Of these sites, eight experienced larval mortality events during that monitoring period. We then field tested the model with 16 sites we monitored for disease occurrence during 2003-2005. Explicitly, we determined landscape features that differentiated wetlands that experience periodic mortality events from those wetlands that have maintained healthy amphibian breeding populations, and provide the first clear connection between landscape features and Ranavirus susceptibility.
METHODS Site Description Acadia National Park (ANP) is located on Mount Desert Island, Maine, USA (Figure 1.1a) at the southern limit of the spruce-fir northern hardwoods zone. Surrounded by the ocean, the elevation in ANP ranges from sea level to 500 m. Topography is rugged and characterized by short, often steep, watersheds, which contain numerous small brooks and streams that drain to the ocean (Calhoun et al. 1994). The mountains were glacially carved and therefore trend north-south with intervening U-shaped valleys. Wetlands occupy 20 percent (12,847 ha) of Mount Desert Island. Because of the often foggy coastal conditions and a plethora of sphagnum peatlands and coniferous forests, aquatic ecosystems tend to be acidic to circumneutral, pH 4-7 (Calhoun et al. 1994). The eastern side of ANP has more wetland area than the western side, an artifact
3
Figure 1.1. Spatial distribution of wetlands used for model building and model test sites for predicting occurrence in Acadia National Park (ANP), Maine, USA. (a) Model test sites and disease histor 2001, (b) predictions of disease occurrence in 16 model test sites, and (c) actual disease occurre sites, 2003-2005.
of a 1947 human-caused fire that resulted in beaver recolonization. Post-fire (1947-1997) beaver increased the number of ponded wetlands by over 89 percent (Cunningham et al. 2006). Deciduous trees (Acer rubrum, Populus spp., Quercus rubra) dominate the eastern side of ANP that burned in 1947, whereas the western side of the Park is predominantly spruce-fir coastal forest (Picea rubens, Picea glauca, Abies balsamea) with extensive Sphagnum spp. groundcover and lichen. Upland areas throughout are characterized by thin, granitic soils or exposed granite, while wetland areas have rich, organic soils (Gilman et al. 1988). Annual precipitation averages 100-160 cm (NADP, National Trends Network, Site ME98) and average temperatures range from -10 to 25 C (National Weather Service, National Oceanic and Atmospheric Administration, NOAA), creating a relatively cool and humid climate. Wet precipitation is acidic, with precipitation-weighted mean pH ranging from 4.34-4.94 during 1999-2005 (NADP, National Trends Network, site ME98). Deposition is also influenced by the often foggy coastal conditions contributing moisture with very low pH, sometimes < 3.3 (Jagels et al. 1989). Major storms and weather systems in the Acadia region originate in the industrial states in the Midwestern USA. These systems bring contaminants from industrial activities (e.g., Hg, SO2, NOx) that are deposited as dry (contaminants deposited from wind and cloud particles) and wet (rain, fog, and snow) deposition (Driscoll et al. 2001). Predominant summer winds are from the west/southwest and the dry deposition from these western winds deposits as much, if not more, contamination than the wet deposition to Acadia's landscape (Norton et al. 1997). The high elevation of mountains in ANP relative to the surrounding
5
landscape may also enhance deposition by intercepting air masses that traverse the Maine coast (Jagels et al. 1989, Ito et al. 2002). Direct human disturbance within Acadia National Park, such as roads, chemical inputs (pesticide, herbicide, fertilizer), or habitat degradation, is limited. Though the Park boasts numerous visitors (> 2 million/year), most wetlands are isolated from trails and human visitation.
Amphibian Disease History and Wetland Selection In previous work (Cunningham 2003, Kolozsvary 2003), amphibian breeding ponds of varying hydrology in ANP were monitored for amphibian population research (1999-2001). Researchers observed amphibian larval mortality events in eight wetlands during that time, whereas larvae at the remaining sites were apparently healthy (B. Connery, Acadia National Park, personal communication, Figure 1.1a). Most mortality events were attributed to Ranavirus spp., a viral disease of amphibians that affected larvae of four amphibian species in ANP: bullfrogs (Rana catesbeiana, Shaw), green frogs (Rana clamitans, Latreille), wood frogs (Rana sylvatica, LeConte), and spring peepers (Pseudacris crucifer, Wied-Neuwied). Another die-off was caused by an unknown protozoan pathogen in wood frog larvae, and one was attributed to Ichthyophonus affecting bullfrog and green frog larvae (D. E. Green, USGS-National Wildlife Health Center, personal communication). We used 60 of the originally monitored wetlands (Figure 1.1a), including those with historical observations of disease, to develop a set of logistic models predicting disease occurrence. We reserved another 16 wetlands to test the best approximating
6
models (Figure 1.1b). We used stratified random sampling to select these 16 test sites based on disease history within the wetland and in nearby wetlands, amphibian species present, amphibian abundance, and hydroperiod (Appendix A). For ease of monitoring, we selected sites in eight small watersheds; three of which had no history of disease and five with at least one wetland with prior disease history. We continued to monitor disease occurrence at the 16 test sites during 2003-2005.
Spatial Analyses Landscape attributes (Table 1.1) included physical features (wetland area, perimeter, elevation, percent slope, position in catchment, aspect, catchment size, fire history), hydrologic connectivity (presence of inlets and outlets), and biological connectivity (nearby waterbodies within 500 m and 1000 m). We used ArcGIS (ESRI Inc., 1999-2004) to calculate all landscape attributes and wetland area. Data layers included National Wetlands Inventory (NWI) maps (1992, U.S. Fish and Wildlife Service National Wetlands Inventory), digital elevation models (DEM, 1:24000 scale, U.S. Geological Survey, USGS 1990), streams (obtained from the Acadia National Park GIS Laboratory), watersheds of Mount Desert Island (ANP GIS Laboratory), 1947 fire coverage (ANP GIS Laboratory), outline of Mount Desert Island (ANP GIS Laboratory), and site locations. We projected all data in Universal Transverse Mercator (UTM, NAD83). Aspect and percent slope (ASP, SLP) maps were computed using the raster DEM data layer and ArcGIS spatial analyst functions. Elevation (ELEV) was determined from
7
Table 1.1. Landscape attributes included in the analysis of disease occurrence. Parameter
Abbreviation
Expected relationship!
Related Processes
ASP
+
Dry deposition from prevailing west winds may encourage chem acidification), (Weathers et al. 2000)
ELEV
+
Increasing atmospheric influence at higher elevation (Ito et al. 20 2006).
Catchment Size
CATCH
+/-
Watershed size may define the amount of surface water flow to a influencing water chemistry.
Wetlands 500m
WET500
+
Increased opportunity for vectors to introduce disease, and move borne disease. Average Rana sylvatica migration distance (Howa Berven & Grudzien 1990).
Wetlands 1000m
WET 1000
+
Increased opportunity for vectors to introduce disease, and move borne disease. Average Rana catesbeiana migration distance (Ra Semlitsch and Bodie 2003).
AREA/ PER
+/-
The relationship of wetland size to disease occurrence is unclear headwater wetlands may be more susceptible.
Catchment Position
CP
+
Wetlands with a higher catchment position will have more atmos water chemistry (Ito et al. 2002).
Percent Slope
SLP
+/•
Percent slope may affect both vector movement and surface and
Inlet
INL
+/•
Proportion of groundwater versus surface water and precipitation depending on substrate and landscape position.
OUT
-
Wetlands with no outlet are likely to have more concentrated che as water evaporate (i.e. acidity, DOC, salts, drying).
Fire
FIRE
-
Unburned areas of the park are dominated by spruce-fir forests, w from canopy processing (Cronan and Reiners 1983).
Nearest Disease Wetland
NEAR
-
Disease presence in nearby wetlands may increase the probabilit movement between wetlands (Hess 1996).
Aspect Elevation
00
Area/Perimeter
Outlet
t Parameters with both +/- have unclear expected relationships from the primary literature.
the DEM data layer. Area and perimeter (AREA, PER) were obtained from NWI polygons corresponding with the area of spring standing water. We used a GIS coverage delineating the extent of the 1947 fire to classify sites into a binary FIRE variable (burned, unburned). The percentage of wetlands within both 500 m and 1000 m (WET500, WET 1000) of a site was determined using the sites polygon and NWI map. These distances represent average migration distances for two potential adult amphibian disease vectors (Daszak et al. 2004, Greer et al. 2005): wood frogs, 500 m (Howard and Kluge 1985, Berven and Grudzien 1990), and bullfrogs, 1000 m (Raney 1940, Semlitsch and Bodie 2003), although both longer (Ingram and Raney 1943, Berven and Grudzien 1990) and substantially shorter (Regosin et al. 2003) migration distances have been documented. Migration distance layers were created using the ArcGIS buffer wizard, and the percentage of wetlands within each distance (500 m, 1000 m) was then calculated by summing all clipped wetland areas within each distance. Inlet and outlet (INL, OUT) were determined using contour maps, site locations, streams layers, and NWI layers. We created a 20 m contour map from the DEM using ArcGIS Spatial Analyst. Inlets and outlets were identified by intersecting the streams with the site polygons. INL and OUT were treated as separate binomial variables for statistical analysis. Study wetlands were classified into one of three classes for catchment position by visual inspection of the above data layers and the ANP watersheds layer using the ArcGIS measure tool. The mean watershed size in ANP is 268 ha, although watersheds on Mount Desert Island range from 23-1380 ha. Headwater wetlands at high catchment
9
position, HCP, were in the top third of a hydrologic flowpath. Middle catchment position wetlands, MCP, were located within the middle third of a flowpath, usually with upstream and downstream waterbodies. Low position wetlands, LCP, were in the lowest third of the flowpath and typically had large surface water flows. Catchment size (CATCH) for each wetland was delineated using the contour maps, streams layer and site locations. With the ArcGIS distance tool, we measured distance (m) to the nearest die-off wetland (NEAR) as the horizontal distance from each wetland to the nearest disease-affected wetland.
Landscape Model We developed 28 candidate models of landscape features a priori and used logistic regression to determine the probability of disease occurrence (SYSTAT Version 11.00.00, Systat Software, Inc., 2004). The data set for model building included 60 amphibian breeding wetlands that were monitored in ANP from 1999-2001, including the eight disease sites. The binary response variable was observation of a disease-related mortality event in a given wetland (0=sites that had no historical disease events, l=sites that had one or more disease events). For the purposes of this study, we defined a mortality event as any die-off event involving >10 animals that we could attribute to disease by clinical signs, histology, or culture. For this analysis, mortality events observed at each site across all study years (1999-2001) were pooled, and landscape variables were assumed to be stable from year to year. Landscape predictor variables included AREA, PER, ASP, SLP, ELEV, CP, CATCH, WET500, WET1000 and FIRE (Table 1.2).
10
Table 1.2. Landscape features of disease and non-disease wetlands used in model building.
No. of sites No. HCP wetlands No. MCP wetlands No. LCP wetlands No. wetlands with inlet No. wetlands with outlet No. of burned sites Area (m2) Perimeter (m) Catchment size (ha) Wetlands within 500m (%) Wetlands within ' 1000m (%) Aspect Elevation (m) Percent slope Nearest Disease Wetland (m)
Non-Disease Mean/Total Range 52 3 18 31
Disease Mean/Total Range 8 6 1 1
31
2
39 39 12839 413 33.1
165-154267 55-2342 0.3-298.1
3 6 6185 278 8.5
327-35709 73-986 0.6-34.7
11.2
0.2-39.7
7.6
1.7-12.5
9.8 200 54 11.3
0.6-35.1 10-357 5-127 3.2-44.0
13.0 224 76 8.8
4.6-33.9 25-341 24-144 0.7-18.5
1573
148-4599
3162
579-6231
11
We assumed that all sites had been exposed to disease because of the proximity of disease sites to sites that had not experienced mortality events and because of the frequent movement of adult amphibians from wetland to wetland. We also assumed that the most abundant pond-breeding anuran species in ANP (green frogs, bullfrogs, wood frogs, and spring peepers) were equally susceptible to disease, based on historical disease occurrence data and observation (D. E. Green, NWHC, personal communication). Because logistic regression assumes normal distributions of predictor variables, we tested normality using visual (box plots, normality plots) and nonparametric methods (Lilliefors). To meet the assumptions of normality, we log]0 transformed (SLP), squared (ASP), ranked (AREA) and square root transformed (CATCH, WET500, WET1000, NEAR) variables. We used a dummy variable to represent CP, because logistic regression requires no more than two categories for categorical variables (HCP, MCP). We assessed multicollinearity among predictor variables with Pearson correlation matrices, scatterplot matrices and tolerance values for parameters (Quinn and Keough 2002). The variables PER and WET1000 were dropped from further analysis because of their high correlation with AREA and WET500, respectively. Because the goal of modeling was to predict disease occurrence and not to determine cause and effect, other correlated variables were left in the modeling because of their unique biological importance and because tolerance values were > 0.2, the threshold for inclusion. Models were evaluated using Akaike's Information Criterion (AIC) corrected for both small sample sizes and overdispersion, QAICc, c= 2.41, (Burnham and Anderson 2002). We assessed the relative importance of individual landscape features by summing Akaike weights of all models in which a feature occurred, normalized across the variable
12
set (Burnham and Anderson 2002, Stoddard and Hayes 2005). Attributes with an importance weight >0.2 were considered substantial (after Stoddard and Hayes 2005). Recent publications have stressed the role of spatial autocorrelation, such as the clustering of sites with similar characteristics in the landscape, in confounding results of landscape models (Knapp et al. 2003, Hoeting et al. 2006). To identify potential clustering of disease sites and the ease of disease vector movement to nearby sites, we accounted for spatial autocorrelation by incorporating distance (m) to the nearest disease wetland (NEAR) in a second set of models. We again developed 30 a priori models, some including NEAR, and compared models using AIC corrected for both small sample sizes and overdispersion (QAICc, c= 3.93). Although AIC is useful in evaluating which models are better at predicting response variables, AIC does not indicate predictive power (Hobbs and Hilborn 2006). Testing models for accuracy is an integral part of confirming whether a model is valuable for developing conservation and management strategies. We assessed the prediction success of the models with reclassification techniques and field testing of predictions. For reclassification, we calculated the logit prediction for all 60 sites used in modeling with the coefficients from the best approximating logistic models. We then categorized each site as disease or nondisease based on logit calculations and compared the classification to the known disease history (1999-2001). In addition, we field tested the highest ranking models in the set using 16 wetlands that we monitored for disease occurrence during 2003-2005. Using model coefficients from the best approximating logistic models, determined from the QAICc comparisons, we categorized each test site as potential
13
disease or nondisease. Predictions were then analyzed by comparison to the 2003-2005 disease occurrence field results.
Amphibian Monitoring Six anuran species are present in ANP wetlands, with bullfrogs, green frogs, wood frogs, and spring peepers being most common. Also present, but in smaller numbers, are pickerel frogs (Rana palustris, LeConte) and American toads (Bufo americanus, Holbrook). Common pond-breeding caudatal species include spotted salamanders (Ambystoma maculatum, Shaw), eastern newts (Notophthalmus viridescens viridescens, Rafinesque), and four-toed salamanders (Hemidactylium scutatum, Temminck and Schlegel). Although the caudal species may occupy the same breeding pools as the four common anurans, no pond-breeding caudal species, toads or pickerel frogs have been involved in observed mortality events in ANP. We monitored 16 wetlands reserved for model testing during 2003-2005 using visual encounter surveys (VES) and dipnetting (Heyer et al. 1994, Thorns et al. 1997) to screen individuals of all life stages for indicators of disease (e.g., loss of righting reflex, lethargy, ulcerations or sloughing of the skin). VES were conducted by walking the perimeter of each site for metamorphic and adult amphibians and dipnetting for larvae, screening at least 15-20 larvae from each site. We completed VES health screenings three times a week in each breeding pool from breeding through larval metamorphosis because amphibian carcasses decompose quickly in aquatic environments, sometimes in less than 24 hours (M. K. Gahl, personal observation). We shipped sick or dead animals overnight
14
delivery to the National Wildlife Health Center (NWHC) for dissection and diagnosis by histology and viral, bacterial, and fungal cultures. Ranavirus can potentially spread through transport of sediment (Harp and Petranka 2006) or water (Jancovich et al. 1997). To ensure no disease transmission among study sites from researchers or equipment, we disinfected all equipment with 10 percent bleach solution and allowed equipment to air dry before repeated use. All known disease wetlands were outfitted with a dedicated pair of waders left on site, and all sites were equipped with a dipnet reserved for use only in that wetland.
RESULTS Landscape Model High catchment position (HCP) was present in all ten of the highest ranked logistic regression models from the AIC comparisons (Appendix B). There was little evidence for any other variable as an effective predictor of disease occurrence. In fact, unless a variable was paired with HCP, it was not present in the set of best approximating models. Based on relative importance weights across the set of models, HCP was the most influential variable (ZWJ = 0.89) for predicting disease events (Appendix B). When nearest disease wetland (NEAR) was included in models to account for spatial autocorrelation, HCP was retained as a variable in the nine highest ranked logistic regression models from the AIC comparisons (Table 1.3), again demonstrating its substantial influence on disease occurrence in ANP. HCP and NEAR were in the two best models, and both had the highest relative importance weights (Table 1.4). Contrary to our predictions, the relationship of disease occurrence to NEAR was positive, therefore, a
15
Table 1.3. Highest-ranked logistic regression models for predicting amphibian disease occurrence in ANP breeding pools, incorporating spatial autocorrelation (Nearest Disease Wetland). The relationship of each variable to disease occurrence is shown in parentheses. For clarity, only models with evidence ratio 5-10 carcasses found in one visit) were primarily associated with ranavirus (Figure 2.2). One intensively studied site initially selected as a control experienced die-off events of/?, sylvatica and P. crucifer larvae caused by ranavirus in July of 2004 and 2005. Ranavirus (RV) infections were primarily in larval stage amphibians (83%), although we detected sublethal infections in two R. clamitans adults and two R. clamitans juveniles in one wetland that had experienced a die-off event. We did not detect ranavirus in amphibian eggs. Ranavirus infection occurred in all amphibian species that we monitored from 2003-2005 (Figure 2.1). Of all infected amphibians, P. crucifer
44
Figure 2.1. Species and stages of amphibians infected by the four major diseases, Ranavirus (RV), Batrachochytrium dendrobatidis (Bd), Perkinsus-like organism (PLO), and Ichthyophonus (ICH) in Acadia National Park, Maine, USA, from 2003-2005. The total number of individuals screened of each species and life stage is shown above each column.
Figure 2.2. Amphibian die-off events caused by ranavirus in Acadia National Park, Maine, USA, during 2000-2006, shown by species.
!
V 2
2000-02
2003-06 Monitoring years
45
accounted for 17%, R. catesbeiana for 26%, R. clamitans for 22%, and R. sylvatica for 35%. Including all years of die-off event records (2000-2005), R. sylvatica were more often affected by ranavirus than other amphibian species (46% of ranavirus-infected amphibians, 2000-2005). R. catesbeiana and R. clamitans die-off events were unlike dieoff events of R. sylvatica and P. crucifer. R. sylvatica and P. crucifer had > 90 percent mortality of larvae within a week of onset, whereas R. catesbeiana and R. clamitans dieoffs continued for weeks and ranavirus rarely caused complete mortality of tadpoles in a wetland (Figure 2.3). This difference is likely because ranavirus affects later Gosner stage tadpoles and R. catesbeiana and R. clamitans tadpoles spend two or more years in the breeding pond metamorphosing intermittently throughout the summer. Ranavirus was detected primarily in the summer months of June, July, and August (Figure 2.4), corresponding with the presence of larvae in the most affected Gosner stages (35-37+). Younger larvae in the same wetland appeared unaffected during a dieoff event (MKG, personal observation). Secondary infections of amphibians infected with ranavirus during 2000-2005 included Ichthyophonus (5), pinworms (25), and Riberoia-like metacercaria (3). Chytridiomycosis, (Batrachochytrium dendrobatidis, Bd) was observed in four wetland sites on the east side of ANP and all infections were detected in P. crucifer adults (Figure 2.1). No evidence of Bd was found in the larval stage of any amphibians. Detection was limited to April and May of each year (Figure 2.4) when P. crucifer adults are breeding and are congregated at breeding pools. Because they were slight, all infections were detected in the laboratory and not observed in the field at the time of
46
Figure 2.3. Relative difference in the duration of R. catesbeiana/R. clamitans and R. sylvatica die-off events in two ANP wetlands in 2004.
Figure 2.4. Composite number of infected amphibians observed 2003-2005, shown by month of capture.
47
capture. In addition, no evident declines or deaths of P. crucifer adults were observed, and large numbers of adults repeatedly returned to breeding ponds each year of this study (MKG, personal observation). One amphibian had a secondary infection of bacterial septicemia and others had no secondary infections. The Perkinsus-\ike organism caused mortality and morbidity in larvae in nine sites, and suspected infection in one additional site. Although individual animals died because of the Perkinsus-like organism we did not observe extensive die-off events caused by the Perkinsus-like organism at any site. All detected infections were observed in late Gosner stage larvae (92%) or recent metamorphs (8%), and adult frogs seemed unaffected. We observed infection in four amphibian species, R. clamitans (46% of Perkinsus-like organism-infected amphibians), R. catesbeiana (12%), P. crucifer (17%), and R. sylvatica (25%) (Figure 2.1). Detections were limited to June, July, and August (Figure 2.4), when amphibian larvae are active and nearing metamorphosis. Secondary infections included Ichthyophonus (2) and pinworms (6). We found Ichthyophonus in each of the six intensive sites and in tadpoles of all four target amphibian species (Figure 2.1). Although it has caused die-offs elsewhere (Mikaelian et al. 2000), we did not observe die-offs and infections in ANP amphibians appeared benign, even when heavy. Ichthyophonus was usually not obvious in the field except in very heavy infections and it was primarily detected by dissection and histology of animals sent for diagnosis as part of the intensive disease screenings or because of evident morbidity caused by other diseases. Of the animals examined, we detected Ichthyophonus in 52 amphibians, primarily in R. clamitans (51% of Ichthyophonus infected amphibians) and R. catesbeiana (28%), but also in P. crucifer (16%) and R.
48
sylvatica (5%). Most of the detections were from larval stage amphibians (60%), but Ichthyophonus was also detected in adult amphibians (23%) and juveniles and recent metamorphs (18%) where it was encysted where the tail had resorbed. Mid-summer was the most common time for detection of Ichthyophonus (Figure 2.4). Although in most Ichthyophonus infections it was the primary diagnosis, Ichthyophonus was a secondary diagnosis in four cases of ranavirus, three cases of coccidiosis, and one Perkinsus-\ike organism detection. Secondary infections associated with Ichthyophonus included renal metacercaria (8), pinworms (2), and gut nematodes (3). Riberoia (RIB) was suspected but not confirmed in R. catesbeiana, R. clamitans and P. crucifer adults and recent metamorphs in three wetland sites 2003-2005. Riberoialike metacercaria were also observed in R. catesbeiana larvae and recent metamorphs from two additional sites in 2001-2002. Over three years of monitoring we observed no malformations consistent with Riberoia as reported in other studies (Johnson et al. 2002), even in sites where Riberoia was suspected. Coccidiosis was a primary diagnosis for nine P. crucifer adults in four ANP sites in 2003. Two had secondary Ichthyophonus infections and animals were apparently unaffected by disease, behaving normally during capture. Fungal colonization of R. sylvatica egg masses was relatively widespread throughout ANP wetlands, although the estimated infection rate observed in the field was < 10 percent of eggs/mass (MKG, unpublished data). Fungal colonization of R. sylvatica eggs was observed in nearly every wetland with breeding R. sylvatica and we documented six fungal species from partial R. sylvatica egg masses in our six intensively studied ANP wetlands (2003-2005), including: Saprolegnia diclina, S.ferax, S. monoica,
49
S. megasperma, S. parasitica, Pythium sp. (M. K. Gahl and J. E. Longcore, unpublished data; David Green, personal communication). Saprolegnia was not cultured or observed in other amphibian egg masses with the exception of partial egg masses from one A. maculatum and one R. clamitans.
Analysis of Within-Pond Stressors Of the initial set of potential stressors (Appendix E), we discarded maximum dissolved oxygen and minimum color from further analyses because of their high correlation to minimum dissolved oxygen (r=0.794) and maximum apparent color (r=0.742), respectively. Because this analysis was largely exploratory, other correlated variables were left in the analyses because they addressed different potential stressors and correlations were not as high (Table 2.1). Principal components analysis resulted in two principal components each for chemical and physical variable groups and three principal components for biological variables (Figure 2.5). The two chemical principal components explained 73 % of the variation within the water chemistry data. CHEM1 was a gradient of acidity, from high pH, high dissolved oxygen and low apparent color ranging to low pH, low dissolved oxygen and high apparent color, with apparent color being the heaviest loaded variable. CHEM2 was a gradient of conductivity. We retained two principal components describing physical characteristics of wetlands that explained 66 % of the variance. PHYS1 was a gradient of canopy cover, the heaviest loaded variable, with canopy and shrub cover lowest when wetland area is greatest. PHYS2 was a gradient of high to low temperature, with both standard deviation of temperature and average temperature, and
50
Table 2.1. Pearson correlation matrix RASY breeding RACL breeding
Larval Density
Amphibian predators
Invertebrate predators
RASY breeding
1.000
RACL breeding
-0.184
1.000
Larval density Amphibian predators Invertebrate predators Mean temperature
0.451
-0.007
1.000
-0.115
0.525
0.141
1.000
-0.083
0.223
-0.232
0.218
1.00
0.057
0.514
0.379
0.607
0.28
SD temperature
0.019
-0.022
0.382
0.417
-0.06
Aquatic Vegetation
0.064
-0.012
0.127
0.076
0.17
Emergent Vegetation Area
0.145
0.348
-0.057
0.028
0.05
-0.043
0.522
-0.064
0.515
0.30
Shrub vegetation
0.140
-0.328
0.047
-0.423
0.05
Canopy Cover
0.083
-0.585
-0.155
-0.565
-0.18
Minimum DO
-0.067
-0.061
0.109
0.087
-0.26
Maximum color
0.266
-0.165
0.068
-0.056
0.28
Mean conductivity
0.341
-0.014
0.047
-0.261
0.20
Closed-cell pH
-0.286
0.336
-0.258
0.270
-0.02
Table 2.1. Pearson correlation matrix, continued.
SD temperat ure
Aquatic Vegetation
Emergent Vegetation
Area
Shrub vegetation
SD temperature
1.000
Aquatic Vegetation
0.197
1.000
Emergent Vegetation
-0.276
-0.341
1.000
Area
-0.090
-0.288
0.466
1.000
Shrub vegetation
-0.220
0.277
-0.176
-0.433
1.00
Canopy Cover
-0.209
0.202
-0.417
-0.721
0.60
Minimum DO
0.615
-0.221
-0.132
-0.041
-0.23
Maximum color
-0.119
0.477
-0.196
-0.233
0.45
Mean conductivity
-0.173
-0.108
0.389
0.184
0.13
Closed-cell pH
-0.077
-0.585
0.502
0.626
-0.53
Mean conductivity
Closed-cell p
MininlumDO
Maximum color
Minimum DO
1.000
Maximum color
-0.519
1.000
Mean conductivity
0.039
0.119
1.000
Closed-cell pH
0.195
-0.622
0.014
Figure 2.5. Factor loadings plots for principal components analyses on (a) biological, (b) physical, and (c) c Plots illustrate the weighting of each variable on each axis. Axes are defined by the variability of the data se in the text.
a. Biological variables.
b. Physical variables
1.0
c. Chemical
53
standard deviation of temperature being the heaviest weighted variable. Three principal components for biological variables explained 79 % of the variance. BIOl was a gradient from R. clamitans breeding and abundant adult amphibians that may act as larval predators to lower predator abundance and no R. clamitans breeding. BI02 was a gradient of larval density and BI03 a gradient of invertebrate predator abundance. We ran the logistic regression and AIC twice, once using the seven principal components and once using surrogate variables from the initial set of variables by selecting the highest loaded variable from each of the principal components (Appendix F). The most important predictor of ranavirus-affected sites was low conductivity (2.2a; Appendix Fl). AIC results for ranavirus-affected sites for both surrogate variables and for the principal components agreed that conductivity was the most important predictor, but they varied in interpreting the next two important variables. The next two important surrogate variables were standard deviation of temperature and maximum color (Table 2.2a). No other principal component variables were considered relatively important except for CHEM 2, which reflects conductivity (Table 2.2a). In the logistic regression models, however, none of the variables or principal components were a good predictor of ranavirus-caused die-off events because all had logistic regression p-values consistently > 0.05, and only conductivity had a p-value > 0.10. Therefore, although we were able to identify the best approximating models with AIC, none of these models were good predictors of ranavirus-related die-offs. For models associated with Perkinsus-like organism outbreaks, PHYS1 (canopy-, shrub- & area+) and BIOl (R. clamitans breeding+ & amph predator density+) were most important in predicting die-offs (Table 2.2b; Appendix F2), and the surrogate variables
54
Table 2.2a. Relative importance of individual parameters correlated with Ranaviruscaused die-off events in ANP breeding ponds. Surrogate variables are listed in order by relative importance weight and principal components are listed in the same order as their surrogate variables. Surrogate Variables Parameter Zwi§ Conductivity 0.33 SD temperature 0.21 Maximum color 0.20 RACL breeding 0.18 Invertebrate predators 0.17 Larval density 0.17 Canopy 0.17
Principal Components Swj§ Parameter CHEM2 0.42 PHYS2 0.17 CHEM1 0.18 BIOl 0.20 BI03 0.15 BI02 0.22 PHYS1 0.14
§ The importance weight (2WJ) of a parameter is the sum of Akaike weights from all candidate models which contain that parameter.
Table 2.2b. Relative importance of individual parameters correlated with die-off events caused by the Perkinsus-like organism in ANP breeding ponds. Surrogate variables are listed in order by relative importance weight and principal components are listed in the same order as their surrogate variables. Surrogate Variables Parameter Swi§ Canopy 0.32 RACL breeding 0.31 Maximum color 0.18 Invertebrate predators 0.18 Conductivity 0.18 SD temperature 0.16 Larval density 0.10
Principal Components IWj§ Parameter PHYS1 0.22 BIOl 0.52 CHEM1 0.16 0.10 BI03 CHEM2 0.15 PHYS2 0.15 BI02 0.21
§ The importance weight (SwO of a parameter is the sum of Akaike weights from all candidate models which contain that parameter.
55
analysis agreed. Both surrogate and principal component variables had logistic regression p-values < 0.05, suggesting they are relatively good predictors of Perkinsus-like organism incidence. Therefore, sites with Perkinsus-like organism outbreaks tended to be larger wetlands with little canopy or shrub cover and with populations of breeding R. clamitans and abundant adult amphibians that may depredate larvae.
Chemical Analyses Although no statistical differences in wetland chemistry were evident in our modeling, some general patterns were compelling. High conductivity sites, > 60 /xS, were typically non-disease sites, while sites affected by ranavirus and the Perkinsus-like organism tended to have much lower conductivity (Figure 2.6). Acidity exhibited the opposite pattern as conductivity (Figure 2.7), and sites with pH < 4.5 were more likely to be unaffected by ranavirus and the Perkinsus-like organism. Mean breeding season water temperature was also higher in sites affected by ranavirus (Figure 2.8). We observed no evident patterns of apparent color in ranavirus and Perkinsus-like organism affected sites, although overall, ANP wetlands were highly colored (Appendix E, G). As expected, dissolved oxygen (DO) levels and air and water temperatures rose dramatically throughout the day, peaking at 3 to 5 pm. DO decreased after dark, with many small wetlands reaching their lowest DO near 0 % just after dawn at 6 am. We expected pH to follow this same pattern because higher temperature and higher DO lower the amount of CO2 in the water and therefore the pH should rise. Surprisingly, pH did not fluctuate widely throughout the day, average standard deviation= 0.05. This is likely caused by the large amount of natural organic acids in ANP wetlands (mean color during
56
Figure 2.6. Incidence of ranavirus (RV) in water with different conductivity (/uS/cm) in all monitored sites (n=26), 2004-2005, shown on the log scale.
57
Figure 2.7. Incidence of ranavirus (RV) and closed-cell pH in all breeding wetlands, 2004-2005.
Figure 2.8. Mean breeding season temperature in ranavirus-affected and non-ranavirusaffected wetlands, 2003-2005. Box plots shown in dashed lines represent sites that were not ranavirus-affected and ranavirus-affected sites are shown in complete lines.
58
24 hr sample= 88 PCU) and naturally low pH (mean pH during 24 hr sample= 5.47), both of which indicate a natural buffering ability mitigating large fluctuations in acidity. As water volume in wetlands began to decrease over the summer months, pH, conductivity, temperature and apparent color increased. These increases were more dramatic in small temporary wetlands; water chemistry in wetlands with inlets or large permanent wetlands changed less dramatically over the breeding season. More comprehensive analysis of water chemistry in the six intensive sites exhibited some patterns meriting more detailed investigations. In ranavirus and Perkinsus-like organism affected sites, total aluminum and DOC tended to be higher and SO4 tended to be lower than in similar unaffected sites (Appendix G, Figures 2.9, 2.10a,b), although our sample size is too small for this correlation to be statistically significant. Total aluminum was higher in sites with pH < 5.6 and was correlated with higher DOC (Figure 2.11). Total aluminum was above reported toxic concentrations of inorganic monomelic aluminum in sites that experienced die-off events during our monitoring (Figure 2.9), but we did not examine how much of the total aluminum measured reflects bioavailable inorganic monomeric aluminum in these wetlands. In one intensively studied site, larval die-off events of R. sylvatica and P. crucifer were caused by ranavirus in July of 2004 and 2005. Examination of time-series data associated with this site yielded no acute changes in air temperature, pH, apparent color or conductivity that might have prompted a die-off event. Near the time of the die-off events Al, ANC, Na, and DOC had perceptibly risen and concentrations of SO4 had dramatically declined (Figures 2.12a, b). These fluctuations were accompanied by wetland dry down, and therefore could be attributed to increases in solute concentration,
59
Figure 2.9. Total aluminum (/ig/L) in the six intensive sites for three sample periods in 2004 and 2005 line represents aluminum toxicity level from other studies known to stress larval amphibians, though k aluminum toxicity in other aquatic species (fish) is much lower. EOCVP and WMRN both experienced events in 2004, and WMRN in 2005.
400
350
300
ON
o
250
200
150
100
50 -
4/19/2004
5/26/2004
7/14/2004
4/18/2005 Date
5/23/2005
7/11/200
Figure 2.10. Example water chemistry from six intensive sites from three sample periods in 2004 and 2005. SO4 (/xeq/L), (c) Ca (mg/L), and (d) ANC (/ieq/L). Ca and ANC are shown on two vertical axes, because lev in ELCR were much higher than in other sites. Site shown in dashed lines have experienced no apparent dise 2000-2006.
Figure 2.11. The relationship of total aluminum (/xg/L) and DOC (mg/L) in six intensive wetland sites over three sampling periods in 2004 and 2005.
62
Figure 2.12. Water chemistry in WMRN over three sample periods in 2004 and 2005. (a) cation chemistry, and, (b) anions, DOC, ANC, and air-equilibrated pH. Die-off events occurred around July 17-19 in 2004 and 2005.
63
evapoconcentration, as wetland volume decreased and are likely common to most sites drying down in that period (Figures 2.10a-d).
DISCUSSION Disease Ecology Ranavirus. The most common die-offs in ANP were caused by ranavirus and affected R. sylvatica populations in temporary or vernal pools. P. crucifer were often found along with R. sylvatica in die-off events, however, they metamorphose more slowly than R. sylvatica and their die-off events occurred a week or two later than mass R. sylvatica dieoffs in the same pool. We concur with Harp and Petranka (2006) that R. sylvatica, and potentially P. crucifer may act as amplifying hosts because an entire year's cohort attains metamorphosis about the same time in a given year, usually within a few days to a week. Because amphibian larvae are most susceptible to ranavirus in later Gosner stages and life stage is important for ranavirus virulence (Brunner et al. 2005), dramatic losses of an entire year's cohort can occur at the same time within a site. In contrast, R. catesbeiana and R. clamitans spend more than one season as larvae, and therefore individuals metamorphose intermittently throughout the summer months (June to August). Ranavirus-caused die-off events in populations of these latter two species in ANP reflected this prolonged period of metamorphosis and persisted for almost a month in some sites. As in other studies (Pearman et al. 2004, Harp and Petranka 2006), we noted that scavenging and cannibalism of carcasses was common and may be an easy way for infection to amplify throughout a cohort of intra- and interspecific larvae. We found no
64
evidence of ranavirus infections of eggs or early stage larvae, so amphibians must become infected during the larval stage; their proximity and penchant for cannibalism could serve as easy amplification for ranavirus throughout a population (Pearman et al. 2004, Harp and Petranka 2006). In addition, at one ranavirus die-off site, several leeches were attached to each sick R. clamitans and R. catesbeiana tadpole collected (up to 30 + per individual). These leeches might act as additional vectors or reservoir hosts for ranavirus within a wetland site. Although vertical transmission may not be a plausible route for the transmission of ranavirus to each tadpole during a die-off, because cannibalism is more rapid (Harp and Petranka 2006), vertical transmission as a primary means of introducing ranavirus to a pool cannot be ruled out in ANP. Our disease screening sample size of R. sylvatica adults from pools that experienced die-offs was too small to assess the possibility of vertical transmission to conspecifics and we did not find ranavirus in adult P. crucifer. However, R. catesbeiana and R. clamitans adults could be reservoir hosts and potential vectors for ranavirus to enter breeding sites. Because we cultured ranavirus from apparently healthy adult R. catesbeiana and R. clamitans that exhibited no external or behavioral signs of infection during capture, they could be unaffected by ranavirus but carry the disease. All these ranavirus-infected adults were captured from temporary wetlands with breeding R. sylvatica populations that had experienced die-off events caused by ranavirus in the previous summer. In addition, at least one capture in 2002 was within 100 m of a permanent wetland with breeding populations of R. catesbeiana and R. clamitans that experienced ranavirus-caused die-off events in 2003 and 2004. R. catesbeiana and R. clamitans may become infected with
65
ranavirus as adults after eating infected tadpoles, or may have lived through a die-off event as larvae and become carriers of the disease organism without observable effects as an adult. Both of these species readily move from one wetland to another in search of food (R.M. Graves and M.K. Gahl, unpublished data), which is usually the abundant tadpoles of R. sylvatica and P. crucifer (MKG, personal observation); ranavirus-infected larvae would be slower to flee and thus be easily depredated. Ranavirus could be introduced by R. catesbeiana or R. clamitans adults into an uninfected wetland through shedding of virus particles during spawning similar to what occurs with Lucke frog herpesvirus (Green and Converse 2005a, b). This means of transmission is worthy of further investigation because it would explain the occurrence of ranavirus in at least one R. catesbeiana and R. clamitans breeding site that is near the capture location of a ranavirus-infected adult R. catesbeiana. Although R. catesbeiana visit but do not breed in temporary wetland sites that host breeding R. sylvatica populations, ranavirus could be introduced into temporary wetlands through spawning of R. clamitans, which breed in temporary pools in ANP even though they require permanent waters for larval success (MKG, personal observation). Unlike Lucke frog herpesvirus, which is transmitted from shedding of virus particles to embryos during breeding (Green and Converse 2005a, b), shedding of ranavirus would have to infect larval stage amphibians by being water borne. The infective potential of ranavirus in water has been demonstrated for R. sylvatica tadpoles (Harp and Petranka 2006) and for the closely related Ambystoma tigrinum virus, which can remain infective in water for up to two weeks (Jancovich et al. 1997).
66
ANP amphibian populations affected by ranavirus die-offs experience apparent short-term declines in numbers similar to what has been learned about the populationlevel effects of ranavirus on other amphibians (Jancovich et al. 1997, Bollinger et al. 1999, Petranka et al. 2003). Contrary to declines associated with other diseases, such as Bd (e.g., Berger et al. 1999, Young et al. 2001), R. sylvatica breeding populations appear to be rebounding after die-off events to pre-mortality event numbers (Figure 2.13). Ranavirus-caused die-offs do not seem to exacerbate natural population fluctuations, at least with R. sylvatica breeding populations that experience death rates > 90 percent. Worthy of further study is whether current rebounded populations are comprised of amphibians that have lived through a die-off event and returned to breed in following years or colonizers from nearby unaffected wetland sites. Ranavirus does not seem to cause complete loss of a cohort of longer lived species, such as R. catesbeiana and R. clamitans, and many larvae metamorphose successfully in die-off years. Continued monitoring of these populations would elucidate whether populations of longer-lived species affected by ranavirus experience short-term declines and rebounds as we have observed in R. sylvatica populations.
Batrachochytrium dendrobatidis. We found only slight Bd infections in P. crucifer adults during the course of this study and observed no evident declines or deaths of P. crucifer adults caused by Bd. Longcore et al. (2007) also found slight Bd infections in R. catesbeiana adults in ANP. Other studies have demonstrated that mortality caused by Bd is species specific (e.g., Daszak et al. 2004). For example, although some adult amphibians die within 33 days of exposure (Berger et al. 1998), Rana catesbeiana,
67
Figure 2.13. Number of Rana sylvatica egg masses in Otter Vernal Pool, Acadia National Park, Maine, USA, from 2000-2006. Die-off events of R. sylvatica larvae caused by Ranavirus occurred in 2001 and 2002 just before larval metamorphosis.
68
which is native to ANP, develops only light infections and does not experience ill effects (Daszak et al. 2004, Hanselmann et al. 2004). Other amphibian species may be vulnerable to Bd but environmental conditions, particularly temperature, in the microhabitats that they occupy may inhibit Bd growth (Berger et al. 2004, Carey et al. 2006). Whether P. crucifer is one of the former or latter species is unknown. Bd zoospores are transmitted through water, although zoospores rarely remain active for more than 24 hours, and usually swim less than 2 cm from their origin (Piotrowski et al. 2004). Because P. crucifer move into the uplands after breeding and are presumed to be solitary (Hunter et al. 1999), the only time they transmit Bd to other conspecifics and to other amphibians may be when they are congregated at breeding pools. However, during P. crucifer breeding, the environmental conditions are not optimum for Bd growth or maximal zoospore production. Ideal environmental conditions for Bd are primarily determined by temperature and Bd will grow and reproduce at temperatures of 4-25 C with reasonably rapid growth at 10C and maximal growth at 17-23 C (Piotrowski et al. 2004). Die-off events, however, have occurred at temperatures ranging from 10-30 C. During P. crucifer breeding, late April through May in ANP, air temperatures typically remained lower than 17 C, and rarely stayed above 10 C for more than 12 hours (Figure 2.14). Water temperatures during that same time were rarely above 10 C for more than a few hours a day (Figure 2.15). These lower temperatures may slow growth and reproduction of Bd, but allow it to persist in ANP. Acidity may also influence Bd growth, although Bd can grow in a wide range of pH (4-8), with optimal growth conditions between pH 6-7 (Piotrowski et al. 2004). At the four breeding pools where Bd was
69
Figure 2.14. Air temperature in ANP during P. crucifer breeding, 2003-2005. Dashed lines are the minim temperatures observed in Bd-caused die-off events in other studies, the maximum bound is 30 C. The shad maximal growth temperature, at which Bd can most readily produces zoospores and infection.
4/10
4/14
4/18
4/22
4/26
4/30
5/5
5/9
Calendar date
5/13
5/17
5/21
Figure 2.15. Water temperature in BUBM, a 5