Journal of Mammalogy, 82(2):567–572, 2001
SPATIAL AND TEMPORAL PATTERNS OF AN IRRUPTING POPULATION OF DEER MICE JEFF BOWMAN,* GRAHAM J. FORBES,
AND
TIM G. DILWORTH
New Brunswick Cooperative Fish and Wildlife Research Unit, University of New Brunswick, Fredericton, New Brunswick E3B 6C2, Canada Present address of JB: Department of Biology, Carleton University, Ottawa, Ontario K1S 5B6, Canada
We assessed the spatial and temporal pattern and scale of an irruption by a population of deer mice (Peromyscus maniculatus) in the summer of 1997 in New Brunswick, Canada. We tested the prediction that spatial scales finer than the extent of the irruption would not reveal domains of population growth. Increases in the abundance of mice were seen across an extensive set of study grids (separated by .15 linear kilometers); however, growth rates were autocorrelated spatially over short distances (,300 m). The extensive irruption may have been a result of finer-scale irruptions occurring simultaneously. Key words: synchrony
domain, hierarchy, irruption, Peromyscus maniculatus, scale, spatial autocorrelation,
An understanding of the spatial and temporal scale of population dynamics can give us insight into processes that contribute to the dynamics (Steen et al. 1996). For example, populations can fluctuate in abundance synchronously over large regions, a phenomenon considered to be a response to some region-wide process (Moran 1953; Myrberget 1973; Ranta et al. 1995). Conversely, some populations exhibit finescaled variability in demographic parameters, a phenomenon that suggests the contribution of local, rather than regional, processes (Bowman et al. 2000; Krohne and Burgin 1990; Montgomery 1989). Studies that demonstrate either broad synchrony or finer variability in spatial population dynamics often are unable to detect if populations exhibit levels of organization at other scales (Steen et al. 1996). This is due, in part, to the infrequent use of crossscale research designs. Although researchers studying small mammals often use single scales of observation to explain spatial
population dynamics, multiple levels of spatial dynamics have been suggested (Goodwin and Fahrig 1998; Holling 1992). The deer mouse (Peromyscus maniculatus) is a noncyclic species that can occur at very high numbers in some years, likely in response to mast-crop production (Catlett and Brown 1961; Fryxell et al. 1998; Gashwiler 1979; Grant 1976; Herman and Scott 1984; Wolff 1996). One such irruption was observed during a study of the population ecology of small mammals in New Brunswick, Canada. The study used a set of nested grids, which gave us the opportunity to assess this irruption across a range of spatial scales. From conducting field work, the irruption was known to be widespread, much like a synchronous regional event. We expected the spatial domain of population growth to coincide with the extent of the irruption. Spatial domain refers to the area over which a process occurs (Holling 1992). Thus, we predicted that spatial scales finer than the extent of the irruption would not reveal domains of population growth.
* Correspondent:
[email protected] 567
568
JOURNAL OF MAMMALOGY
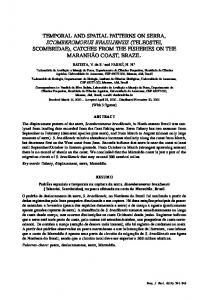
FIG. 1.—Layout of 3 study grids on a forest landscape in northwestern New Brunswick, Canada. Three nested scales were surveyed: A) 1,000-m grain, 8 by 8 points, 4,900 ha extent; B) 250-m grain, 8 by 8 points, 306-ha extent; C) 125-m grain, 5 by 6 points, 31 ha. Each survey point consisted of an array of 5 traps (inset). Topography of the site contributed to irregularities in the shape of the grids.
MATERIALS
AND
METHODS
Our study was conducted in the private industrial forest of Fraser Papers Inc. in the Appalachian forest of northwestern New Brunswick (478N, 678W). Upland sites were dominated by an overstory of sugar maple (Acer saccharum), yellow birch (Betula alleghaniensis), and American beech (Fagus grandifolia). Lowland sites were dominated by black spruce (Picea mariana), white spruce (Picea glauca), and balsam fir (Abies balsamea). We selected a 4,900-ha forested landscape that was managed with a low intensity for forest products (e.g., ,15% recent clear cuts or softwood plantations). A set of nested grids was used to sample the 4,900-ha landscape for small mammals (Fig. 1). The largest grid had a sam-
Vol. 82, No. 2
pling grain of 1,000 m and an extent of 4,900 ha (8 by 8; 64 points). Grain refers to the minimum distance between sample points, whereas extent refers to the area covered by the samples (Wiens 1989). Nested within the large grid was a smaller grid with a grain of 250 m and an extent of 310 ha (8 by 8; 64 points) and a 3rd grid with a grain of 125 m and an extent of 31 ha (5 by 6; 30 points). For sampling reasons, points were not established within 50 m of roads or water bodies; the topography of the area was uneven so some irregularities existed in the shape of the grids. At the top end, our choice of scales was a logistic one; we could not survey .4,900 ha. The finer scales were chosen for biologic reasons with the smallest of these finer than the dispersal scale of Morris (1992). At a site about 15 km north of these nested grids, another 8 by 8 grid (250-m grain, 310-ha extent) also was sampled for small mammals. Other aspects of the study design were described by Bowman et al. (2000). We trapped the sample points to estimate abundance of small mammals in spring and autumn beginning in autumn 1996. Five Victor Tin-Cat multiple-capture live traps (Woodstream Corp., Lititz, Pennsylvania) were used to survey each sample point. One trap was placed at point center, and 4 other traps were placed at each cardinal direction, 35 m from center (Fig. 1, inset). The 5-trap array was designed to survey a 50-m radius around each point. All traps were placed in positions most likely to have runways and were prebaited for 3 days with oats and sunflower hearts. Traps then were set for 4 consecutive nights. Therefore, a single point took 7 days to sample: 3 nights of prebaiting and 4 nights of trapping. The number of sampling points precluded us from trapping all the points simultaneously. Trapping on the largest grid (1,000-m grain) spanned 3 of the 7-day periods, whereas the smaller grids were trapped in 1–2 periods, and we assumed a negligible temporal drift in samples. Captured animals were weighed, identified to species and sex, checked for reproductive condition, marked with a 1-g monel ear tag (National Band and Tag Co., Newport, Kansas), and released. To study dynamics of the irruption of deer mice, we calculated capture rates of deer mice across all sites and trapping sessions to evaluate synchrony of the increase in abundance of deer mice. Next, we determined growth rates of pop-
May 2001
BOWMAN ET AL.—IRRUPTING POPULATION OF DEER MICE
ulations of deer mice for each sample point within nested grids. Growth rates were calculated for the period between sampling sessions (i.e., autumn trapping, winter growth period, spring trapping, summer growth period). Growth rates were calculated as: log10(10 1 Xt11) 2 log10(10 1 Xt), where X was the abundance of deer mice at each point (Steen et al. 1996). The 125-m-grain grid was not sampled in autumn 1996, so raw abundance data from spring 1997 were used as a surrogate for growth rates on that grid during winter 1996–1997. To test our prediction that spatial scales finer than the extent of the irruption would not reveal domains of population growth, determination of those spatial domains was necessary. Population growth is a contagious process, which should be autocorrelated positively in space (Legendre and Fortin 1989). We assumed that the distance of the positive autocorrelation indicated a spatial domain for the process (Legendre and Fortin 1989; Steen et al. 1996). Positive autocorrelation in population growth rates over distances much shorter than the extent of the irruption of deer mice would suggest that the irruption was an aggregate of finer-scale processes. We assumed that populations of deer mice were isotropic in their structure, and so we developed all-directional correlograms (Moran’s I—Legendre and Fortin 1989) to study patterns of spatial autocorrelation for species abundances in each of the 3 reference-area study grids (125-m, 250-m, and 1,000-m grains). Methods for developing correlograms and testing for significance followed those of Bowman et al. (2000). Briefly, the technique involved assessing the strength of correlations between a variable and its value lagged in space. Thus, the coefficient for Moran’s I was analogous to a Pearson r. In a correlogram, coefficients are calculated for each distance class simultaneously, so tests of significance required the Bonferroni correction (Legendre and Fortin 1989). Bonferroni-corrected significance suggests that the shape of the correlogram can be interpreted as important. Data analysis was conducted using S-Plus 2000 (MathSoft Inc., Seattle, Washington).
RESULTS In 23,820 trap nights during our study, we captured .7,000 small mammals, including .1,800 deer mice. Populations of deer mice underwent a several-fold increase
569
FIG. 2.—Relative abundance of deer mice captured on 4 different grids during a study in New Brunswick, Canada. Three nested grids differed in size: 125-m grain, 31-ha extent, 5 by 6 points; 250-m grain, 310-ha extent, 8 by 8 points; 1,000-m grain, 4,900-ha extent, 8 by 8 points. An adjacent grid was .15 linear kilometers to the north (250-m grain, 310-ha extent, 8 by 8 points). Trapping began in autumn 1996 and continued each spring and autumn until spring 1999.
in abundance and subsequent decline during the study (Fig. 2). The increase took place during summer 1997, and the decline during winter 1998. This irruption event was extensive, occurring synchronously across the entire study area, including an adjacent study site that was about 15 km to the north of the nested grids (Fig. 2). Analysis of structure functions demonstrated that during periods of low population change, growth rates were not autocorrelated at any of the scales that we studied. However, during the irruption of deer mice and during the subsequent summer (1998), population growth rates were autocorrelated positively over relatively short distances (Fig. 3). Only the 2 finest-scale grids exhibited any autocorrelation in growth rates. DISCUSSION We detected a synchronous increase in populations of deer mice across the entire study area, a spatial extent of .15 linear kilometers. The large-scale process was likely a climatic event that resulted in wide-
570
JOURNAL OF MAMMALOGY
Vol. 82, No. 2
FIG. 3.—Correlograms for growth rates of populations of deer mice on 3 nested grids in a continuously forested study area in New Brunswick, Canada. Grid dimensions were: 125-m grain, 31-ha extent; 250-m grain, 310-ha extent; and 1,000-m grain, 4,900-ha extent. Distances are in meters. Filled symbols indicate global correlogram significance; in those cases, the shape of the entire correlogram is considered to be significant.
May 2001
BOWMAN ET AL.—IRRUPTING POPULATION OF DEER MICE
spread production of seeds by mast-crop species. Wolff (1996) demonstrated that deer mice will exhibit winter breeding only after autumns with bountiful mast-crop production. We saw evidence of winter breeding during 1996–1997 (Fig. 2). This period of winter breeding may have contributed to the irruption during summer 1997. We have no direct measure of mast production, but winter breeding in itself is evidence of a good mast year the previous autumn (Wolff 1996). Mast-producing species in the study area included American beech and beaked hazel (Corylus cornuta). Although the irruption was extensive, populations of deer mice exhibited relatively fine-scale growth patterns. That is, population growth rates were autocorrelated over distances of ,300 m. This finding supports the idea that many population processes are local in effect (Krohne and Burgin 1990; Montgomery 1989). The locally distributed sites of population growth may correspond to subpopulations of deer mice. Subpopulations of deer mice in our continuously forested study area were small in spatial extent (,300 m—Bowman et al. 2000). Some of the fine-scale variation in growth patterns may have resulted from habitat heterogeneity. However, Bowman (2000) demonstrated that deer mice in the study area exhibit spatial population structure that is independent of vegetation patterns, and that occurs over short distances (,250 m). Thus, these populations of deer mice are not spatially correlated to vegetation patterns at a scale corresponding to the population growth that we measured (,300 m). The irruption of populations of deer mice in our study suggests an interesting dynamic. Deer mice irrupted over an extensive area (.15 linear kilometers), likely in response to some large-scale event (e.g., mast production). Yet, these mouse populations exhibited a domain of population growth over a relatively small spatial extent (,300 m). Thus, we envision a process whereby
571
the large-scale population irruption was actually an aggregate of a number of smallscale irruptions occurring simultaneously. ACKNOWLEDGMENTS We received funding for this study from a grant to A. W. Diamond by the Sustainable Forest Management Network. We also received funding from Fraser Papers Inc., the Sir James Dunn Wildlife Research Centre, Earthworks New Brunswick, a Natural Sciences and Engineering Research Council scholarship to J. Bowman, and a Natural Sciences and Engineering Research Council Synergy Award to G. J. Forbes. Cooperators on the project include S. Boutin, C. Corkum, A. W. Diamond, M. Edwards, J. Gunn, S. Hannon, P. McKinley, R. Moses, M.-A. Villard, and numerous field assistants. W. Ballard, H. MacPherson, and 2 anonymous reviewers made helpful suggestions on the manuscript. Parts of this manuscript were prepared using facilities of the Department of Range, Wildlife, and Fisheries Management, Texas Tech University. Our protocol for capturing and handling animals was approved by the University of New Brunswick Animal Care Committee.
LITERATURE CITED CATLETT, R. H., AND R. Z. BROWN. 1961. Unusual abundance of Peromyscus at Gothic, Colorado. Journal of Mammalogy 42:415. BOWMAN, J. 2000. The spatial structure of small-mammal populations in a managed forest. Ph.D. dissertation, University of New Brunswick, Fredericton, Canada. BOWMAN, J., G. FORBES, AND T. DILWORTH. 2000. The spatial scale of variability in small-mammal populations. Ecography 23:328–334. FRYXELL, J. M., J. B. FALLS, E. A. FALLS, AND R. J. BROOKS. 1998. Long-term dynamics of small-mammal populations in Ontario. Ecology 79:213–225. GASHWILER, J. S. 1979. Deer mouse reproduction and its relation to the tree seed crop. The American Midland Naturalist 102:95–104. GOODWIN, B. J., AND L. FAHRIG. 1998. Spatial scaling and animal population dynamics. Pp. 193–206 in Ecological scale: theory and applications (D. L. Peterson and V. T. Parker, eds.). Columbia University Press, New York. GRANT, P. R. 1976. An 11-year study of small mammal populations at Mont St. Hilaire, Quebec. Canadian Journal of Zoology 54:2156–2173. HERMAN, T. B., AND F. W. SCOTT. 1984. An unusual decline in the abundance of Peromyscus maniculatus in Nova Scotia. Canadian Journal of Zoology 62: 175–178. HOLLING, C. S. 1992. Cross-scale morphology, geom-
572
JOURNAL OF MAMMALOGY
etry, and dynamics of ecosystems. Ecological Monographs 62:447–502. KROHNE, D. T., AND A. B. BURGIN. 1990. The scale of demographic heterogeneity in a population of Peromyscus leucopus. Oecologia 82:97–101. LEGENDRE, P., AND M.-J. FORTIN. 1989. Spatial pattern and ecological analysis. Vegetatio 80:107–138. MONTGOMERY, W. I. 1989. Population regulation in the wood mouse, Apodemus sylvaticus. II. Density dependence in spatial distribution and reproduction. The Journal of Animal Ecology 58:477–494. MORAN, P. A. P. 1953. The statistical analysis of the Canadian lynx cycle II. Synchronization and meteorology. Australian Journal of Zoology 1:291–298. MORRIS, D. W. 1992. Scales and costs of habitat selection in heterogeneous landscapes. Evolutionary Ecology 6:412–432. MYRBERGET, S. 1973. Geographical synchronism of
Vol. 82, No. 2
cycles of small rodents in Norway. Oikos 24:220– 224. RANTA, E., J. LINDSTRO¨M, AND H. LINDE´N. 1995. Synchrony in tetranoid population dynamics. The Journal of Animal Ecology 64:764–776. STEEN, H., R. A. IMS, AND G. A. SONERUD. 1996. Spatial and temporal patterns of small-rodent population dynamics at a regional scale. Ecology 77:2365– 2372. WIENS, J. A. 1989. Spatial scaling in ecology. Functional Ecology 3:385–397. WOLFF, J. O. 1996. Population fluctuations of masteating rodents are correlated with production of acorns. Journal of Mammalogy 77:850–856. Submitted 31 July 2000. Accepted 1 October 2000. Associate Editor was Renn Tumlison.