Journal of Electronic Imaging 9(4), 432 – 444 (October 2000).
Colorimetric modeling for vision systems Gao-Wei Chang Yung-Chang Chen* National Tsing Hua University Department of Electrical Engineering Hsinchu, Taiwan 30043, Republic of China
Abstract. A colorimetric modeling technique is proposed to give a computational model associated with colorimetry so that the representation of color acquired from camera imaging is accurate and meaningful. First of all, the camera spectral responses are estimated and the colorimetric quality is evaluated to reveal the feasibility of this work. In the modeling process, we present a spectral matching method and an approach of determining a reference-white luminance. As a result, the acquired color and the true (or measured) color can be well coordinated, with the strength of a global illumination or display white, in a perceptually uniform color space, e.g., in CIE 1976 L * a * b * space (abbreviated as CIELAB). Then, lower-degree polynomial regression is employed to eliminate color errors due to the mismatch between spectral response functions. * value Experimental results indicate that the root-mean-square ⌬ E ab (i.e., color error) from the degree-3 polynomial regression is less than a just-noticeable difference (about 2.3) in CIELAB. It appears that the proposed technique can establish an accurate colorimetric model for vision systems. © 2000 SPIE and IS&T. [S1017-9909(00)01604-4]
1 Introduction For many years, it has been broadly recognized that the use of color becomes increasingly significant in a variety of fields, such as visualization and image rendering, machine vision, pattern recognition, and so on. Specifically, a realistic image is a projection from a scene onto a plane with sensor array共s兲, where it is digitized into discrete pixel positions and intensities through separating color signals. As a result, many imaging or vision systems are purposely designed to be capable of using color as a feature for object recognition, or of rendering 共or synthesizing兲 scene images with computer generated imagery to meet commercial or specific needs. Evidently, it is extremely desirable to enable these systems to have the ability of color perception analogous to that of human beings. For objectively describing color sensations, colorimetry has played a prominent role in characterizing incident light spectrum with the help of a set of numbers named tristimulus values. Unfortunately, in practice, the color accuracy of vision systems are highly restricted, even though several
*Author to whom correspondence should be addressed; Tel: ⫹886-3-5731153; Fax: ⫹886-3-5715971; E-mail:
[email protected]
Paper 16-004 received Dec. 7, 1999; accepted for publication Apr. 26, 2000. 1017-9909/2000/$15.00 © 2000 SPIE and IS&T.
international standards have been established, e.g., International Commission on Illumination 共CIE兲 recommendations in colorimetry, National Television System Committee 共NTSC兲 color standards, and so on.1 There are several important factors resulting in color distortions, such as spectral imperfection of optical components, camera noise, and limitations in fabrication of color filters. For instance, chromatic aberration in a camera’s lens geometrically projects the color channels 关e.g., red-green-blue 共RGB兲 channels兴 differently and as a consequence, misregistration between these channels brings about image color discrepancy.2 Usually, the appearance of color from an imaging process is somewhat device-dependent or noncolorimetric. Therefore, the realization of device-independent color is still an essential issue, and we commonly call the color acquired from a vision system, device color. Many researchers have devoted themselves to developing techniques for color characterization of imaging or vision devices, such as scanners and cameras.1–16 Given the spectral reflectances, Vrhel and Trussell3 proposed a method to correct device colors based on principlecomponent analysis. Jackowski et al.2 presented an idea of lookup table mapping to reduce color errors. They determined three transformation functions using a number of image colors whose true 共or colorimetric兲 values were measured. These functions were then used to estimate the measured value of each color in an image. Herzog et al.7 used higher-degree polynomial regression method for color characterization. In this approach, since polynomials are global functions, these functions diminish local color errors over a specified color space. However, the color errors evaluated in this method should be minimized with a perceptual color * in CIELAB space. Chang difference measure, e.g., ⌬E ab and Reid12 introduced a color calibration method for eliminating the variations in RGB values caused by vision systems. In their approach, they suppose that color errors arise from gray-level shift, a variation in amplification and quantization in camera electronics or frame grabber, and so on. Usually, the severity of this problem is device dependent. In general, if the operation of a vision system can be accurately represented by a parametric color model, the characterization is readily done by determining the model parameters from a few measurements. As no analytic model is available, a pure empirical approach using a great amount of color samples is necessary, in which the characterization function is directly measured over a grid of specified data;1
432 / Journal of Electronic Imaging / October 2000 / Vol. 9(4) Downloaded from SPIE Digital Library on 04 Feb 2012 to 140.114.195.186. Terms of Use: http://spiedl.org/terms
Colorimetric modeling for vision systems
otherwise, color discrepancies will mislead the vision system. Therefore, it is very crucial to give a color imaging model for vision systems. In this article, a colorimetric modeling technique is proposed not only to characterize device colors but also to develop a computational model, so that they are related to true 共or measured兲 values. Specifically, this technique is to give better estimates of colorimetric values 共e.g., CIE L * a * b * values兲 from electronic cameras. For this, we first estimate the camera spectral responses, from the principle of color image formation 共i.e., spectral integration兲, under reasonable assumptions. The determination of spectral responsivities is essential since these responses reflect variations in the imaging parameters, such as aperture stop size and white balance setting, which considerably influence the performance of color imaging. Then, we assess the colorimetric quality for the camera imaging system to examine the feasibility of colorimetric modeling. Specifically, the measure of colorimetric quality introduced by Neugebauer,17 called q factor, can be computed from the spectral characteristics, and it theoretically reveals the degree of the correlation between device colors and CIE tristimulus values for human vision. This factor also indicates the potential capability of an imaging device to give meaningful color representations, to some extent, in connection with colorimetry. In our approach, the colorimetric modeling process involves three major steps in the following. First, we introduce a spectral matching method for computing device colors with a set of synthesized spectral responsivities, which are optimally matched to standardized spectral response functions, e.g., NTSC-RGB standard,18 in the least-squares sense, from the camera’s spectral features. Second, we present an approach to determining a reference-white luminance so that the device colors and true 共or measured兲 colors can be well coordinated, with regard to the strength of a global illumination or display white, in a perceptually uniform color space, e.g., CIE 1976 L * a * b * space19 共CIELAB兲. Third, the polynomial regression technique is employed to eliminate color errors due to the mismatch between spectral response functions. These three methods are formulated by individually specified functions. Then, these functions are incorporated with the spectral integration form for camera imaging, and consequently the colorimetric model for vision systems is established. In our experiments, a color testing and measurement scheme based on the CIE 0/45 configuration19 is developed. By using multiple polynomial regression for color correction, it is found that as the degree of polynomial increases * value drafrom 1 to 2, the root-mean-square 共rms兲 ⌬E ab matically decreases. This implies that the methods of spectral matching and evaluating reference-white luminance are essential and effective. That is, only lower-degree polynomial regression is needed to eliminate residual color errors. * values from Experimental results indicate that the rms ⌬E ab the degree-3 polynomial regression are sufficiently small in CIELAB, since they are less than a just-noticeable * unit兲. difference1 共about 2.3 ⌬E ab This article is organized as follows. Section 2 describes the mathematical model of color imaging. Section 3 presents the colorimetric quality evaluation. The colorimetric
modeling technique is introduced in Sec. 4, and detailed derivations for the spectral matching method are left to Appendix A. Also, color coordinate transformations are formulated in Appendix B. Section 5 gives the experimental results. Finally, Sec. 6 concludes this article. 2
Mathematical Model of Color Imaging
2.1 Camera Model A video camera with an objective lens is commonly capable of forming a color image by focusing light on its sensor array共s兲 and by separating color signals. It is reasonably assumed that no blooming occurs in imaging process and nonlinearities due to gamma correction 共i.e., predistortion compensating for display phosphor properties兲 are not present. Over a restricted region, we may also ignore the spatial variations in incident light with spectral power distribution C() of wavelength and the spatial nonuniformities of camera’s spectral responsivities S (k) () of color channels, k⫽1, 2, 3. Therefore, at a given time instant, the imaging process can be modeled4,14 as u 共 k 兲⫽
冕
2
1
C 共 兲 S 共 k 兲 共 兲 d⫹  共 k 兲 ⫹n 共 k 兲 ,
共1兲
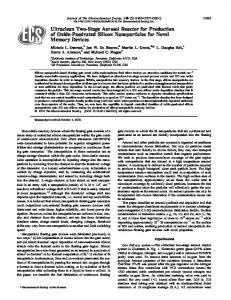
where the spatial average values u (k) ,  (k) , and n (k) represent the camera output, bias value due to dark current, and camera noise of the kth channel, respectively. Usually, the practical visible range 关 1 , 2 兴 ⫽ 关 400 nm, 700 nm兴 and the color channels, k⫽1, 2, 3, are designated for the red, green, and blue 共RGB兲 channels. In Eq. 共1兲, we consider that the values of  (k) , k⫽1, 2, 3, are constant and the image sensor共s兲 is less sensitive to change in temperature. Evidently, these values can be obtained by taking the average of repeated outputs of camera imaging with no incident light if the mean value of camera noise is generally assumed to be zero. Furthermore, parameters of camera imaging, such as size of aperture stop, the setting value of white balance, and so on, are supposed to be fixed since the spectral responsivities are influenced by these parameters. 2.2 Estimation of Spectral Responsivities To estimate camera’s spectral responses, we develop a filter-based optical system, as shown in Fig. 1. The optical system primarily consists of a diffused area light source, a collection of spectral filters mounted on a rotary wheel, and a platform for shielding the light source from ambient light. In Fig. 1, the surfaces of these spectral 共or color兲 filters with spectral transmittances 兵 F i (), i⫽1, 2,..., N C 其 , where N C is the number of the filters, are parallel to that of the light source with spectral power distribution I(). As a result, the light ray from the radiation source going, in sequence, through these filters generates a collection of colored light, called color stimuli, 兵 C i (), i⫽1, 2,..., N C 其 . That is, we have C i 共 兲 ⫽F i 共 兲 I 共 兲 , i⫽1, 2,..., N C .
共2兲
In the optical system, the color stimuli individually incident upon a digital camera under test are used to excite Journal of Electronic Imaging / October 2000 / Vol. 9(4) / 433
Downloaded from SPIE Digital Library on 04 Feb 2012 to 140.114.195.186. Terms of Use: http://spiedl.org/terms
Chang and Chen
Physically, the elements in the spectral vectors 兵S(k) , k ⫽1, 2, 3其, i.e., the spectral values, are supposed to be all non-negative. We denote this constraint as S共 k 兲 ⭓0, k⫽1, 2, 3.
共7兲
To solve Eq. 共5兲 for the optimal solution vectors 兵Sˆ(k) , k ⫽1, 2, 3其 in the least squares sense, we adopt a nonnegative least-squares 共NNLS兲 algorithm proposed by Lawson and Hanson,21 for the NNLS problem as follows: Problem NNLS: ˜ 共 k 兲储 2 , Minimize 储 CS共 k 兲 ⫺U Fig. 1 Filter-based optical system for estimating spectral responsivities.
the features of color imaging so that the spectral characteristics can be truly extracted from observations. From Eq. 共1兲, we have u 共i k 兲 ⫽
冕
2
1
C i 共 兲 S 共 k 兲 共 兲 d⫹  共 k 兲 ⫹n 共i k 兲 ,
共3兲
means the camera output and n (k) is the camera where u (k) i i noise, for the kth channel, in response to the ith color stimulus C i (). In general, Eq. 共3兲 can be approximated in vector forms, with quadrature sampling, i.e., ˜u 共i k 兲 ⫽ 共 Ci 兲 TS共 k 兲 ⫹n 共i k 兲 ,
i⫽1, 2,..., N C , and k⫽1, 2, 3, 共4兲
(k) (k) where ˜u (k) is a trimmed observation, S(k) and i ⫽u i ⫺  Ci are N W ⫻1 column vectors of quadrature samples for representing S (k) () and C i (), respectively, with the sampling interval ⌬ S and the number of quadrature samples N W , and the superscript T means matrix 共or vector兲 transpose. Obviously, the number of the color stimuli, N C , must be larger than or equal to N W for estimating S(k) . Thus, let N W ⫽N C for computational convenience. From Eq. 共4兲, the set of trimmed observations, 兵u ˜ (k) i , i ⫽1, 2,..., N C 其, corresponding to these color stimuli can be arranged in the N C ⫻1 vector
˜ 共 k 兲 ⫽CS共 k 兲 ⫹n共 k 兲 , k⫽1, 2, 3, U
共5兲
where the vector (Ci ) T occupies the ith row of the matrix C苸 RNC⫻NC and n(k) 苸 RNC⫻1 is the kth channel noise vector from N C observations. Obviously, the vectors S(k) 苸 RNC⫻1, k⫽1, 2, 3, for spectral responsivities in Eq. 共5兲 can be estimated if rank共 C兲 ⫽N C ,
共6兲
where the computation of matrix rank is denoted as rank 共"兲. Moreover, it can be shown that the matrix C must be well-conditioned to achieve satisfactory estimation accuracy;20 that is, the solution vector for Eq. 共5兲 can be less sensitive to camera noise.
subject to S共 k 兲 ⭓0,
k⫽1, 2, 3,
共8兲
where C苸 RNC⫻NC, the estimates 兵Sˆ(k) , k⫽1, 2, 3其 of S(k) ˜ (k) , k⫽1, 2, 3其 are all and the trimmed observations 兵U N C ⫻1 vectors, and 储 "储 2 denotes the 2-norm for a vector.20 Furthermore, from the estimated vectors 兵Sˆ(k) , k⫽1, 2, 3其, one can use an interpolation technique, such as a low-pass filtering technique for perfect reconstruction,22 to obtain in¯ˆ (k) , k⫽1, 2, 3其 for representing the terpolated vectors 兵S estimated spectral responsivities ¯Sˆ (k) (), k⫽1, 2, 3, with a desired wavelength resolution. 3 Colorimetric Quality Evaluation It is well known that the spectral responsivities highly influence the color imaging performance. The evaluation of colorimetric quality for an imaging device means to measure the degree of how closely its spectral responsivities correspond to those of the human eye. For this, the Luther– Ives condition17 plays a significant role in the link between device colors and human vision. It states that visually identical colors will be photographed identically if the spectral sensitivities 共or responsivities兲 conform to any set of colormixture curves. A color-mixture curve, denoted as O(), can be derived from O 共 兲 ⫽ ␣ 1¯x 共 兲 ⫹ ␣ 2¯y 共 兲 ⫹ ␣ 3¯z 共 兲 ,
共9兲
where ␣ 1 , ␣ 2 , and ␣ 3 are all real numbers and ¯x (), ¯y (), and ¯() z are the color matching functions 共CMFs兲 of the CIE 1931 (X,Y ,Z) system.19 These functions are called CIEXY Z color-matching functions and in Fig. 2, they are depicted and labeled CMFs x, y, and z, respectively. Based on this crucial fact, Neugebauer17 introduced colorimetric quality factors, called q factors, to describe how closely spectral responsivities of an imaging device match color-mixture curves, which ensure that visually identical colors will reproduce alike. To calculate q factors, he suggested a set of orthogonal color-mixture curves, denoted as 兵 O 1 (),O 2 (),O 3 () 其 , as specified below O 1 共 兲 ⫽⫺0.4066x ¯ 共 兲 ⫹0.5521y ¯ 共 兲,
共10a兲
¯ 共 兲 ⫺0.0433y ¯ 共 兲, O 2 共 兲 ⫽0.4066x
共10b兲
and
434 / Journal of Electronic Imaging / October 2000 / Vol. 9(4) Downloaded from SPIE Digital Library on 04 Feb 2012 to 140.114.195.186. Terms of Use: http://spiedl.org/terms
Colorimetric modeling for vision systems
ment, we assume that colored light incident upon a video camera can be represented in the reproducible gamut of the NTSC-RGB standard. 4.1 Computing Device Colors with Spectral Matching Ideally, from the Luther–Ives condition, one can see that the colorimetric quality is perfect 共i.e., all q factors for color channels equal to 1兲 if a set of linear combinations of camera’s spectral responsivities exactly conform to the NTSC-RGB spectral responsivities. In matrix forms, it appears that AS MS ⫽ 关 RN GN BN 兴 , Fig. 2 Color matching functions of CIE 1931 ( X , Y , Z ) system.
O 3 共 兲 ⫽⫺0.179x ¯ 共 兲 ⫹0.1018y ¯ 共 兲 ⫹0.281z ¯共 兲.
共10c兲
As a consequence, given the estimated spectral responsivities ¯Sˆ (k) (), the colorimetric quality factors q (k) of a camera, for color channels k⫽1, 2, 3, can be defined by 3
q 共 k 兲⫽
兺 关共 ¯Sˆ 共 k 兲 兲 T Oi 兴 2 / 关共 ¯Sˆ 共 k 兲 兲 T共 ¯Sˆ 共 k 兲 兲兴 ,
i⫽1
共11兲
where the column vector ¯Sˆ (k) represents ¯Sˆ (k) () with a desired wavelength resolution ⌬ d and the column vector Oi stands for the orthogonal color-mixture curve O i (), i ⫽1, 2, 3, from Eqs. 共10a兲–共10c兲, with the same resolution ⌬ d . Obviously, the value of q factor ranges from zero to one, and in particular, it is equal to one for an exact colormixture curve. That is, the spectral responsivities of a camera can closely match color-mixture curves as the q factors approach one. 4 Colorimetric Modeling Technique As indicated in Sec. 3, color-mixture curves are central to evaluating colorimetric quality. From Eq. 共9兲, it is obvious that the number of color-mixture curves is infinite because they are obtained by linear combinations of the CIEXY Z color-matching functions. The NTSC-RGB standard has been broadly recognized and utilized in video systems and television industry. Its spectral responsivities with a specified reference white can be derived from those colormatching functions, according to the chromaticity coordinates of display phosphor primaries. Evidently, these spectral responses are color-mixture curves since their colorimetric quality factors are all equal to 1. In addition, from various colorimetric investigations,18 there is a tendency to use a daylight-type illuminant with correlated color temperature 共CCT兲 6500 K as a reference white, e.g., the CIE recommended illuminant D 65 . Thus, without loss of generality, we adopt the NTSC-RGB spectral responsivities with illuminant D 65 as a set of representative colormixture curves. Also, for convenience of color error assess-
共12兲
where AS ⫽ 关 RS GS BS 兴 苸 RNS⫻3 is composed of the column vectors that stand for the camera spectral responses R S (), G S (), and B S () with sample number N S , which are referred to as the estimated spectral responsivities, ¯Sˆ (k) (), k⫽1, 2, 3, from Sec. 2.2, respectively; also MS ⫽ 关 m1 m2 m3 兴 consists of the column vectors mi 苸 R3⫻1, i⫽1, 2, 3, and RN , GN , and BN 苸 RNS⫻1 individually represent the NTSC-RGB spectral responsivities, denoted as R N (), G N (), and B N (), with the same number N S . The spectral imperfections of a camera make it necessary to find a least-squares solution. This solution, denoted as m ˆ i 苸 R3⫻1, i⫽1, 2, 3, for Eq. 共12兲, can be readily obtained, e.g., m ˆ 1 ⫽(ATS AS ) ⫺1 ATS RN . As a result, the synthesized 共or matched兲 spectral responsivities R C (), G C (), and B C () can be expressed as ˆ TS ATS ⫽M ˆ TS 关 RS GS BS 兴 T, 关 RC GC BC 兴 T⫽M
共13兲
ˆ S⫽ 关 m where M ˆ1 m ˆ2 m ˆ 3 兴 and the column vectors RC , GC , and BC 苸 RNS⫻1 represent these matched spectral responses, respectively. Now, let’s compute device colors with the spectral matching, denoted as (R C(i) ,G C(i) ,B C(i) ), in response to the ith testing colored light (TCL)T i () incident upon the camera, for i⫽1 to N M , where N M is the number of the testing light. The ith device color, represented as a vector VC(i) 苸 R3⫻1, can be formulated as V共Ci 兲 ⫽ 关 R 共Ci 兲 G 共Ci 兲 B 共Ci 兲 兴 T ˆ TS 关共 R 共Si 兲 ⫺  R 兲 共 G 共Si 兲 ⫺  G 兲 共 B 共Si 兲 ⫺  B 兲兴 T, ⫽M i⫽1 to N M ,
共14兲
(i) (i) where R (i) S , G S , and B S stand for the camera outputs from RGB channels, and  R ,  G , and  B mean  (k) , k ⫽1, 2, 3, from Sec. 2.1 and Eq. 共3兲, respectively. For details, please refer to Appendix A. In Eq. 共14兲, the camera output subtracted from the bias value due to dark current, e.g.,  R , is called trimmed camera output, e.g., R (i) S ⫺R . In addition, Appendix A gives detailed expressions to normalize the vector VC(i) . To distinguish the device colors from the camera outputs, we call VC(i) device-color vector, which represents the
Journal of Electronic Imaging / October 2000 / Vol. 9(4) / 435 Downloaded from SPIE Digital Library on 04 Feb 2012 to 140.114.195.186. Terms of Use: http://spiedl.org/terms
Chang and Chen
device color computed with the trimming and spectral (i) (i) (i) T 3⫻1 matching, and let V(i) stand for S ⫽关RS GS BS 兴 苸R the camera-output vector. From the computations of the spectral matching, trimming, and normalization, we define a function ⌽ C (") that maps a camera-output vector onto a normalized device-color vector. That is, we have ¯ 共Ci 兲 ⫽⌽ C 共 V共Si 兲 兲 , i⫽1 to N M , V
共15兲
3⫻1 ¯ C(i) where V(i) is the camera-output vector and V S 苸R ¯ C(i) ¯B C(i) 兴 T苸 R3⫻1 means the normalized device⫽ 关 ¯R C(i) G color vector, in response to the ith incident light T i ().
4.2 Determining Reference-White Luminance For the link between the device colors and the measured colors 关e.g., the colorimetric data of the ith incident light T i ()兴, it is essential to determine the reference-white luminance, denoted as Y 0 , since the color image data acquired from a digital camera can hardly give a physical quantity of luminance. To tackle this problem, the basic idea is to estimate Y 0 so that the chromaticity coordinates and luminances of the device colors correspond to those of the measured colors as closely as possible in CIELAB space. In other words, it is to minimize the color errors between the device colors and the measured colors with a reference-white luminance to be determined. To represent device colors in CIELAB, we consider the following two color coordinate transformations. First, for ¯ C(i) ⫽ 关 ¯R C(i) G ¯ C(i) ¯B C(i) 兴 T苸 R3⫻1, the ith normalized vector V the transformation from NTSC-RGB 共with illuminant D 65兲 to CIEXY Z can be expressed as a function ⌽ X ("), i.e., ¯ 共Xi 兲 ⫽⌽ X 共 V ¯ 共Ci 兲 兲 ⫽ 关 ¯X 共Ci 兲 ¯Y 共Ci 兲 ¯Z 共Ci 兲 兴 T, V
i⫽1 to N M ,
共16兲
¯ X(i) 苸 R3⫻1 is the device-color vector in CIEXY Z. where V For details, please refer to Appendix B. Second, the transformation from CIEXY Z coordinate 共or tristimulus values兲 (X,Y ,Z) to CIELAB coordinate (L * ,a * ,b * ) can be found in Appendix B. It is noted that asterisks of conventional use in literature for CIELAB coordinates may be omitted here for notational simplicity. Similar to Eq. 共16兲, this transformation can be also expressed as a function ⌽ L ("). Then, we have the vector ¯ 共Xi 兲 兲 ⫽ 关 L 共Ci 兲 a 共Ci 兲 b 共Ci 兲 兴 T, V共Li 兲 ⫽⌽ L 共 V
i⫽1 to N m ,
共17兲
where VL(i) 苸 R3⫻1 is the device-color vector in CIELAB ¯ X(i) ⫽ 关 ¯X C(i) ¯Y C(i) ¯Z C(i) 兴 T苸 R3⫻1. In this transform, since and V the color coordinate (x 0 ,y 0 ,z 0 ) of illuminant D 65 equals 共0.3127, 0.3291, 0.3582兲, we have its tristimulus values in CIEXY Z 共 X 0 ,Y 0 ,Z 0 兲 ⫽ 共共 x 0 /y 0 兲 Y 0 ,Y 0 , 共 z 0 /y 0 兲 Y 0 兲
⫽ 共 0.9502Y 0 ,Y 0 ,1.088Y 0 兲 .
共18兲
Now, we intend to minimize the root-mean-square 共rms兲 color error in CIELAB space,
冋
N
1 M *⫽ rms ⌬E ab 共 ⌬E 共abi 兲 兲 2 N M i⫽1
兺
册
1/2
,
共19兲
and ⌬E 共abi 兲 ⫽ 关共 L 共Ci 兲 ⫺L 共Mi 兲 兲 2 ⫹ 共 a 共Ci 兲 ⫺a 共Mi 兲 兲 2 ⫹ 共 b 共Ci 兲 ⫺b 共Mi 兲 兲 2 兴 1/2,
共20兲
for i⫽1, 2,..., N M , (i) (i) where (L (i) M ,a M ,b M ) is the CIELAB coordinate of the ith measured color. From Appendix B and Eqs. 共16兲–共18兲, ¯ C(i) ,Y ¯ C(i) ,Z ¯ C(i) ) and given the normalized tristimulus values (X (i) (i) (i) measured ones (X M ,Y M ,Z M ), i⫽1, 2,..., N M , in * is the function of only the CIEXY Z, we can see that ⌬E ab unknown variable Y 0 . It appears that the solution of Y 0 for * can be obtained by using optimizaminimizing rms ⌬E ab tion techniques or by means of numerical calculations. Once the reference-white luminance is determined, the device and measured color coordinates (L C(i) ,a C(i) ,b C(i) ) and (i) (i) (L (i) M ,a M ,b M ), i⫽1, 2,..., N M , in CIELAB are obtained.
4.3 Color Correction Using Multiple Polynomial Regression So far, the device colors and measured colors have been well coordinated, with the above evaluated strength of a global illumination 共or display white兲, i.e., the computed Y 0 , in CIELAB. To eliminate the remaining color errors between them, we employ the technique of multiple polynomial regression. Specifically, we use this technique for the color correction since the colorimetric quality factors are usually less than 1. The polynomial, of variables L C , a C , and b C , with degree j can be formulated as p j 共 L C ,a C ,b C 兲 ⫽ 共 p j 兲 Tk j ,
共21兲
where p j is a column vector of the polynomial, k j is a column vector of its associated coefficient, and j is a nonnegative integer. Table 1 lists the corresponding column vectors p j and k j , for j⫽0, 1, 2, 3. We select several representative terms for the polynomials with the degree ranging from 0 to 3. Although they are not complete, we just intend to verify the effectiveness of color correction using polynomial regression with a certain degree. This is because, as the degree of the polynomial increases, the residual color error will theoretically decrease. Since the three components, L * , a * , and b * , of CIELAB coordinates are mutually independent, we may formulate the problem of color error minimization 共i.e., color correction兲 in terms of these components, respectively. For instance, regarding the L * components of all the device and measured color coordinates (L C(i) ,a C(i) ,b C(i) ) and (i) (i) (L (i) M ,a M ,b M ), i⫽1, 2,..., N M , in CIELAB, we can obtain the solution vector kˆ j(L) , such that 储 P j k j 共 L 兲 ⫺LM 储 2 is minimized,
436 / Journal of Electronic Imaging / October 2000 / Vol. 9(4) Downloaded from SPIE Digital Library on 04 Feb 2012 to 140.114.195.186. Terms of Use: http://spiedl.org/terms
共22兲
Colorimetric modeling for vision systems Table 1 Polynomial vector and its associated coefficient vector. Polynomial type
Polynomial vector and its associated coefficient vector
Degree zero (or constant)
p0 ⫽1, k0 ⫽ k 0 p1 ⫽ 关 1 L C a C b C 兴 T, k1 ⫽ 关 k 0 k 11 k 12 k 13兴 T
Degree 1
p2 ⫽ 关 1 L C a C b C L C2 a C2 b C2 L C a C L C b C a C b C 兴 T
Degree 2
k2 ⫽ 关 k 0 k 11 k 12 k 13 k 21 k 22 k 23 k 24 k 25 k 26兴 T p3 ⫽ 关 1 L C a C b C L C2 a C2 b C2 L C a C L C b C a C b C L C3 a C3 b C3 L C a C b C 兴 T k3 ⫽ 关 k 0 k 11 k 12 k 13 k 21 k 22 k 23 k 24 k 25 k 26 k 31 k 32 k 33 k 34兴 T
Degree 3
where (N ) L M M 兴 T,
(N M ) T
P j ⫽ 关 p(1) p(2) j j ...p j
兴 ,
(2) LM ⫽ 关 L (1) M L M ...
and p(i) means the column vector p j with j (L C ,a C ,b C )⫽(L C(i) ,a C(i) ,b C(i) ), as defined in Table 1, e.g., (i) (i) (i) T p(i) 1 ⫽ 关 1 L C a C b C 兴 . As a consequence, the column vector representing the L * components of the corrected device colors is expressed as ˆ C ⫽ 关 Lˆ 共C1 兲 Lˆ 共C2 兲 ...Lˆ 共 N M 兲 兴 T⫽P j kˆ j 共 L 兲 , L C
共23兲
where kˆ j(L) ⫽(PTj P j ) ⫺1 PTj LM . Likewise, we can obtain the column vectors aˆC (N ) ⫽ 关 aˆ C(1) aˆ C(2) ... aˆ C M 兴 T⫽P j kˆ j(a) and bˆC ⫽ 关 bˆ C(1) bˆ C(2) ... (N ) bˆ M 兴 T⫽P j kˆ j(b) for the a * and b * components of the cor-
Step 3: Transforming the NTSC-RGB coordinates to those of CIEXY Z, i.e., ¯ 共Ci 兲 ,B ¯ 共Ci 兲 兲 → 共 ¯X 共Ci 兲 ,Y ¯ 共Ci 兲 ,Z ¯ 共Ci 兲 兲 , for i⫽1 to N M ; R 共Ci 兲 ,G 共¯ Step 4: Collecting the measured colorimetric data of TCL, (i) (i) i.e., color coordinates (x (i) M ,y M ,Y M ) or tristimulus values (i) (i) (i) (X M ,Y M ,Z M ), and transforming the CIEXY Z data (i) (i) ¯ (i) ¯ (i) ¯ (i) (X (i) M ,Y M ,Z M ) and (X C ,Y C ,Z C ) to the coordinates of CIELAB with the reference-white luminance to be determined, i.e., 共 X 共Mi 兲 ,Y 共Mi 兲 ,Z 共Mi 兲 兲 → 共 L 共Mi 兲 ,a 共Mi 兲 ,b 共Mi 兲 兲
C
rected device colors, where kˆ j(a) and kˆ j(b) are the solution vectors for the error minimization problem of a * and b * components, similar to that for kˆ j(L) in Eq. 共22兲. It appears that the color errors between (L C(i) ,a C(i) ,b C(i) ) and (i) (i) (L (i) M ,a M ,b M ), i⫽1, 2,..., N M , will be minimal through the polynomial regression technique with a specified degree. Therefore, we can define a function ⌽ P( j) (") to stand for the degree-j polynomial regression, which maps the devicecolor vector VL(i) ⫽ 关 L C(i) a C(i) b C(i) 兴 T苸 R3⫻1 onto the corˆ L(i) ⫽(Lˆ C(i) ,aˆ C(i) ,bˆ C(i) ), i.e., rected one V ˆ 共Li 兲 ⫽⌽ P 共 j 兲 共 V共Li 兲 兲 , V
for i⫽1 to N M .
共24兲
Colorimetric Imaging Model The process of colorimetric modeling is briefly reviewed in the following and its flow diagram is shown in Fig. 3: Step 1: Trimming and normalizing camera outputs 关from Eqs. 共A3兲 and 共A4兲 in Appendix A兴,
4.4
denoted as ¯ 共Si 兲 ,B ¯ 共Si 兲 兲 , for i⫽1 to N M ; R 共Si 兲 ,G 共 R 共Si 兲 ,G 共Si 兲 ,B 共Si 兲 兲 → 共 ¯ Step 2: Computing device colors with the spectral matching, ¯ 共Si 兲 ,B ¯ 共Si 兲 兲 → 共 ¯R 共Ci 兲 ,G ¯ 共Ci 兲 ,B ¯ 共Ci 兲 兲 , for i⫽1 to N M ; R 共Si 兲 ,G 共¯
Fig. 3 Flow diagram of colorimetric modeling process.
Journal of Electronic Imaging / October 2000 / Vol. 9(4) / 437 Downloaded from SPIE Digital Library on 04 Feb 2012 to 140.114.195.186. Terms of Use: http://spiedl.org/terms
Chang and Chen
and ¯ 共Ci 兲 ,Z ¯ 共Ci 兲 兲 → 共 L 共Ci 兲 ,a 共Ci 兲 ,b 共Ci 兲 兲 , for i⫽1 to N M ; X 共Ci 兲 ,Y 共¯ Step 5: Determining the value of reference-white luminance; Step 6: Correcting color by use of polynomial regression; Step 7: Obtaining corrected color coordinates in CIELAB space, denoted as (Lˆ C(i) ,aˆ C(i) ,bˆ C(i) ), for i⫽1 to N M . In summary, the colorimetric model for camera imaging can be expressed as ˆ L ⫽⌽ P 共 j 兲 关 ⌽ L 兵 ⌽ X 关 ⌽ C 共 VS 兲兴 其 兴 , V
共25兲
where ⌽ C ("), ⌽ X ("), ⌽ L ("), and ⌽ P( j) (") are individually defined in Eqs. 共15兲–共17兲, and 共24兲, VS ⫽ 关 R S G S B S 兴 T 苸 R3⫻1 is a camera-output vector in response to the inciˆ L ⫽ 关 Lˆ C aˆ C bˆ C 兴 T苸 R3⫻1 is the corrected dent light, and V device-color vector in CIELAB space. Since the coordinate transformations ⌽ X (") and ⌽ L (") are both one-to-one mappings, we may take their inverses ⌽ X⫺1 (") and ⌽ L⫺1 (") to obtain the desired representation of the corrected devicecolor vector for the need of applications in computer vision. For example, from Eq. 共25兲, the corrected device-color vector in CIEXY Z or NTSC-RGB standard is represented as ˆ L ) or ⌽ X⫺1 关 ⌽ L⫺1 (V ˆ L ) 兴 in response to the light inci⌽ L⫺1 (V dent upon the camera. In Sec. 2, one sees that the camera imaging process is expressed as a mathematical model 共i.e., a spectral integration form or a matrix form兲 with given 共or estimated兲 spectral responsivities, under certain imaging conditions, from Eq. 共1兲 or 共5兲. Also, the functions ⌽ C ("), ⌽ X ("), ⌽ L ("), and ⌽ P( j) (") can be entirely determined from this proposed modeling technique. Then, these functions are incorporated with the spectral integration form for camera imaging, and consequently the colorimetric model for vision systems is established. Therefore, we have a computational model for computer color vision. 5
Experimental Results
5.1 Determining Spectral Responsivities and q Factors In the filter-based optical system, the diffused light source is operated at color correlated temperature 共CCT兲 5500 K and its spectral power distribution I() is exhibited in Fig. 4. To specify the number of spectral filters N C , we suppose that the interval of quadrature sampling ⌬ S ⫽20 nm is enough to characterize most spectral responsivity functions over the main visible region 关410 nm, 690 nm兴. The spectral responsivities over the remaining parts of the visible region, i.e., 关400 nm, 410 nm兴 and 关690 nm, 700 nm兴 can be readily obtained by the interpolation technique,22 as mentioned in Sec. 2.2. Thus, we have N C ⫽(690⫺410)/20 ⫽14. The 14 spectral filters mounted on the rotary wheel are selected from a collection of Roscolux color filters, so that the condition from Eqs. 共2兲 and 共6兲 is satisfied for generating color stimuli. The spectral transmittances of these filters are shown in Figs. 5共a兲 and 5共b兲.
The color images from the 14 color stimuli were consecutively acquired and digitized by a Sony XC711 color camera 共with a Cosmicar television lens兲 and a Matrox Meteor image grabber. The imaging parameters of the camera are all fixed in the experiment. For example, the shutter speed is set to 1/1000 second and the F-number equals 4 for the aperture stop of the lens. The digitized images that are represented by three 8-bit data for RGB channels, i.e., integer values ranging from 0 to 255, can be computed to obtain the corresponding camera output values. After removing the light source, we acquire an image from the camera with no incident light, and then the bias values (  (1) ,  (2) ,  (3) )⫽(  R ,  G ,  B )⫽(13,11,11) can be obtained from the image data. Thus, from Eqs. 共4兲 and 共5兲, the ˜ k , k⫽1, 2, 3, for RGB three 14⫻1 observation vectors U channels are constituted with the camera outputs and bias values, respectively. From the NNLS method mentioned in Sec. 2.2, the spectral vectors 兵 Sˆ(k) , k⫽1, 2, 3 其 can be estimated. Also, we use the interpolation technique of low-pass filtering22 to obtain the vector ¯Sˆ (k) , interpolated from Sˆ(k) , to represent the estimated spectral responsivities ¯Sˆ (k) (), i.e., R S (), G S (), and B S (), with a desired wavelength resolution, e.g., 10 nm. Figure 6 exhibits the estimated spectral responsivities of the Sony XC711 color camera with a 10 nm wavelength resolution. The actual installation of the filterbased optical system is shown in Fig. 7. To evaluate the colorimetric quality factors of this camera, the set of orthogonal color-mixture curves suggested by Neugebauer is used, as depicted in Fig. 8. Table 2 indicates the evaluation results of the q factors and all of them exceed 0.85. 5.2 Color Testing and Measurement (CTM) Scheme To characterize device colors, it is necessary to generate and measure a collection of testing light incident upon a digital camera. For this, based on the CIE 0/45 geometry measurement configuration,19 a color testing and measurement scheme is presented, as illustrated in Fig. 9. The light emanating from a tungsten halogen lamp 共THL兲 with CCT 3200 K, which is housed in an iris diaphragm chamber, brings about directional illumination. The directional light illuminates the Macbeth ColorChecker 共MCC兲 with the spot size of about one inch diameter and at a nonzero degree angle to the normal. In the 0/45 condition, the slight deviation, i.e., the angle not exceeding 10°, from strict normal illumination reduces the possibility of introducing systematic errors in the measurement caused by interreflections between samples that are not completely matte and the optical components that might be used to illuminate the sample. The MCC with 24 color test patches is widely recognized to examine the color reproduction performance of various imaging devices, and thus it is qualified for the work of this scheme. In Fig. 9, the 24 patches of MCC, which is movable along the x and y axes, are individually illuminated by the incidence of the light source at an angle to the normal. At the same time, the 24 types of colored light are also reflected from the illuminated MCC patches at a 45° angle to the normal, respectively. The reflected
438 / Journal of Electronic Imaging / October 2000 / Vol. 9(4) Downloaded from SPIE Digital Library on 04 Feb 2012 to 140.114.195.186. Terms of Use: http://spiedl.org/terms
Colorimetric modeling for vision systems
light is referred to as testing colored light 共TCL兲 and labeled TCL Nos. 1–24, respectively. In the similar fashion, as indicated in Fig. 9, we also use a daylight-type illuminant with about CCT 6500 K, called a D 65 illuminant, to generate additional 24 types of TCL. They are labeled TCL Nos. 25–48. Therefore, we have 48 types of TCL to characterize the device colors. The CTM scheme involves two phases to consecutively receive the collection of the TCL. The first phase called measurement phase is, in sequence, to measure the testing light from each illuminated MCC patch by a Photo Research PR650 spectrophotometer. As a result, the measured color coordinates of CIE 1931 (x,y,Y ) for TCL Nos. 1–48 are obtained, as listed in Table 3. The second phase referred to as testing phase is first to acquire the image data from each illuminated MCC patch, and then to evaluate the corresponding camera outputs from these image data. 5.3 Determination of Camera’s Colorimetric Model From the estimated spectral responsivities of the Sony XC711 camera, the synthesized spectral responsivities are obtained through the spectral matching in Eq. 共13兲 or Eqs. 共Ala兲–共Alc兲 from Appendix A. Figure 10 exhibits the comparison between the NTSC-RGB standard and synthesized 共or matched兲 camera’s spectral responses. In this figure, the three dash curves, labeled NTSC – R, NTSC – G, and NTSC – B, are the spectral responses of NTSC-RGB standard and the solid curves, marked with CS – R, CS – G, and CS – B, stand for the synthesized spectral responsivities, respectively. From the computation of colorimetric quality, one can see that the degree of the correlation between these two sets of corresponding spectral responses should be consistent with the q factors for RGB channel, since NTSCRGB standard is a set of color-mixture curves. In the CTM scheme, the camera outputs can be acquired ¯ C(i) to constitute the normalized device-color vector V ¯ C(i) ¯B C(i) 兴 T苸 R3⫻1 in response to the ith TCL ⫽ 关 ¯R C(i) G T i (), i⫽1 to N M , where N M ⫽48. As described in Sec. 4.2, the reference-white luminance can be determined by solving Eqs. 共16兲–共20兲 and Eqs. 共B1兲, 共B2兲, and 共B3a兲– 共B3d兲 in Appendix B, through numerical calculations. Figure 11 shows the relationship between the reference-white * values, defined in Eq. 共19兲. We luminance and rms ⌬E ab obtain the value of the reference-white luminance Y 0 equal * . In Fig. to 148.22 共cd/m2兲 at the minimal point of rms ⌬E ab 11, we see the effectiveness of determining Y 0 since the * ⫽6.1457 is minimal. rms ⌬E ab To reduce color errors between the device colors and measured colors that correspond to the TCL T i (), i ⫽1 – 48, in the color testing and measurement scheme, we employ the multiple polynomial regression technique, as stated in Sec. 4.3. That is, this technique is used for the color correction. First of all, let’s observe color error distributions without color correction. Figure 12 shows the * with respect to distributions of ⌬L * , ⌬a * , ⌬b * , and ⌬E ab * values are TCL Nos. 1–48, respectively, and most of ⌬E ab larger than 5. Now, we use the polynomial regression with the degree j ranging from 1 to 3, for color correction. Figures 13共a兲– 13共c兲 and 14 exhibit the distributions of ⌬L * , ⌬a * , ⌬b * ,
Fig. 4 Spectral power distribution of the diffused light source.
* values, with respect to TCL Nos. 1–48, obtained and ⌬E ab from the degrees-1, -2, and -3 polynomial regressions for * and the norcolor correction. From Sec. 4, the rms ⌬E ab * malized rms ⌬E ab values with color correction are computed in the following:
Fig. 5 (a) A collection of spectral filters (1/2). (b) A collection of spectral filters (2/2).
Journal of Electronic Imaging / October 2000 / Vol. 9(4) / 439 Downloaded from SPIE Digital Library on 04 Feb 2012 to 140.114.195.186. Terms of Use: http://spiedl.org/terms
Chang and Chen
Fig. 6 Estimated spectral responsivities of a Sony XC711 color camera.
冋
N
1 M *⫽ rms ⌬E ab 共 Lˆ 共 i 兲 ⫺L 共Mi 兲 兲 2 N M i⫽1 C
兺
⫹ 共 aˆ 共Ci 兲 ⫺a 共Mi 兲 兲 2 ⫹ 共 bˆ 共Ci 兲 ⫺b 共Mi 兲 兲 2
册
1/2
,
共26兲
and
* normalized rms ⌬E ab NM
⫽
兺 关共 Lˆ 共Ci 兲⫺L 共Mi 兲 兲 2 ⫹ 共 aˆ 共Ci 兲⫺a 共Mi 兲 兲 2
i⫽1
⫹ 共 bˆ 共Ci 兲 ⫺b 共Mi 兲 兲 2 兴 1/2
冒
NM
兺 关共 L 共Mi 兲 兲 2 ⫹ 共 a 共Mi 兲 兲 2 ⫹ 共 b 共Mi 兲 兲 2 兴 1/2,
i⫽1
共27兲
Fig. 8 A set of orthogonal color-mixture curves suggested by Neugebauer.
where (Lˆ C(i) ,aˆ C(i) ,bˆ C(i) ) means the corrected device-color coordinate and N M ⫽48. Table 4 lists the ⌬E * ab values with or without color correction 共using polynomial regressions兲 for the 48 types of TCL. It is found that these color errors dramatically decrease as the degree j increases from 1 to 2. Also, as the degree of the polynomial equals 3, the color differences are smaller than those from the degree 2, but the performance of error reduction is gradually saturated. This implies that the methods of spectral matching and evaluating reference-white luminance, as described in Sec. 4, are essential and effective. That is, only lower-degree polynomial regression is needed to eliminate residual color * valerrors. As shown in Table 4, the normalized rms ⌬E ab ues from the polynomial regressions of degrees 1, 2, and 3 are 0.0475, 0.0334, and 0.0267, respectively. 5.4 Performance Verification To verify the effectiveness of the colorimetric modeling technique, we employ additional 24 types of colored light and evaluate the color errors corresponding to them. Similar to the CTM scheme, the generation of the colored light is also based on the 0/45 color measurement configuration. The only difference is that we use another daylight-type illuminant with about CCT 5500 K, called an illuminant D 55 , to produce 24 types of colored light, which are different from the TCL Nos. 1–48. From the camera’s colorimetric model, as determined in * values with or without Sec. 5.3, Table 5 compares the ⌬E ab color correction 共using polynomial regressions兲 for these types of colored light. For the perceptually uniform color * value of space, CIELAB, it has been shown that a ⌬E ab around 2.3 corresponds to a just-noticeable difference1 共JND兲. As the degree of polynomial regression equals 3, * ⫽2.0475 is less than a JND, and the correthe rms ⌬E ab Table 2 Evaluation results of colorimetric quality factors. Channel
Ch. R
Ch. G
Ch. B
Q factor
0.8930
0.8628
0.9361
Fig. 7 Actual installation of the filter-based optical system.
440 / Journal of Electronic Imaging / October 2000 / Vol. 9(4) Downloaded from SPIE Digital Library on 04 Feb 2012 to 140.114.195.186. Terms of Use: http://spiedl.org/terms
Colorimetric modeling for vision systems
Appendix A Let m ˆ i ⫽ 关 ␣ˆ i1 ␣ˆ i2 ␣ˆ i3 兴 T苸 R3⫻1, for i⫽1, 2, 3. From Eq. 共13兲, we have
␣ˆ 11R S 共 兲 ⫹ ␣ˆ 12G S 共 兲 ⫹ ␣ˆ 13B S 共 兲 ⫽R C 共 兲 ,
共A1a兲
␣ˆ 21R S 共 兲 ⫹ ␣ˆ 22G S 共 兲 ⫹ ␣ˆ 23B S 共 兲 ⫽G C 共 兲 ,
共A1b兲
and
Table 3 CIE 1931 ( x , y , Y ) coordinates of the 48 types of testing color light.
Fig. 9 Color testing and measurement scheme.
* is equal to 0.0285. Evisponding normalized rms ⌬E ab dently, our approach incorporated with the polynomial regression of lower degree can effectively diminish the color differences in CIELAB. From the experiments, we can see that if the q factors for color channels are not very poor5,11 共usually not less than 0.8兲, the proposed technique can give an accurate colorimetric model for vision systems. 6 Conclusions A computational model of color imaging has been established by the colorimetric modeling technique. First of all, we develop the filter-based optical system for estimating spectral responsivities. According to the camera’s spectral responses, the mathematical model of color imaging is determined and then we can evaluate the colorimetric quality factors for the digital camera. In theory, the q factors imply the degree of the correlation between device colors and CIE tristimulus values for human vision. They also indicate the possibility of giving meaningful color representations to an imaging device. That is, if the values of these factors are very low, the performance of color correction is seriously limited due to the poor colorimetric quality. However, most commercially available imaging devices usually have sufficiently large values of the q factors in specific applications, e.g., in video systems or television industry. Therefore, knowing the colorimetric quality is beneficial to this work. In our approach, the colorimetric modeling process primarily involves three methods for color characterization. They are the spectral matching, reference-white luminance determination, and polynomial regression methods. In particular, from the selection of polynomial degree, we see the effectiveness of the first two methods. Specifically, we only need to use lower-degree polynomial regression for color correction. These three methods are expressed by individually specified functions. Then, these functions are incorporated into the mathematical model, with the estimated spectral responses, for camera imaging and consequently the colorimetric model for vision systems is established. Therefore, we can see that the proposed technique achieves a satisfactory accuracy for the colorimetric model.
TCL No.
x
y
Y
1 2 3 4 5 6 7 8 9 10 11 12 13 14 15 16 17 18 19 20 21 22 23 24 25 26 27 28 29 30 31 32 33 34 35 36 37 38 39 40 41 42 43 44 45 46 47 48
0.506 0.492 0.357 0.427 0.390 0.352 0.566 0.310 0.565 0.428 0.450 0.535 0.260 0.380 0.625 0.509 0.521 0.275 0.427 0.425 0.425 0.422 0.421 0.424 0.389 0.371 0.244 0.328 0.260 0.259 0.491 0.208 0.436 0.270 0.374 0.463 0.187 0.307 0.513 0.438 0.346 0.196 0.307 0.306 0.305 0.303 0.303 0.302
0.396 0.397 0.362 0.465 0.349 0.440 0.402 0.290 0.350 0.318 0.490 0.432 0.228 0.517 0.330 0.456 0.316 0.371 0.401 0.402 0.401 0.402 0.402 0.400 0.356 0.355 0.257 0.424 0.248 0.352 0.410 0.178 0.312 0.212 0.490 0.444 0.139 0.481 0.318 0.477 0.235 0.259 0.325 0.325 0.322 0.323 0.322 0.320
11.68 41.63 19.40 15.00 25.94 43.40 39.15 12.25 27.42 7.69 50.34 55.62 5.82 24.69 17.85 73.10 25.52 17.89 101.12 65.24 39.07 21.50 9.57 3.27 10.64 39.83 21.64 15.73 27.43 49.34 30.54 13.25 21.49 6.95 49.91 51.20 7.25 26.87 12.05 66.95 20.74 20.91 101.52 67.02 40.28 22.18 9.66 3.45
Journal of Electronic Imaging / October 2000 / Vol. 9(4) / 441 Downloaded from SPIE Digital Library on 04 Feb 2012 to 140.114.195.186. Terms of Use: http://spiedl.org/terms
Chang and Chen
Fig. 10 Comparison between the NTSC-RGB standard and synthesized camera’s spectral responses from the spectral matching.
Fig. 11 The relationship between the reference-white luminance * values. and rms ⌬ E ab
Fig. 13 (a) Distributions of ⌬ L * values corrected with polynomial regressions. (b) Distributions of ⌬ a * values corrected with polynomial regressions. (c) Distributions of ⌬ b * values corrected with polynomial regressions.
␣ˆ 31R S 共 兲 ⫹ ␣ˆ 32G S 共 兲 ⫹ ␣ˆ 33B S 共 兲 ⫽B C 共 兲 .
* values without Fig. 12 Distributions of ⌬ L * , ⌬ a * , ⌬ b * , and ⌬ E ab color correction using polynomial regressions.
共A1c兲
It is reasonably assumed that the noise effect may be negligible if the average of repeated observations from camera outputs is taken for the same incident light and if the mean value of camera noise is zero. For the ith testing incident light T i (), by taking spectral integration on both sides of Eqs. 共A1a兲–共A1c兲 over the visible range 关 1 , 2 兴 , the camera output yields
442 / Journal of Electronic Imaging / October 2000 / Vol. 9(4) Downloaded from SPIE Digital Library on 04 Feb 2012 to 140.114.195.186. Terms of Use: http://spiedl.org/terms
Colorimetric modeling for vision systems
* values with or without color correction Table 5 Comparison of ⌬ E ab (using polynomial regressions) for additional 24 types of colored light. Types of polynomial regression
Normalized * rms ⌬ E ab
* rms ⌬ E ab
* Max. ⌬ E ab
No polynomial regression
0.0872
5.3511
10.7934
Degree 1 Degree 2 Degree 3
0.0380 0.0314 0.0285
2.7328 2.2647 2.0475
6.0596 5.9787 4.8437
* values corrected with polynomial Fig. 14 Distributions of ⌬ E ab regressions.
¯ (i) ⫽B S ⫽1. The manipulation from Eq. 共A4兲 is referred to as the trimming and normalization of device colors.
ˆ TS 关共 R 共Si 兲 ⫺  R 兲 共 G 共Si 兲 ⫺  G 兲 共 B 共Si 兲 关 R 共Ci 兲 G 共Ci 兲 B 共Ci 兲 兴 T⫽M
Appendix B
⫺  B 兲兴 T,
where
R C(i) ⫽ 兰 2 T i ()R C ()d,
⫻d,
and
1
共A2兲
i⫽1, 2,...,N M ,
G C(i) ⫽ 兰 2 T i ()G C () 1
B C(i) ⫽ 兰 2 T i ()B C ()d,
and
1
R (i) S ⫺R
2 ⫽ 兰 2 T i ()R S ()d, G (i) S ⫺  G ⫽ 兰 1 T i ()G S ()d, and 1 2 B (i) S ⫺  B ⫽ 兰 T i ()B S ()d can be obtained from Eq. 共3兲 1
without the effect of camera noise. To normalize the computed camera output from Eq. 共14兲, after the spectral matching, it is found that R TS 关 ¯R 共Si 兲 G ¯ 共Ci 兲 ¯B 共Ci 兲 兴 T⫽M ¯ 共Si 兲 ¯B 共Si 兲 兴 T, R 共Ci 兲 G 关¯
i⫽1 to N M , 共A3兲
R S⫽ 关 m where M R1 m R2 m R 3兴苸R , m R k ⫽ 关 ␣ˆ k1 ␣ˆ k2 ␣ˆ k3 兴 3 (i) ¯ (i) ⫺1 ¯ ⫻( 兺 j⫽1 ␣ˆ k j ) , k⫽1, 2, 3, and R S , G S , and ¯B (i) S are the normalized values of the trimmed camera outputs; e.g., 3⫻3
T
¯R 共Si 兲 ⫽ 共 R 共Si 兲 ⫺  R 兲 / 共 R max⫺  R 兲 ,
共A4兲
and R max represents the full scale of data representation for channel R. The full scales of n-bit unsigned binary numbers for RGB channels are usually equal to 2 n ⫺1. From Eq. ¯ C(i) ⫽B ¯ C(i) ⫽1, if ¯R (i) ¯ (i) 共A3兲, it is obvious that ¯R C(i) ⫽G S ⫽G S * values with or without color correction Table 4 Evaluation of ⌬ E ab (using polynomial regressions) for the 48 types of TCL. Types of polynomial regression
¯ C(i) ¯B C(i) 兴 T苸 R3⫻1, the For the ith normalized vector 关 ¯R C(i) G transformation from NTSC-RGB 共with illuminant D 65兲 to CIEXY Z can be expressed as17,19 ¯ 共Xi 兲 ⫽ 关 ¯X 共Ci 兲 ¯Y 共Ci 兲 ¯Z 共Ci 兲 兴 T V ¯ XV ¯ 共Ci 兲 ⫽MX 关 ¯R 共Ci 兲 G ¯ 共Ci 兲 ¯B 共Ci 兲 兴 T苸 R3⫻1 , ⫽M 共B1兲
i⫽1 to N M , where
冋
册
0.5881
0.1791
0.1832
¯ X ⫽ 0.2897 M 0
0.6056
0.1047 . 1.0209
0.682
¯ C(i) ⫽B ¯ C(i) ⫽1, Eq. 共B1兲 gives unit It is noted that as ¯R C(i) ⫽G luminance, i.e., ¯Y C(i) ⫽1. Obviously, a function ⌽ X (") can be designated for this transformation, i.e., ¯ 共Ci 兲 兲 . ¯ 共Xi 兲 ⫽⌽ X 共 V V
共B2兲
The transformation from the CIEXY Z coordinate (X,Y ,Z) to the CIELAB coordinate (L * ,a * ,b * ) can be formulated as17,19 L * ⫽116f 共 Y /Y 0 兲 ⫺16,
共B3a兲
a * ⫽500关 f 共 X/X 0 兲 ⫺ f 共 Y /Y 0 兲兴 ,
共B3b兲
and
Normalized * rms ⌬ E ab
* rms ⌬ E ab
* Max. ⌬ E ab
No polynomial regression Degree 1
0.1022
6.1457
18.8884
0.0475
2.8586
8.1821
Degree 2 Degree 3
0.0334 0.0267
2.0075 1.7282
4.6846 3.4739
b * ⫽200关 f 共 Y /Y 0 兲 ⫺ f 共 Z/Z 0 兲兴 , where f 共 ␥ 兲⫽
再
冑␥ ,
␥ ⬎0.008 856,
3
7.787␥ ⫹
16 116
,
␥ ⭐0.008 856,
共B3c兲
共B3d兲
Journal of Electronic Imaging / October 2000 / Vol. 9(4) / 443 Downloaded from SPIE Digital Library on 04 Feb 2012 to 140.114.195.186. Terms of Use: http://spiedl.org/terms
Chang and Chen
X 0 , Y 0 , and Z 0 are the tristimulus values of illuminant D 65 . Specifically, the value of Y 0 is the luminance of this reference white. Similar to Eq. 共B2兲, this transformation can be expressed as a function ⌽ L ("). That is, for the vec¯ X(i) ⫽ 关 ¯X C(i) ¯Y C(i) ¯Z C(i) 兴 T 苸 R3⫻1, we have tor V ¯ 共Xi 兲 兲 , i⫽1 to N M , V共Li 兲 ⫽⌽ L 共 V
共B4兲
where VL(i) ⫽ 关 L C(i) a C(i) b C(i) 兴 T 苸 R3⫻1.
Acknowledgments This work was supported by National Science Council, Taiwan, Republic of China 共R.O.C兲, under Grant No. NSC 87-2213-E-007-060. The first author would like to deeply express his appreciation to both the Optical-Electronics and Systems Laboratory and the Center for Measurement Standards in the Industrial Technology Research Institute 共ITRI兲 for invaluable working experience with them.
References 1. G. Sharma H. J. Trussell, ‘‘Digital color imaging,’’ IEEE Trans. Image Process. 6共7兲, 901–932 共1997兲. 2. M. Jackowski et al., ‘‘Correcting the geometry and color of digital images,’’ IEEE Trans. Pattern Anal. Mach. Intell. 19共10兲, 267–276 共1997兲. 3. M. J. Vrhel and H. J. Trussell, ‘‘Color correction using principle components,’’ Color Res. Appl. 17共5兲, 328–338 共1992兲. 4. C. L. Novak, S. A. Shafer, and R. G. Willson, ‘‘Obtaining accurate color images for machine vision research,’’ in Physics-Based Vision: Principle and Practice-Color, G. E. Healey, S. A. Shafer, L. B. Wolff, Eds., pp. 13–27, Jones and Bartlett, Boston, MA 共1992兲. 5. P. L. Vora and H. J. Trussell, ‘‘Measure of goodness of a set of color-scanning filters,’’ J. Opt. Soc. Am. A 10共7兲, 1499–1508 共1993兲. 6. M. Wolski, C. A. Bouman, J. P. Allebach, E. Walowit, ‘‘Optimization of sensor response functions for colorimetry of reflective and emissive objects,’’ IEEE Trans. Image Process. 5共3兲, 507–517 共1996兲. 7. P. G. Herzog et al., ‘‘Colorimetric characterization of novel multiplechannel sensors for imaging and metrology,’’ J. Electron. Imaging 8共4兲, 342–353 共1999兲. 8. K. Engelhardt and P. Seitz, ‘‘Optimum color filters for CCD digital cameras,’’ Appl. Opt. 32共16兲, 3015–3023 共1993兲. 9. H. R. Kang, ‘‘Color scanner calibration,’’ J. Imaging Sci. Technol. 36共2兲, 162–170 共1992兲. 10. R. J. Green and S. J. Ismail, ‘‘Color error reduction in video systems,’’ IEEE Trans. Broadcasting, 36共1兲, 99–107 共1990兲. 11. S. Suzuki, M. Tsuda, and M. Mori, ‘‘A filter-alternating color scanner,’’ Fujitsu Sci. Tech. J. 25共4兲, 279–286 共1990兲. 12. Y. C. Chang and J. F. Reid, ‘‘RGB calibration for color image analysis in machine vision,’’ IEEE Trans. Image Process. 5共10兲, 1414– 1422 共1996兲.
13. G. E. Healey and R. Kondepudy, ‘‘Radiometric CCD camera calibration and noise estimation,’’ IEEE Trans. Pattern Anal. Mach. Intell. 16共3兲, 267–276 共1994兲. 14. M. J. Vrhel and H. J. Trussell, ‘‘Color device calibration: a mathematical formulation,’’ IEEE Trans. Image Process. 8共12兲, 1796– 1806 共1999兲. 15. R. Lenz, P. Meer, M. Hauta-Kasari, ‘‘Spectral-based illumination estimation and color correction,’’ Color Res. Appl. 24共2兲, 98–111 共1999兲. 16. G. W. Chang and Y. C. Chen, ‘‘Spectral estimation of color CCD cameras,’’ in Input/Output and Imaging Techniques, Proc. SPIE 3422, 81–91 共1998兲. 17. J. A. C. Yule, Principles of Color Reproduction, Wiley, New York 共1967兲 共reprinted in 1989兲. 18. W. N. Sproson, Color Science in Television and Display Systems, Adam Hilger Ltd., Bristol 共1983兲. 19. G. Wyszecki and W. S. Stiles, Color Science—Concepts and Methods, Quantitative Data and Formulae, Wiley, New York 共1982兲. 20. G. H. Golub and C. F. Van Loan, Matrix Computations, 2nd ed., John Hopkins University Press, Baltimore 共1989兲. 21. C. L. Lawson and R. J. Hanson, Solving Least Squares Problems, Prentice-Hall, Englewood Cliffs, NJ 共1974兲. 22. A. V. Oppenheim and R. W. Schafer, Discrete-Time Signal Processing, Prentice Hall, Englewood Cliffs, NJ 共1989兲. Gao-Wei Chang graduated from National Taipei Institute of Technology, Taipei, R.O.C., in 1985 and received an MS degree in the Department of Electrical Engineering of National Tsing Hua University (NTHU), Hsinchu, Taiwan, in 1991. He is currently a Ph.D. student in NTHU. From 1991 to 1995, he was an electronics engineer in charge of color image processing in the Opto-Electronics and Systems Laboratory of Industrial Technology Research Institute (ITRI), Taiwan. From 1995 to 1998, he was an optoelectronics engineer in the Optical Metrology Laboratory of the Center for Measurement Standards, ITRI, Taiwan. His research interests include color image processing, electro-optical systems, automatic testing and measurement systems, and artificial intelligence. Yung-Chang Chen received BS and MS degrees in electrical engineering from the National Taiwan University, Taipei, in 1968 and 1970, respectively, and Dr.Ing. degree from Berlin Technical University, Berlin, Germany, in 1978. Since 1978, he has been with the Department of Electrical Engineering, National Tsing Hua University, Taiwan, R.O.C., where he is currently a professor. His research interests are image processing, pattern recognition, signal processing, medical image processing, and video coding.
444 / Journal of Electronic Imaging / October 2000 / Vol. 9(4) Downloaded from SPIE Digital Library on 04 Feb 2012 to 140.114.195.186. Terms of Use: http://spiedl.org/terms