John E. Fischer,b and Agnes Clayeb. aDepartment of Chemistry ...... 193, Gordon and Breach Science Publishers, Australia 2000. 6. J. S. Xue and J. R. Dahn, ...
Journal of The Electrochemical Society, 148 共6兲 A525-A536 共2001兲
A525
0013-4651/2001/148共6兲/A525/12/$7.00 © The Electrochemical Society, Inc.
Comparison Between the Electrochemical Behavior of Disordered Carbons and Graphite Electrodes in Connection with Their Structure J. S. Gnanaraj,a M. D. Levi,a,* E. Levi,a G. Salitra,a D. Aurbach,a,* John E. Fischer,b and Agnes Clayeb a
Department of Chemistry, Bar-Ilan University, Ramat-Gan 52900, Israel Department of Materials Science and Engineering and Laboratory for Research on the Structure of Matter, University of Pennsylvania, Philadelphia, Pennsylvania 19104-6272, USA
b
This work relates to a rigorous study of the surface chemistry 共Fourier transform infrared, X-ray photoelectron spectroscopy兲, crystal structure 共X-ray diffraction兲, galvanostatic, cyclic voltammetric, and impedance behavior of lithiated carbon electrodes in commonly used liquid electrolyte solutions. Two different types of disordered carbons and graphite, as a reference system, were explored in a single study. All three types of carbons develop a similar surface chemistry in alkyl carbonate solutions, which are dominated by reduction of solvent molecules and anions from the electrolyte. The differences in the crystal structure of these carbons lead to pronounced differences in the mechanisms of Li insertion into them. Whereas Li-ion intercalation into graphite is a staged process, Li-ion insertion into the disordered carbons occurs in the form of adsorption on both sides of the elementary graphene flakes and on their edges. The electroanalytical behavior of the disordered carbons was found to correlate well with their unique structure described in terms of the butterfly model. Both types of the disordered carbons reveal exceptionally good cyclability in coin-type cells 共vs. Li counter electrodes兲, with only moderate capacity fading. Highly resolved plots of the chemical diffusion coefficient of Li-ions, D vs. potential E, for the disordered carbon electrodes were obtained. Surprisingly, a maximum in D appears on these plots at intermediate levels of Li-ion insertion corresponding to ca. 0.4-0.5 V 共vs. Li/Li⫹兲. We propose that these maxima may originate from a combination of two effects, 共i兲 repulsive interactions between the inserted species, and 共ii兲 pronounced heterogeneity of Li insertion sites in terms of carbon-Li interactions and Li-ion mobility. © 2001 The Electrochemical Society. 关DOI: 10.1149/1.1368096兴 All rights reserved. Manuscript submitted October 2, 2000; revised manuscript received February 3, 2001.
Carbonaceous materials for Li-ion batteries, which are currently available from different commercial and laboratory sources, belong to two major classes: graphitic and nongraphitic 共disordered兲 carbons.1 While Li-ion intercalation into graphitic carbons has been extensively studied during the last 20 years2 共since this phenomenon was first observed in the mid-1970s3兲, much less information has been obtained on the nature of Li-ion insertion into disordered carbons. These carbons may find attractive applications as anodes for Li-ion batteries for two reasons: First, typical synthetic routes for their fabrication consist of pyroloysis of organic polymers or hydrocarbon precursors at temperatures below 1500°C.4 Therefore, by varying the nature of the precursors and the temperature, many different carbonaceous materials with different properties can be obtained. Secondly, some of these materials demonstrated a very high reversible capacity of Li-ion insertion in the range of 400-1000 mAh/g,5 which is higher than that of Li-ion intercalation into graphitic carbons 共⬍372 mAh/g兲. Depending on the nature of the precursor, the disordered carbons may reveal different properties after heat treatment in the temperature range from 1500 to 3000°C. Such treatment may result in either a graphite-like structure and the corresponding electrochemical behavior typical of graphite 共so-called soft carbons兲 or, alternatively, may show no indication to conversion into graphite, and thus preserve their disordered structure 共hard carbons兲. Dahn et al.6 recently reported on the electrochemical behavior of some disordered carbons, which showed relatively high reversible capacities with respect to Li-ion insertion reactions. These scientists also found a correlation between the electrochemical behavior of these materials with the so-called R parameter. This parameter, the reciprocal of which is a semiquantitative measure of the number of carbon atoms located in the isolated graphene flakes, is defined as the ratio of the intensity of the 共002兲 X-ray diffraction 共XRD兲 peak to that of the diffuse background.7 Recently, Fischer et al.8 conducted a careful study of the local structure of the disordered carbons produced by Mitsubishi Chemical Corporation 共MCC兲. Using a variety of structural analysis tech-
* Electrochemical Society Active Member.
niques, they concluded that the basic structural units in the disordered carbons are small planar hexagonal graphene fragments whose size approximates 10 Å. These fragments are hinged together at different angles, thus eliminating dangling bonds, forming a butterfly-like structure. Thus, the structure of the disordered carbons is obviously different from the structure of the graphitic carbons, which have a highly ordered layered structure.9 The primary goal of the research described in this paper was to conduct a basic electroanalytical characterization of two different disordered carbons in commonly used electrolytic solutions and to compare their behavior with that of graphitic carbons. We simultaneously applied basic electroanalytical techniques: slow scan rate cyclic voltammetry 共SSCV兲, potentiostatic intermittent titration 共PITT兲, and electrochemical impedance spectroscopy 共EIS兲, that was previously conducted for the characterization of graphite10 and transition metal oxides electrodes.11 Our second goal was to correlate the basic electroanalytical characteristics of the disordered carbons. These characteristics include reversible and irreversible specific capacity, chemical diffusion coefficient of Li ions, chargetransfer resistance, and bulk ionic conductivity of the insertion electrodes, with their amorphous structure and the surface films formed as a result of electrochemical reduction of solution species. Surface analysis of the electrodes was performed ex situ using Fourier transform infrared spectroscopy 共FTIR兲 and X-ray photoelectron spectroscopy 共XPS兲. Complementary structural analysis was performed by X-ray diffraction 共XRD兲. Experimental All the work was performed under a highly pure argon atmosphere in standard glove boxes from VAC Inc. Two types of disordered hard carbons, denoted below as NX-1 and NX-4, from Mitsubishi Inc., Japan, were used for the preparation of composite electrodes containing 90 wt % of either carbonaceous material and 10 wt % of poly共vinylidene fluoride兲 共PVDF兲 binder 共Solvey Inc兲. These disordered carbons were produced by heat treatment of coal tar pitch at 1100 and 700°C, and differ from each other by the H/C ratios of 0.04 and 0.13 for NX-1 and NX-4, respectively. Measurements of Brunauer-Emmett-Teller 共BET兲 surface area were performed using nitrogen adsorption/desorption isotherms using a Mi-
A526
Journal of The Electrochemical Society, 148 共6兲 A525-A536 共2001兲
crometrics Inc. Gemini 2375 model surface analyzer. Each sample was heated at 150°C for 2 h before measuring. The surface area for NX-1 was found to be 0.935 m2/g and 1.28 m2/g for NX-4, compared with 20 m2/g for the graphite particles used 共KS-6, Timcal Inc.兲. At first glance, the graphite particles, composed of nonporous materials, surprisingly have a surface area of almost twenty times higher than the surface area of the disordered carbons, which are supposed to be porous. We assume that a major part of the pores of the disordered carbons are too small to affect the nitrogen adsorption/desorption processes used for the BET area estimations. We can also assume that pores that are too small to absorb N2 molecules 共⬍4 Å兲12 will be too small to affect the surface chemistry of these carbons, i.e., such small pores cannot accommodate the surface species formed on the carbon electrodes at low potentials. The graphite particles used 共KS-6兲 are very thin platelets, whose specific surface area 共per gram兲 is much higher than the surface area of spherical particles of similar dimensions 共6 m average particle size兲. The preparation of the composite carbon electrodes was already described.10,11 The electrodes’ current collectors were copper foils 共ca. 1 ⫻ 1 cm surface area兲 covered on both sides with a thin layer of the active mass, a few milligrams of carbon per electrode. The electrodes were preliminarily dried at 120°C for 1 h, were carefully pressed in a rolling machine, and were then dried again at 120°C for 2 h before use. The electronic conductivity of disordered carbon is lower than the conductivity of graphite. However, since we used very thin electrodes, characterized by relatively slow electroanalytical tools, no additional conductive additive 共e.g., carbon black兲 was needed in the prepared electrodes. All the electroanalytical characterizations of the electrodes were performed in a three-electrode cell, in which the working electrode, surrounded symmetrically on both sides by a Li counter electrode foil, was held in the center of a parallel plate polyethylene cell. A Li-wire reference electrode was placed close to the working electrode. Long-term cycling of the carbon electrodes was conducted in coin-type cells 共 19 mm兲 consisting of the working electrode and a Li counter electrode, separated by a porous polypropylene membrane 共Celgard 2400兲. These cells were hermetically sealed in a dry air-filled glove box using the 2325 coin cell crimper system 共NRC/ ICPET, Canada兲. Highly pure alkyl carbonate solvents 关ethylene carbonate 共EC兲, dimethyl carbonate 共DMC兲, etc. were obtained from Merck KGaA兴, were used as received. LiAsF6 was obtained from Lithco Inc., LiPF6 was obtained from Hashimoto Inc., and LiC共SO2CF3兲3 was obtained from Covalent Inc. The electrochemical characterizations and longterm cycling were usually performed using 1 M LiAsF6 solutions in a 1:1 mixture 共by volume兲 EC-DMC. Prior to assembling the cells, the electrodes, which may be porous, were evacuated and then impregnated with solution under vacuum in a special vessel. This procedure was used to ensure the complete wetting of their active mass. An EG&G model 273 potentiostat was used for the SSCV and PITT measurements. In the PITT measurements, the electrodes were polarized for 2 h at each potential step. The amplitude of the steps was 0.1 V. Impedance spectra were measured using Schlumberger’s model 1286 electrochemical interface and model 1255 frequency response analyzer driven by the Corrware software from Scribner Associates 共Pentium II IBM PC兲. Impedance characterization of the disordered carbons was related to the same potentials for which intermittent titration was applied. The amplitude of the ac voltage was 3 mV. For surface analysis studies, we used a Magna 860 共Nicolet兲 FTIR spectrometer placed in a glove box under H2O and CO2-free atmosphere 共compressed air was treated by a Balston Inc. air purifier兲. The carbon electrodes were analyzed by diffuse reflectance mode 共a DRIFT accessory from Harrick Inc.兲, as already reported.13 XPS characterizations of the carbon electrodes were conducted using the AXIS HS XPS spectrometer from Kratos Analytical Inc. 共England兲. The samples were transferred from the glove boxes to the spectrometer by a homemade transfer system that includes a gate valve and magnetic manipulator from Norcal Inc. 共USA兲. This sys-
tem ensures full protection from exposure to atmospheric contaminants. XRD characterizations were conducted using a Brucker D8 advance diffractometer equipped with a Gobel mirror and a Cu K␣ radiation source. A simple, nondestructive method was used for analyzing the hydrogen content in the disordered carbons, namely, prompt gamma activation analysis 共PGAA兲. The PGAA method is based on the fact that many nuclei emit characteristic gamma rays from the excited state upon slow neutron capture. H captures a neutron to form an excited state of the deuteron, which decays within milliseconds by emitting a 2223.23 keV gamma ray.14 The cross section for H is particularly large, so H/C ratios below 0.1 can be accurately determined.15 Results and Discussion General features of Li-ion insertion into NX-1 and NX-4 disordered carbons and the formation of the passivation surface films during their first discharge.—Figure 1a and b compare three galvanostatic discharge and charge curves obtained from thin composite electrodes based on NX-1 and NX-4 disordered carbons, respectively 共C/10 rate, 34 mA/g兲. Table I presents the calculated specific charge and discharge capacities typical for the first six cycles. As indicated in Fig. 1a and b, only for the first discharge does a small plateau appear around 1.1 V 共vs. Li/Li⫹兲 on the corresponding galvanostatic curves. At approximately the same potential, a similar plateau in the first discharge was also reported for graphite electrodes.16 Table I shows that initially both the charge and discharge capacities of NX-1 and NX-4 electrodes are considerably larger than the theoretical capacity of the graphite electrode, 372 mAh/g. The irreversible capacity for the disordered carbons, calculated by dividing of the difference between the first discharge and charge capacity by the first discharge capacity, is equal to 12.7 and 34.5% for NX-1 and NX-4, respectively. Despite the fact that in the case of the graphite
Figure 1. First three galvanostatic discharge/charge curves measured from the 共a兲 NX-1 and 共b兲 NX-4 electrodes. The conditions of cycling are indicated. The electrode area was 1 cm2 and their mass was ⬇3.3 mg/cm2.
Journal of The Electrochemical Society, 148 共6兲 A525-A536 共2001兲
A527
Table I. Discharge „Li insertion… and charge „Li deinsertion… capacities for the disordered carbon electrodes obtained at a CÕ10 rate „galvanostatic cycling, 34 mAÕg…, LiAsF6 1 MÕEC-DMC 1:1 solution. Capacity 共mAh/g兲 NX-1 Cycle number 1 2 3 4 5 6
NX-4
Discharge
Charge
Discharge
Charge
557.0 383.0 367.8 357.1 354.4 350.4
486.4 381.0 357.6 341.6 341.0 338.2
878.0 528.0 494.0 496.0 490.4 480.0
575.3 500.0 480.0 477.6 464.0 464.0
electrode, the irreversible capacity of almost 32%17 is comparable with the capacity for NX-4, we note a difference in their cycling behavior. The practical, reversible capacity of graphite electrodes, which usually approximates 350 mAh/g, is obtained initially 共during the first cycles兲, after which a continuous, moderate capacity fading may be observed during prolonged cycling. In contrast, in the case of the disordered carbons, a pronounced capacity fading is recorded during the first few cycles, after which the capacity fading recorded during prolonged cycling is very moderate. At first glance, the graphite electrodes surprisingly have an irreversible capacity of the same order of magnitude as that of the disordered carbons, although the BET surface area of the graphite particles is twenty times higher than the BET surface area of the disordered carbon particles. This can be explained by the fact that the disordered carbons are isotropic in terms of their surface reactions with the solutions 共which lead to the irreversible capacity16兲. Their visible area should be reactive with solution components at low potentials. In contrast, the active surface area of graphite consists mostly of the facets of these thin platelet-shaped particles, which are perpendicular to the basal planes 共only a small part of the total surface area of the graphite particles兲. The flat, large facets of the graphite particles 共i.e., the basal planes兲, which are the major contributors to their large surface are scarcely electrochemically active. This lower activity of the basal planes, compared with the planes’ edges, was already evident from recent scanning tunnel microscope and atomic force microscope studies of highly ordered pyrolytic graphite electrodes polarized to low potentials in Li salt solutions.18,19 Figure 2a and b compare families of the consecutive cyclic voltammograms 共CVs兲 obtained from NX-1 and NX-4 disordered carbons, respectively, at different scan rates. The first three cycles were measured at the same scan rate of 1 mV/s. These three cycles show basically the same trend as the galvanostatic cycling: The first discharge 共lithiation process兲 shows a larger capacity compared with the capacity for the first charge 共delithiation兲. In addition, the first lithiation process clearly shows two potential regions in which reduction of solution species takes occurs: The first process relates to the region approximating 1.0 V 共vs. Li/Li⫹兲, whereas the second reduction process starts at ca. 0.7-0.8 V 共vs. Li/Li⫹兲 and extends down to 0 V 共vs. Li/Li⫹兲. It was interesting to compare the cyclic voltammetric behavior of the disordered carbons with the behavior of a reference graphite electrode 共Fig. 3兲. A common behavioral feature of all three electrodes is the peak at approximately 1.1-1.00 V 共vs. Li/Li⫹兲. This peak was previously assigned 共for the graphite electrode兲 to the reduction of solvent molecules and salt anions 共e.g., AsF⫺ 6 reduction to LiF and Lix AsFy species (0 ⬍ x,y ⬍ 3). 16 On decreasing the potential of the graphite electrode 共Fig. 3兲, a continuous reduction wave with a flat maximum between 0.5 and 0.6 V 共vs. Li/Li⫹兲 was recorded, attributed to further continuous reduction of solution components. However, from careful examination of the CVs shown in
Figure 2. Families of consecutive cyclic voltammetric curves measured from 共a兲 NX-1 and 共b兲 NX-4 electrodes at different scan rates: 1, 0.5, 0.1, and 0.05 mV/s. The first three cycles were measured at the same scan rate, 1 mV/s. The scan rates are indicated. The electrode area was 1 cm2, 7.4 mg/cm2 for NX-1, and 6.93 mg/cm2 for NX-4.
Fig. 3, one can reach the following conclusion: The formation of the surface layer on graphite is almost completed during the first cathodic process of a pristine electrode polarized from open-circuit voltage 共OCV兲 ⬇3 V 共vs. Li/Li⫹兲 to the foot of Li intercalation into graphite 共⬍0.3 V vs. Li/Li⫹兲. In contrast, both disordered carbons, NX-1 and NX-4, show a continuous reduction wave related to the reduction of solution species extending from 0.8 V 共vs. Li/Li⫹兲 to very low potentials, close to 0 V vs. Li/Li⫹. The above difference in the first cathodic polarization of the disordered and graphitic carbon electrodes can, in principle, be explained in two different ways: 共i兲 The products of the electrochemical reduction of solution components are different for these electrodes, or 共ii兲 Although the products are chemically the same, the morphology of the surface films for the disordered carbons is less compact, compared with the morphology of the films on graphite electrode. Thus, the surface films initially formed on the disordered carbons at low potentials are less passivating 共e.g., thicker surface films are needed in order to block electron transfer from lithiated disordered carbon to solution species, compared with graphite兲. In order to understand the surface processes of the carbon electrodes in solutions, we applied FTIR and XPS techniques for the study of carbon electrodes before and after electrochemical processes 共galvanostatic cycles in the potential range of 0.005-3 V vs. Li/Li⫹兲. Figure 4a shows FTIR spectra measured in a diffuse reflection mode from the NX-1 and NX-4 pristine powders and graphite. These spectra clearly demonstrate the presence of some functional
A528
Journal of The Electrochemical Society, 148 共6兲 A525-A536 共2001兲
Figure 3. First three cyclic voltammetric curves measured from a composite synthetic graphite electrode at a scan rate of 1 mV/s. The scan rates are indicated. The electrode area was 1 cm2, 3.5 mg/cm2.
groups on their surfaces. These groups include OH, C⫽O, and, probably, COOH. Qualitatively, from these spectra the concentration of the surface groups apparently is higher on the disordered carbon than on the graphite. XPS measurements of the pristine powders correlate with this finding, and provide a more qualitative picture. The atomic percentage of surface oxygen in pristine powders is 5.78, 6.36, and 5.0% for NX-1, NX-4, and graphite, respectively. As is indicated in Fig. 4b, after continuous cycling, a considerable change in the surface layer composition occurs. All three spectra appear similar and reflect the formation of surface films comprised of ROCO2Li and Li2CO3. The following characteristic absorptions can be recognized in these spectra: 2930-2850 cm⫺1 ( C-H), 18001780 and 1100-1200 cm⫺1 共residual EC兲, 1650 cm⫺1 ( C⫽O,AS), 1450-1400 cm⫺1 (␦ CH2), 1320-1290 cm⫺1 ( C⫽O,S), 1100-1070 cm⫺1 ( C⫽O), 840-820 cm⫺1 (␦ OCO2), 20 and 1520-1480 and 875 cm⫺1 (Li2CO3). 21 The most probable ROCO2Li species in the surface films is (CH2OCO2Li) 2 , the major reduction product of EC.17 As already discovered,20-22 the pronounced Li2CO3 peaks appearing often in FTIR spectra of the surface films formed on carbons in alkyl carbonate solutions 共see as an example the spectra in Fig. 4b兲, are due to unavoidable reactions of the ROCO2Li surface species formed initially, with trace water 共at the ppm level兲, in the glove box and the spectrometer atmospheres. Figure 4c shows FTIR spectra measured from NX-4 electrodes polarized to different low potentials 共1.0, 0.7, and 0.01 V兲 in ECDMC 1:3/LiAsF6 1 M solutions. These spectra may reflect different stages of the surface film formation, which may be dependent on the electrode potential. The three spectra in Fig. 4c are qualitatively similar. While their resolution is poor, due to the usual limitation of surface analysis by the diffuse reflectance mode, the spectra show distinguishable peaks of ROCO2Li species at approximately 16501650 cm⫺1 ( CO), 1450-1400 cm⫺1 (␦ CH2 ,CH3), ⬇1300 cm⫺1 ( CO), 1100-1100 cm⫺1 ( C-O), and 840 (␦ CO3, ROCO2Li). 20-22 The peaks at 1190 and 880 cm⫺1 belong to PVDF and CO3, respectively. The ␦ CH2 peaks at 1450-1400 cm⫺1 seem to be superimposed
Figure 4. FTIR spectra 共diffuse reflectance mode兲 measured from pristine powders 共a兲 and the electrodes after 10 cycles; 共b兲 based on the disordered carbons NX-1, NX-4 and synthetic graphite; 共c兲 FTIR spectra measured from a NX-4 electrode after different stages of surface film formation 共polarization of pristine electrodes to different low potentials, as indicated兲. EC-DMC 1:1/LiAsF6 1 M solution.
on the broad Li2CO3 peak 共1520-1450 cm⫺1兲.21-22 Similar spectra were obtained from NX-1 electrodes after similar treatment. These spectral studies show that there is no pronounced potential effect on the product distribution of the solvent reduction process. Below 1.5 V vs. Li/Li⫹, the alkyl carbonates can be reduced on noble metals or carbon electrodes in the presence of Li-ions.23 This process intensifies as the potential decreases. The mechanisms of these reduction processes, which form ROCO2Li species with the two carbonate groups in the case of EC and propylene carbonate, and a mixture of ROCO2Li and ROLi species in the case of open chain alkyl carbonate solvents 关e.g., diethyl carbonate 共DEC兲, DMC, 共EMC兲兴, have already been discussed in detail.24 Li2CO3 can either be formed by further electron transfer from the lithiated carbon to
Journal of The Electrochemical Society, 148 共6兲 A525-A536 共2001兲
A529
Figure 5. XPS spectra of C 1s, F 1s, and As 3d from NX-1 electrodes after one cycle in 1 M LiAsF6 ECDMC 共1:1兲, and C 1s and F 1s spectra of pristine electrodes, as well as an As 3d spectrum of a pristine electrode stored in solution for 24 h at OCV for comparison.
the ROCO2Li species in the surface films, or by reactions of these species with trace water to form Li2CO3, CO2, and ROH.16,21,22,24 We also studied the surface chemistry of the disordered carbons in EC-DMC solutions containing LiPF6 or LiC共SO2CF3兲3 as the electrolytes, in similar experiments as described above, and we obtained closely similar spectral results. That is, the FTIR spectra of these electrodes reflect the formation of ROCO2Li species as the dominant components of the surface films formed on the carbons. The products of the reduction of the electrolyte anions 共e.g., AsF⫺ 6兲 cannot be detected easily using FTIR. In order to identify their chemical nature, we used the XPS technique. Figure 5 shows XPS spectra related to the C 1s, F 1s, and As 3d of a NX-1 electrode after one galvanostatic cycle between 3.0 and 0.005 V 共vs. Li/Li⫹兲 in 1 M LiAsF6 EC-DMC 1:1 solution. C 1s and F 1s spectra of the pristine NX-1 electrode 共containing 5% PVDF兲 are also presented in this figure for comparison. In addition, an As 3d spectrum from an electrode stored during 24 h at OCV, and then washed with pure DMC
is shown. Some peak deconvolutions25,c are presented in the C and F spectra in order to demonstrate the various oxidation states of the carbon and the fluorine atoms in the surface films. In addition to the graphitic carbon peak at approximately 285 eV, the XPS spectra of pristine electrodes have small, broad C 1s peaks between 286-290 eV related to oxygen-containing surface groups 共e.g., carbonyl, hydroxyl兲. In addition, the C 1s spectra show a carbon peak at 291 eV that belongs to the PVDF binder. The F 1s peak of pristine electrodes is characteristic of the fluorine of the PVDF binder 共688 eV兲. Electrodes stored in solutions at OCV conditions do not have any other peaks in addition to C 1s, F 1s, and O 1s peaks. This finding means that our general sample preparation procedure 共e.g., washing with DMC and drying兲 removes the residual c Deconvolution of the spectral features in this work was carried out using Vision 2 software 共Kratos Analyticall Inc., Manchester, U.K.兲. The peak fitting procedures, using Lorentian-Gaussian peak shape 76:30, were performed after ‘‘simple’’ background subtraction. No curve smoothing was done.
A530
Journal of The Electrochemical Society, 148 共6兲 A525-A536 共2001兲
salts that are soluble in the solvents. Hence, only insoluble species are expected to remain in the samples measured by XPS. XPS spectra of electrodes, after cycling in DMC-EC solutions containing LiAsF6, LiPF6, or LiC共SO2CF3兲3, have the typical C 1s spectrum presented in Fig. 5, and which usually can be deconvoluted to five peaks at 285 eV 共elementary carbon兲, 286-287 eV (C-O), 290 eV 26 (-OCO⫺ 2 , carbonate carbon兲, and 291 eV 共PVDF兲. The F 1s spectrum of cycled electrodes can usually be deconvoluted to four peaks at 685 eV 共LiF兲, 688 eV 共PVFD兲, and peaks between 685 and 688 eV 共Fig. 5兲. The peaks between 685 and 688 eV are attributed to species such as Lix AsFy or Lix PFy when LiAsF6 or LiPF6 are the salts, respectively. XPS spectra of electrodes treated in LiAsF6 solutions show typical broad arsenic peaks 共see, for example, the As 3d spectrum in Fig. 5兲 that are attributed to Lix AsFy species, products of AsF⫺ 6 reduction. The electrodes treated in LiPF6 and LiC共SO2CF3兲3 solutions have pronounced P and S spectra, respectively. Hence, the XPS measurements correlate with the FTIR measurements, showing that the surface films on the carbons contain carbonates as the major constituents. In addition, salt anion reduction processes contribute surface species such as LiF, Lix AsFy , Lix PFy , or various insoluble reduction products of the SO2CF3 group.27 Qualitatively, similar FTIR and XPS results were earlier reported for similarly treated graphite electrode.13 Thus, we conclude that the chemical composition of the passivating surface layers formed on the disordered and the graphitic carbon electrodes is very similar. The lower potentials required for the stabilization of the surface layers on disordered carbon particles compared with that of graphite 共during the same galvanostatic or potentiostatic cathodic polarization of pristine electrodes兲 can be attributed to the morphology of the disordered carbons. We assume that the bulk structure of the disordered carbon particles is less favorable for the formation of the compact surface films needed for passivation, as compared with graphite electrodes. Possible Li-storage mechanisms for the disordered carbons in comparison with the Li-intercalation mechanism for graphite.—Figure 2a and b also show the evolution of cyclic voltammetric curves measured at gradually decreasing scan rates for the disordered carbon NX-1 and NX-4 electrodes. In both cases, as the scan rate decreases, the cathodic branch of the curve becomes a monotonously increasing current; the anodic branch takes the form of a flat peak within the potential range 0.1-0.5 V 共vs. Li/Li⫹兲. Studies of Li-storage mechanisms for intercalation electrodes require an analysis of the SSCV responses at very low scan rates. This analysis is needed in order to avoid nonhomogeneous charging of the porous composite electrodes, and to reduce or completely eliminate the influence of Li-ion solid-state diffusion kinetics. In Fig. 6a, we present as an example, two SSCV curves measured at ⫽ 50 and 10 V/s scan rates from an NX-1 disordered carbon electrode. Two different potential domains can be distinguished on these curves. Within the potential region from 1.5 to 0.4 V 共vs. Li/Li⫹兲, the voltammograms reflect a pseudocapacitive process 共slowly increasing cathodic and anodic currents during discharge and charge, respectively兲. At higher scan rates, this region contains very broad peaks around 0.5 V 共vs. Li/Li⫹兲, as shown in Fig. 2a. In the second domain, a kinetically limited process of Li insertion/deinsertion occurs very close to the potential of a reversible Li electrode. Figure 6a indicates that as the scan rate decreases, the anodic peak shifts towards less positive values from 80 to 50 mV 共vs. Li/Li⫹兲. However, even at the lowest scan rate, there is no indication of any cathodic peak. The cathodic currents at the lowest potentials approximating 0. V 共vs. Li/Li⫹兲 cannot be ascribed to parasitic cathodic background reactions, since, as the potential ceased during the sweep, the current rapidly decreased to zero. The shape of the SSCV curves for the disordered carbons is quite different from that of the graphite electrode 共Fig. 6b兲. Three welldefined cathodic/anodic pairs of peaks 共very narrow at small scan rates兲 reflect the staging mechanism during the course of Liintercalation into graphite.28 Electrochemical intercalation of Li ions
Figure 6. A family of consecutive cyclic voltammetric curves measured from an 共a兲 NX-1 electrode and 共b兲 graphite at different scan rates: 0.05 and 0.01 mV/s, as indicated. The electrode area was 1 cm2, 3.3 mg/cm2.
into graphite can be quantitatively described in terms of lattice gas models with high attractive interactions between the intercalation sites.29 Of course, these models are too simple for providing overall modeling and simulation of the entire staging processes during Li insertion into graphite. The staged Li insertion processes into graphite are also affected by long range repulsion interactions between the Li layers inserted into the carbon.30 However, the use of a simple gas lattice model emphasizing the short range attractive interactions among the Li insertion sites 共which indeed lead to the formation of stages, namely, compact Li layers between graphene planes兲, was found to be very useful in describing the first order phase transition through which Li is inserted into graphite. This model was also useful in describing the voltammetric behavior and the dependence of the diffusion coefficient on the potential thus found.28,29 The small size of the elementary graphene flake fragments of the disordered carbons 共packed in a butterfly-like structure兲31 and the lack of long-range order 共with respect to the c direction兲 between the individual butterflies32 completely preclude staging phenomenon during Li insertion into the disordered carbons. Rather, Li ions are adsorbed on both sides of the graphene flake. Since one can expect a broad distribution of the adsorption site energies in the disordered carbons, the resulting peaks on the SSCV are also expected to be very broad. Furthermore, both the sites on the graphene flakes and the carbon atoms, which are terminated by hydrogen atoms originating from precursors,31 have the capacity to retain Li ions, Indeed, the H/C ratios found, 0.04 and 0.13 for NX-1 and NX-4, respectively, correlate to the higher reversible capacity of NX-4 as compared with NX-1 共see Table I兲.
Journal of The Electrochemical Society, 148 共6兲 A525-A536 共2001兲
Figure 7. XRD patterns related to the 002 planes measured ex situ for synthetic graphite and disordered carbons NX-1 and NX-4. 共a兲 XRD patterns of a fully lithiated disordered carbon NX-1 electrode are also presented. 共b兲 Interlayer distances corresponding to the peaks are also indicated.
The above description is supported by XRD measurements of these carbons. Figure 7a shows XRD patterns for the disordered carbons 共NX-1 and NX-4兲 and for graphite. The broad pseudoBragg 002 peaks for NX-1 and NX-4, compared with that of graphite, show that a short-range order is the dominant feature of the structure of the disordered carbons. The fact that they are broader and occur a higher d values than graphite results from a combination of slightly larger average interflake separation, nonparallelism between the flakes, and a limited number 共of the order of 2-20兲 coherent flakes in a nanoparticle.31 In Fig. 7b, we compare ex situ XRD patterns of the pristine and fully intercalated NX-1 electrodes 共the Cu peak serves as a reference兲. The Li-induced ‘‘expansion,’’ as measured by the downshift of the 002 peak, is about two thirds that of the corresponding expansions in fully intercalated crystal graphite. This indicates that while Li intercalation of disordered carbons is qualitatively similar to graphite, the detailed atomic scale structural changes may also include changes in the interflake correlations upon lithiation. The voltammetric behavior of these carbons presented above seems to nicely reflect the above model of Li insertion into the disordered carbons, which contain a variety of different types of Li insertion sites. The preclusion of attractive interactions between the inserted Li ions in the electrode’s bulk is another obvious consequence of the small size of the elementary graphene limits within these carbons, and the lack of long-range order with respect to the c direction. As
A531
Figure 8. Plots of the differential insertion 共deinsertion兲 capacity C int vs. potential obtained for the disordered carbons NX-1 共a兲 and NX-4 共b兲. C int was calculated from the corresponding SSCV curves 共 ⫽ 50 V/s solid lines兲, and from the PITT measurements 共circles兲 共Eq. 2 and 1, respectively兲. The electrode area was 1 cm2, 3.33 mg/cm2 for NX-1 and 3.15 mg/cm2 for NX-4.
a result of this, the corresponding SSCV curve becomes broader 共as shown above兲, and a unique dependence of the chemical diffusion coefficient of Li ions on the potential may be expected for the disordered carbons. Chemical diffusion coefficient and specific conductivity of Li ions in the disordered carbons.—The diffusion coefficient of Li insertion into the carbons as a function of the potential was calculated from PITT. The potential range between 1.5 and 0.005 V 共vs. Li/Li⫹兲 was divided into steps of 0.1 V, and the potentiostatic titration was performed after equilibration of the electrode at each predefined potential for at least 2 h. The resulting chronoamperometric curves were numerically integrated for each applied step. From the calculated charge, ⌬Q, the differential Li insertion capacitive, C int(E) can be obtained C int共 E 兲 ⫽ ⌬Q 共 E 兲 /⌬E
关1兴
which is an important equilibrium characteristic of an insertion electrode. The plots of C int vs. E obtained experimentally using Eq. 1 can be directly compared with the SSCV curve normalized by the scan rate, C int共 E 兲 ⫽ I SSCV共 E 兲 /
关2兴
At very low scan rates, C int(E) should be independent of , if the related intercalation process proceeds as a single-phase reaction.33 Figure 8a and b compare C int calculated by PITT and by SSCV for
A532
Journal of The Electrochemical Society, 148 共6兲 A525-A536 共2001兲
1/2
Figure 9. Plots of the Cottrell slope, It vs. log t for a disordered carbon NX-1 electrode obtained by PITT during 共a兲 Li insertion and 共b兲 deinsertion. The relevant potentials are indicated. The electrode area was 1 cm2, 3.33 mg/cm2.
the NX-1 and NX-4 carbons, respectively. It is seen that the curves obtained from PITT and from SSCV are very similar. Figure 9a, b and 10a, b show the dependence of the Cottrell slope It 1/2 vs. log t for Li insertion and deinsertion 共respectively兲 into the NX-1 and the NX-4 disordered carbon electrodes. Basically, the shape of these curves is similar to the shape reported previously for graphite34 and a variety of lithiated transition metal oxides.35 The flat extrema in these curves 共minima for the Li insertion processes and maxima for Li deinsertion兲 relate to the Cottrell domain of the chronoamperometric response.34 However, there is an important difference between the It 1/2 vs. log t plots for the disordered carbons and those plots usually obtained with graphite and lithiated transition metal oxide electrodes. Increasing the intercalation level X for the latter systems results in the shift of the It 1/2 extremum toward a longer time as X increases to X ⫽ 0.5. The It 1/2 extremum then shifts in the reverse direction to shorter times, as X increases further in the range from 0.5 to 1.0. The location of the Cottrell domain on the time axis is linked to the characteristic diffusion time , and, therefore, a maximum value of is expected to appear in the vicinity of X ⫽ 0.5. In the case of a one-dimensional diffusion process, is inversely proportional to the chemical diffusion coefficient, D ⫽ l 2 /D
关3兴
where l is the characteristic diffusion length which is identified here with the average particle size (l ⫽ 10 m as obtained from the corresponding scanning electron microscope micrographs兲.
Figure 10. Plots of the Cottrell slope, It 1/2 vs. log t for a disordered carbon NX-4 electrode obtained by PITT during 共a兲 Li insertion 共b兲 deinsertion. The values of the relevant potentials are indicated. The electrode area was 1 cm2, 3.15 mg/cm2.
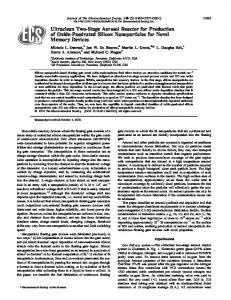
In contrast to the data for graphite and lithiated transition metal oxides,34,35 the curves in Fig. 9 and 10 show a pronounced shift of the extremum in the It 1/2 vs. log t curves toward a shorter time as the potential approaches the 0.3-0.6 V 共vs. Li/Li⫹兲 range. Thus, in accordance with Eq. 3, the maxima in the values of D are expected to be observed in the same potential range. A more quantitative approach to the determination of D is based on the application of a finite-space diffusion model developed specifically for processing PITT measurements29,36 ⫽ 关 Q m⌬X/ 1/2It 1/2兴 2 ⫽ 关 Q m共 ⌬X/⌬E 兲 / 共 1/2It 1/2/⌬E 兲兴 2 ⫽ 关 C int / 共 1/2It 1/2/⌬E 兲兴 2 at t Ⰶ 关4兴 where Q m denotes the total intercalation charge passed through the electrode after application of the potential step, and X(E) is the intercalation level 共thus ⌬X is the change in X after complete equilibration兲. It 1/2 is the Cottrell slope obtained from Fig. 9a, b and 10a, b for each potential step. The plots of D vs. E obtained using Eq. 3 and 4 for both Li insertion and deinsertion to and/or from the disordered carbons NX-1 and NX-4 are shown in Fig. 11. Both plots exhibit wellpronounced maxima at 0.4 and 0.7 V 共vs. Li/Li⫹兲 for NX-1 and 0.5 and 0.4 V 共vs. Li/Li⫹兲 for NX-4, respectively. The height of the peak for Li deinsertion appeared to be 4.5 times larger than that for the insertion process for NX-1. In the case of NX-4, this ratio is even larger, 13. This means that there is a pronounced hysteresis in Li insertion/deinsertion processes into these disordered carbons: the
Journal of The Electrochemical Society, 148 共6兲 A525-A536 共2001兲
Figure 11. Plots of the chemical diffusion coefficient, D vs. potential (E), for the disordered carbon electrode NX-1 and NX-4 obtained by PITT during Li insertion and deinsertion as indicated. EC-DMC 1:1/LiAsF6 1 M solution. Electrode area and mass are as for Fig. 8.
diffusion limitations in the disordered carbon are more pronounced for insertion than for deinsertion. A comparison of this finding with the galvanostatic behavior of these electrodes, as presented in Fig. 1, is very interesting. Clearly, the slope of the chronopotentiograms of the NX-1 electrode 共Fig. 1a兲 in the range of potentials from 0 to 0.5 V 共vs. Li/Li⫹兲 is pronouncedly higher for Li deinsertion than for the insertion process. Moreover, as the extent of disorder in the carbon electrode increases, the difference in both the slope of the corresponding chronovoltammetric curves, and the ratio of the peak heights on the D vs. E curves for the insertion and deinsertion process also increases. This is the case of the NX-4 electrode, which is characterized by a broader 共002兲 reflection, as indicated in Fig. 7. Indeed, in Fig. 1b, the first three galvanostatic curves of the NX-4 electrode revealed a much more pronounced difference in the slope for the Li insertion and deinsertion compared with the data for NX-1. From these data, we conclude that there is a clear correlation between the unique features of the Li diffusion kinetics and the extent of disorder in the synthetic carbons. An almost complete ideal ordered structure of the synthetic graphite, characterized by a very narrow 共002兲 peak 共Fig. 7兲, was previously shown to be connected with the very narrow SSCV peaks and the deep minima in the D vs. E curves.10,34 Such a drastic difference in the shape of D vs. E curves for graphite and disordered carbons can be understood in terms of a Frumkin-type sorption 共intercalation兲 isotherm with short-range interactions between the inserted species.29 In the limiting case of a quasi-metallic intercalation compound the differential intercalation capacity is totally dominated by the availability of Li sites. Here, both quantities, C int 共an equilibrium statistical factor兲 and D 共ion transport factor兲 can be presented as functions of X through the same single effective interaction parameter, g29,38 C int / f Q m ⫽ 关 g ⫹ X ⫺1 ⫹ 共 1 ⫺ X 兲 ⫺1兴 ⫺1
关5兴
D/a 2 k * ⫽ 1 ⫹ g 共 1 ⫺ X 兲 X
关6兴
where f ⫽ F/RT 共F and R are Faraday and the gas constants, respectively, T is the absolute temperature兲; k * is a hopping rate constant for Li ions, whereas a denotes a nearest neighbor separation.37 Depending on the value of g, three different types of the C int and D vs. X relationships are envisaged 共for more details see Ref. 29兲. In brief, a moderate attractive interaction between the intercalated species (⫺4 ⬍ g ⬍ 0) results in the appearance of a minimum on the
A533
related D vs. X curve at X ⫽ 0.5. Extremely high attractive interactions (g ⬍ ⫺4) lead to a separation between two coexisting phases. D, in this case, takes unrealistic negative values for the whole range of X related to the coexistence region 共usually a very narrow potential domain兲. In this domain, where two phases coexist, the diffusion coefficient is not defined in ideal cases, where the two phases are homogeneous and uniform. Hence, the theoretical negative values of D reflect such an ideal situation. In reality, the phases are not homogeneous and uniform, and some concentration gradients exist at any potential or at X level. Therefore, in the two-phase regions, the calculated practical D values are always very low, but positive, and thus, D vs. E or X curves of many Li insertion electrodes, including graphite, LiCoO2, LiNiO2, LiMn2O4, LiV2O5, etc., have sharp minima at the two-phase domains when phase transition occurs. Finally, repulsive interactions (g ⬎ 0) result in a maximum on the D vs. X curve at X ⫽ 0.5.29,33,35 The shape of the C int vs. E curve ⫺1 (E ⫽ Q m兰 C int dX) changes correspondingly: As g ⬎ 0, the halfpeak width of the differential capacity curve is larger than 90 mV 共for a one-electron reaction兲; at g ⫽ 0, the half-peak width takes the Nernstian value 90 mV; moderate attractive interactions (⫺4 ⬍ g ⬍ 0) lead to the narrow peaks 共the half-peak width less than 90 mV兲. The differential capacity curves for very high attractive interactions, resulting in first-order phase transition, are described by the so-called ␦-function. Our studies of Li intercalation into graphite and various lithiated transition metal oxides11 revealed unequivocally that these processes relate to very high attractive interactions among the intercalation species, which lead to first-order phase transitions. An application of the same Eq. 6 for the description of the D vs. E curves for the disordered carbon electrodes, leads to the conclusion that, in contrast to graphite, the interactions amongst the intercalation species in the disordered carbons should be considered as repulsive. As mentioned above, staging in graphite is driven by attractive in-plane Li-Li interactions, probably elastic in origin. The usual models for Li intercalation into graphite assume infinite graphene sheets, i.e., the flake size is large compared with the healing length of local distortions around an isolated Li.37 This finding is no longer true in the disordered carbons, in which the lateral flake size is about 10 Å,15,31 and the healing length is about 5 Å.37 Thus, the flakes are too small to support the local distortions, giving rise to an attractive interaction. In this case, the dominant effect will be coulomb repulsion between neighboring Li ions in the same interflake gallery, thus eliminating the driving force for staging. However, it is the property of Eq. 6 that even at very high repulsive interactions, the maximal value of D, at X ⫽ 0.5, can not be twice the values of D at the beginning and at the end of intercalation 共i.e., X ⫽ 0 and X ⫽ 1, respectively兲.39 The curves in Fig. 11 show much higher peaks than predicted by the theory 共Eq. 6兲. This deviation may be very meaningful, because it may indicate that there are other factors that lead to the maxima in the D vs. E curves of these carbons, in addition to possible repulsive interactions amongst the intercalation sites. A second factor that may lead to maxima in D vs. E, is that X is a pronounced, expected heterogeneity of the sites available for Li insertion. This heterogeneity may be in terms of Li ion site interaction and Li-ion mobility. For instance, a possibility exists that there are sites of low and high redox potentials 共e.g., close to 0. V and 1.5 V vs. Li/Li⫹兲 that allow poorer Li-ion mobility than sites at average redox potentials 共around 0.5 vs. Li/Li⫹兲. Such a possibility may also lead to apparent high D values at intermediate potentials, rather than in the potentials at the beginning and end of the Li insertion. At least two kinds of insertion sites reflected by two overlapping peaks on the SSCV curves may exist: At the edge carbons, or on both sides of the carbon hexagons of the graphene plane. We speculate that Li insertion occurring at high potentials can be related to the sites on the edge carbons, whereas the Li intercalation at lower potentials may occur on the monolayer planes.
A534
Journal of The Electrochemical Society, 148 共6兲 A525-A536 共2001兲
Figure 12. A family of Nyquist plots measured from the composite disordered carbon electrode 共a兲 NX-1 and 共b兲 NX-4. The potentials at which the electrodes were preliminary, equilibrated during at least 2 h, as indicated. The insets near some of the curves emphasize the high frequency domain. The electrode area was 1 cm2, 7.5 mg/cm2 for NX-1 and 6.9 mg/cm2 for NX-4.
Kinetics of Li-ion insertion into the disordered carbons studied by EIS.—Impedance spectra were measured from NX-1 and NX-4 electrodes at a variety of potentials between 3 and 0.005 V in the 100 kHz to 6.3 mHz range. The results are plotted as Nyquist plots in Fig. 12a and b, respectively. In general, as the potentials are lower, the electrodes’ impedance is lower and contains the following distinctive features: At potentials lower than 1 V 共vs. Li/Li⫹兲, the Nyquist plots thus obtained contain two semicircles.10 As reported previously, EIS for graphite electrodes also contains two semicircles.10 Since the surface films on the disordered carbons and graphite are very similar, it is logical to assign the high frequency semicircle in Fig. 12a and b to Li-ion migration through the surface films, as is the case for the graphite electrodes. The low frequency semicircle is accordingly ascribed to Li-ion transfer across the interface between the surface films and the carbon. The very low frequency part of these spectra reflects Li-ion diffusion in the carbon and accumulation of lithium into the carbon. This topic is beyond the scope of this work. Figure 13 presents potential dependencies of the diameters of both the high and the low frequency for the NX-1 and NX-4 electrodes 共a and b, respectively兲. Both resistances related to the high and low frequency semicircles tend to decrease as Li-ion insertion into the disordered carbons proceeds. The corresponding capacities 共calculated from max of the semicircles兲 are in the order of F/cm2 for the high frequency semicircle, and tens of mF/cm2 for the low frequency semicircle. The low capacitance related to the high frequency semicircles in the Nyquist plots in typical of surface films formed on Li electrodes.39 Therefore, this capacitance correlates well with the assignment of
Figure 13. Potential dependencies of the resistances related to the high and low frequency semicircles in the Nyquist plots of NX-1 and NX-4 electrodes, as indicated.
Journal of The Electrochemical Society, 148 共6兲 A525-A536 共2001兲 this semicircle to the surface films that cover the carbon electrodes. The relatively high capacities associated with the low frequency semicircles seem to be in congruence with their assignment to the interface between the carbon and the surface films. Such high capacity values may correspond to interfacial charging, as is frequently found in adsorption phenomena in electrochemical systems. The decrease in the diameter of the low frequency semicircle 共i.e., the charge-transfer resistance兲 with lowering the potential can be rationalized in terms of Butler-Volmer type kinetics. Whereas, the similar dependence of the diameter of the high frequency semicircle indicates that some reversible changes in the surface films, which lower their resistivity, occur as Li intercalation proceeds. The comparison between the impedance spectra of the disordered and the graphitic carbons is interesting. As mentioned above, Nyquist plots from graphite electrodes also exhibit two semicircles, with the diameter of the low frequency semicircle decreasing as Li intercalation proceeds.10 However, there are two important quantitative difference. First, the resistance of the surface films on graphite electrodes is much larger than the resistance related to chargetransfer in most of the intercalation potentials.10 This is in contrast to the picture for the disordered carbons 共Fig. 12 and 13兲. Second, the resistance due to the surface films on the disordered carbons decreases with the decrease in potential 共Fig. 12 and 13兲, whereas a pronounced increase in this resistance at the low potentials 共high intercalation level兲 is typical of graphite electrodes.10 We propose that this increase in the resistance of the surface films on graphite at low potentials is connected to volume changes in the graphite, as lithium intercalation advances. In the case of graphite, which has a highly ordered structure, the interlayer spacing increases pronouncedly at the last stages of Li insertion. Because Li intercalation occurs at facets perpendicular to the basal planes of the graphite particles, the surface films precipitated on these facets are the most important passivating species, which protect the electrodes from continuous reactions with solution species. We can assume that as the interlayer spacing in the graphite particles increases, these surface films are stretched, thus becoming highly stressed. Such stress may have a detrimental influence on their Li-ion conductivity. We also assume that the surface films on the graphite, although comprised of Li salts, have some elasticity, and thus this stress does not break them down; otherwise, highly reversible behavior and prolonged cycle life of graphite electrodes in these solutions would be unattainable. Hence, the above changes are reversible and periodic, and as deintercalation proceeds, the impedance related to the surface films decreases 共resulting in smaller high frequency semicircles in the Nyquist plots measured at higher potentials兲. In the case of the disordered carbons, the volume changes, as Li insertion advances. These carbons should be much less pronounced compared with graphite, because their intrinsic structure already includes voids into which Li is inserted. Thus, the surface films on these carbons are more robust, and their physical properties do not change significantly during Li insertion/deinsertion cycling.
Long-term cycling of the disordered carbon electrodes.—Cycling of electrodes comprised of disordered carbons was performed in coin-type cells at a C/10 rate with EC-DMC 1:1/LiAsF6 solutions and Li foils as the counter electrodes. Figures 14a and b show both charge and discharge capacities over 300 cycles for NX-1 and NX-4, respectively. Both disordered carbons reveal very good cycleability, and thus can be effectively used as anodes for high energy Li-ion batteries. The capacity fading of these electrodes upon prolonged cycling is smaller than that of graphite electrodes in similar experiments, and the impedance of the disordered carbons also remains low and stable upon cycling. Hence, we found that during the first few cycles of these electrodes, some reorganization in their structure occurs, which leads to a pronounced decrease in their initial very high capacity 共see, for example, Table I and the first points in the curve in Fig. 14b兲. A stable, high capacity 共⬎400 mAh/g兲 can then be obtained over hundreds of cycles. We
A535
Figure 14. Typical cycle life 共capacity vs. cycle number兲 of the NX-1 共a兲 and NX-4 共b兲 electrodes obtained in coin-type cell testing. Li metal counter electrodes, EC-DMC 1:1/LiAsF6 1 M solution, C/10 h. The electrode area was 2.8 cm2, 3.66 mg/cm2 for NX-1 and 3.4 mg/cm2 for NX-4.
attribute the relatively high stability of these electrodes 共both in their capacity and impedance upon cycling兲 to the stability of their surface. Conclusion The theme of this research was a comparative study of a Liinsertion process into disordered carbons and graphite. A common feature, which strongly affects the carbons’ electrochemical behavior, is the formation of surface films due to the reduction of solution species. FTIR and XPS measurements showed that the composition of the surface films on the various carbon electrodes is similar, depending mostly on the solution composition, and not on the type of carbon used. As already found in previous works, the surface films on the carbon electrodes in EC-DMC solutions contain carbonate species as major components, and some salt anion reduction products. These surface films are also clearly reflected by the impedance spectra of these electrodes, namely, by a high frequency semicircle with typical R and C parameters of Li-ion conducting surface layers. Stabilization of the surface films on the disordered carbons requires a longer time than the time expended on the graphite electrode. This difference was ascribed to a less compact structure of the carbon substrates when disordered carbons were used. However, after the initial stabilization, the surface films formed on the disordered carbons seem to be more stable compared with the films on graphite electrodes. This finding is attributed to the fact that the volume expansion of graphite at a high Li insertion level is more pronounced compared with disordered carbons. The difference between the structure of the disordered carbons and the graphite leads to a better passivation of the disordered carbon electrodes in solutions 共after the surface films formation processes are completed兲 and hence, to their relatively higher stability upon prolonged charge/discharge cycling compared with graphite.
A536
Journal of The Electrochemical Society, 148 共6兲 A525-A536 共2001兲
The pronounced difference in the local structure of the disordered and graphitic carbons results in completely different mechanisms of Li-ion insertion into these materials. Whereas Li-ion intercalation into graphite clearly bears features of staged processes, Liion insertion into the disordered carbons occurs in the form of adsorption on both sides of elementary scattered graphene planes and on their edges. In general, a broad distribution of adsorption site energies in the disordered carbons leads to rather broad cyclic voltammetric peaks. Concerning electrodes comprised of disordered carbons, highly resolved plots of the chemical diffusion coefficient of Li ions, D vs. potential E, show a pronounced maximum in D at intermediate levels of Li-ion insertion. This corresponds to ca. 0.4-0.5 V 共vs. Li/Li⫹兲. The behavior of D vs. E for the disordered carbons is radically different from the behavior reported for both graphite and a variety of lithiated transition metal oxides. The graphite and these oxides exhibited pronounced minima on the D vs. E curves at the potentials close to the corresponding SSCV peaks. These features, as well as the rather narrow SSCV peaks for these electrodes, were interpreted on the basis of a Frumkin-type intercalation isotherm. They were ascribed to strong attractive interactions between the intercalated species in the bulk of these insertion electrodes. These strong interactions at certain potential domains lead to phase separations, and hence, the Li intercalation processes of these electrodes occur via first order phase transitions. A similar approach was used to understand the shape of the D vs. E curves of the disordered carbon electrodes. We suggest that the maxima in D vs. E originate from a combination of two effects, 共i兲 repulsive interactions between the Li-insertion sites due to the disordered structure; and 共ii兲 pronounced heterogeneity of the Liinsertion sites in the disordered carbons in terms of interactions between the Li ions and the carbon sites, probably also in terms of Li-ion mobility. Acknowledgment Support for this work was provided by the New Energy Development Organization of NEDO, Japan. Bar-Ilan University assisted in meeting the publication costs of this article.
References 1. K. Kinoshita, in Handbook of Battery Materials, J. O. Besenhard, Editor, p. 231, Wiley-VCH, Weinheim, Germany 共1999兲. 2. M. Winter and J. O. Besenhard, in Handbook of Battery Materials, J. O. Besenhard, Editor, p. 383, Wiley-VCH, Weinheim, Germany 共1999兲.
3. A. He´rold, in Chemical Physics of Intercalation, NATO ASI Series, Vol. B172, A. P. Legrand and S. Flandrois, Editors, p. 3, Plenum Press, New York 共1987兲. 4. H. Boehm, Carbon, 32, 759 共1994兲. 5. K. Kinoshita, New Trends in Electrochemical Technology; Vol. 1, T. Osaka and M. Datta, Editors, p. 193, Gordon and Breach Science Publishers, Australia 共2000兲. 6. J. S. Xue and J. R. Dahn, J. Electrochem. Soc., 142, 3668 共1995兲. 7. J. R. Dahn, W. Xing, and Y. Cao, Carbon, 35, 825 共1997兲. 8. A. Claye and J. E. Fischer, Electrochim. Acta, 45, 107 共1999兲. 9. T. Zheng, Y. Liu, E. W. Fuller, S. Tseng, U. von Sacken, and J. R. Dahn, J. Electrochem. Soc., 142, 2581 共1995兲. 10. M. D. Levi and D. Aurbach, J. Phys. Chem. B, 101, 4641 共1997兲. 11. D. Aurbach, M. D. Levi, E. Levi, H. Teller, B. Markovsky, G. Salitra, U. Heider, and L. Heider, J. Electrochem. Soc., 145, 3024 共1998兲. 12. Intermolecular and Surface Forces, J. N. Israelachvili, Editor, p. 110, Academic Press, London 共1992兲. 13. D. Aurbach, B. Markovsky, A. Schechter, and Y. Ein-Eli, J. Electrochem. Soc., 143, 3809 共1996兲. 14. R. M. Lindstrom, J. Res. Nat. Inst. Stand. Technol., 98, 127 共1993兲. 15. P. Zhous, P. Papanek, R. Lee, J. E. Fischer, and W. A. Kamitakahara, J. Electrochem. Soc., 144, 1744 共1997兲. 16. D. Aurbach, M. D. Levi, E. Levi, and A. Schechter, J. Phys. Chem. B, 101, 2195 共1997兲. 17. D. Aurbach, Y. Ein-Eli, O. Chusid, Y. Carmeli, M. Babai, and H. Yamin, J. Electrochem. Soc., 141, 603 共1994兲. 18. M. Inaba, Y. Kawatate, A. Funabiki, S. K. Jeong, T. Abe, and Z. Ogumi, Electrochim. Acta, 45, 99 共1999兲. 19. R. Yazami, Electrochim. Acta, 45, 87 共1999兲. 20. V. W. Behrendt, G. Gatlow, and M. Drager, Z. Anorg. Allg. Chem., 397, 237 共1973兲. 21. D. Aurbach, M. L. Daroux, P. Faguy, and E. B. Yeager, J. Electrochem. Soc., 135, 1863 共1988兲. 22. D. Aurbach and Y. Gofer, J. Electrochem. Soc., 138, 3529 共1991兲. 23. D. Aurbach, M. Moshkovich, Y. Cohen, and A. Schechter, Langmuir, 15, 2947 共1999兲. 24. D. Aurbach, B. Markovsky, I. Weissman, E. Levi, and Y. Ein-Eli, Electrochim. Acta, 45, 67 共1999兲. 25. Vision 2 Software, Kratos Analyticall Inc., Manchester, U.K. 26. E. C. Vincent, XI SpecMaster System 1998 Database, XPS International, Minnesota. 27. D. Aurbach, I. Weissman, A. Schechter, and H. Cohen, Langmuir, 12, 991 共1996兲. 28. M. D. Levi and D. Aurbach, J. Electroanal. Chem., 421, 79 共1997兲. 29. M. D. Levi and D. Aurbach, Electrochim. Acta, 45, 167 共1999兲. 30. J. R. Dahn and W. R. McKinnon, J. Phys. Chem., 17, 4231 共1984兲. 31. P. Zhou, R. S. Lee, A. Claye, and J. E. Fischer, Carbon, 361, 177 共1998兲. 32. P. Papanek, M. Radosavlievic, and J. E. Fischer, Chem. Mater., 81, 1519 共1996兲. 33. M. D. Levi, K. Gamolsky, D. Aurbach, U. Heider, and R. Oesten, J. Electroanal. Chem., 477, 32 共1999兲. 34. M. D. Levi and D. Aurbach, J. Phys. Chem. B, 101, 4641 共1997兲. 35. M. D. Levi, G. Salitra, B. Markovsky, H. Teller, D. Aurbach, U. Heider, and L. Heider, J. Electrochem. Soc., 146, 1279 共1999兲. 36. C. J. Wen, B. A. Boukamp, R. A. Huggins, and W. Weppner, J. Electrochem. Soc., 126, 2258 共1979兲. 37. J. E. Fischer and H. J. Kim, Phys. Rev. B, 351, 3259 共1987兲. 38. C. E. D. Chidsey and R. W. Murray, J. Phys. Chem., 90, 1479 共1986兲. 39. D. Aurbach and A. Zaban, J. Electroanal. Chem., 367, 15 共1994兲.