Journal of The Electrochemical Society, 148 共3兲 C168-C176 共2001兲
C168
0013-4651/2001/148共3兲/C168/9/$7.00 © The Electrochemical Society, Inc.
Microstructure and Giant Magnetoresistance of Electrodeposited Co-CuÕCu Multilayers L. Pe´ter,a,z A. Czira´ki,b L. Poga´ny,a Z. Kupay,a I. Bakonyi,a M. Uhlemann,c M. Herrich,c B. Arnold,c T. Bauer,c and K. Wetzigc a
Research Institute for Solid State Physics and Optics, Hungarian Academy of Sciences, H-1525 Budapest, Hungary b Department of Solid State Physics, Eo¨tvo¨s University, H-1518 Budapest, Hungary c Institut fu¨r Festko¨rper und Werkstofforschung, D-01069 Dresden, Germany Direct current plating, pulse plating, two-pulse plating, and reverse pulse plating were used to produce electrodeposited Co-Cu alloys and Co-Cu/Cu multilayers under galvanostatic control from an electrolyte containing CoSO4 and CuSO4. Atomic force microscopy, X-ray diffraction, and transmission electron microscopy were used to study the sample structure and morphology. Direct current plating resulted in a Co95Cu5 alloy with nearly equal amounts of face-centered cubic 共fcc兲 and hexagonal close packed phases, while all pulsed current methods yielded multilayers with fcc structure. Giant magnetoresistance 共GMR兲 behavior was observed in the multilayers with a maximum magnetoresistance 共MR兲 ratio of about 9% as measured at 8 kOe. The shape of the MR curves and the magnitude of the GMR were very similar, regardless of the sign of the current between the Co deposition pulses. The results of structural studies also confirmed the formation of a multilayer structure for each pulsed electrodeposition mode. The conclusion was that the spontaneous exchange reaction between Co and Cu2⫹ is responsible for the formation of a pure Cu layer even under reverse pulse plating conditions. The GMR of the multilayer deposits decreased with increasing bilayer number, due to the deterioration of the microstructure as the deposit grew. © 2001 The Electrochemical Society. 关DOI: 10.1149/1.1346606兴 All rights reserved. Manuscript submitted June 5, 2000; revised manuscript received November 13, 2000.
The discovery of the giant magnetoresistance 共GMR兲 effect1,2 in nanoscale alternating magnetic/nonmagnetic multilayers has raised a lot of interest. Such systems exhibited much larger magnetoresistance 共MR兲 ratios than the previously known anisotropic magnetoresistance 共AMR兲 of bulk ferromagnets.3 A real potential for their application has been opened by the observation of a room temperature GMR as high as 50% in Co/Cu multilayers.4-6 Nanoscale multilayers have mostly been produced by the use of vacuum techniques such as sputtering, evaporation, and molecular beam epitaxy. The relatively inexpensive and simple electrodeposition method can also be applied for producing magnetic or nonmagnetic multilayers, including the Co-Cu system, with good GMR properties.7 Numerous studies8-26 have been reported on the preparation and characterization of electrodeposited Co-Cu/Cu multilayers in which the magnetic layer is, as a result of the nature of the electrodeposition method, not pure Co but rather a Co-rich Co-Cu alloy with magnetic properties very similar to those of pure Co. In spite of these efforts, the observed room temperature GMR in electrodeposited Co-Cu/Cu multilayers12,14-20,22,23,25 has remained below 20%, which is much smaller than the value found in sputtered Co/Cu multilayers.4-6 共The only exception is Ref. 11, in which a 55% room temperature GMR has been reported for an electrodeposited Co-Cu/Cu multilayer; however, this result has not yet been confirmed by other authors.兲 Therefore, a challenge remains to clarify the parameters of electrodeposition that govern the GMR behavior of magnetic or nonmagnetic multilayers. Abundant literature data are available for Co-Cu/Cu multilayered films deposited with either potential9-18,21-26 or current control.8,19,20 In this paper, we report results obtained for electrodeposited Co-Cu/Cu multilayers prepared under current control. Previous studies27-29 indicate that there is a correlation between the observed microstructure and the measured GMR of electrodeposited Ni-Cu/Cu and Co-Ni-Cu/Cu multilayers. The variation in deposition conditions 共texture and crystal orientation of the substrate28,29 or deposition control mode28兲 was found to exert an effect on the GMR via modifying the deposit microstructure. Recent progress in understanding the importance of the exchange reaction between the more noble metal 共mostly Cu兲 and the magnetic elements Ni30-35 and Co24,26 under pulse electrodeposition conditions
z
E-mail:
[email protected]
has made it clear that the formation of a chemically intermixed interface between the magnetic and nonmagnetic layers is inherent to the applied pulse electrodeposition technique. It has been found that this exchange reaction is dominant in the formation of intermixed interfaces and directly influences the GMR in electrodeposited Ni-Cu/Cu multilayers.36 The exchange reaction between Cu and Co is more significant than for the Ni-Cu pair because the driving force of the reaction 共i.e., the difference in standard electrode potentials兲 is higher than in the case of the Ni-Cu pair. Besides, Co and Cu do not form equilibrium alloy phases,37 though metastable solid solutions can be produced by several techniques using nonequilibrium processing. This is in contrast with the Ni-Cu pair that exhibits unlimited solid solubility and, therefore, the nucleation of Cu on Ni does not require a significant activation energy. The aim of this work was to produce thick, self-supporting CoCu/Cu multilayers and to study the influence of the growth conditions on magnetoresistance. It was our particular interest to elucidate the origin of the variation of the magnetoresistance with the help of the investigation of the microstructure of the deposits. Experimental Sample preparation.—The deposition baths were made with CoSO4•7H2O and CuSO4•5H2O with no complexing or buffering agents. The analytical grade chemicals 共from Reanal, Hungary兲 were used without any further purification. Typical impurity level of Zn and Ni was less than 0.005%, and the concentration of Fe and Cu was below 0.001%, according to the specification of the manufacturer. Doubly distilled water was used to prepare the deposition baths. The solution temperature was kept at 30 ⫾ 0.3°C. The substrate for the deposition was a polycrystalline titanium sheet that was polished manually with emery paper and then washed with hydrochloric acid and doubly-distilled water. The exposed surface area of the substrate was 2 ⫻ 2 cm. The substrate was held in the solution so that the deposition plane was vertical and the top edge of the sample was horizontal. A copper plate of about 10 cm2 surface area parallel to the deposition substrate served as a counter electrode. The solution was not agitated. A computer-controlled Keithley current generator 共model 228A兲 served as a current source for electrodeposition. The instrument was used in four different modes. The only specimen plated in the direct current 共dc兲 mode was a Co-rich Co-Cu bulk alloy 共master alloy兲. Multilayers were mostly produced with the two-pulse plating
Downloaded on 2015-10-19 to IP 54.210.20.124 address. Redistribution subject to ECS terms of use (see ecsdl.org/site/terms_use) unless CC License in place (see abstract).
Journal of The Electrochemical Society, 148 共3兲 C168-C176 共2001兲
C169
Table I. Main parameters of electrolytes for Co-CuÕCu multilayer electrodeposition and bilayer numbers „N… reported in the literature and used in this work. The sequence is arranged in order of decreasing concentration ratio †Co2¿‡Õ†Cu2¿‡ in the bath. Deposition methods: P, potentiostatic; G, galvanostatic. Main components Co共NH2SO3兲2, CuSO4, H3BO3 Co共NH2SO3兲2 or CoSO4, CuSO4, H3BO3 CoSO4, CuSO4, H3BO3 CoSO4, CuSO4, H3BO3 CoSO4, CuSO4, H3BO3 CoSO4, CoCl2, CuSO4, H3BO3, NaCl CoSO4, CuSO4, H3BO3 CoSO4, CuSO4, CrO3 Co共NH2SO3兲2, CuSO4, H3BO3 Co共NH2SO3兲2 or CoSO4, CuSO4, H3BO3 CoSO4, CuSO4 CoSO4, CuSO4, Na3C6H5O7 CoSO4, CuSO4, Na3C6H5O7, NaCl
关Co2⫹兴/关Cu2⫹兴
N
Deposition method
Reference
8000 200
800-6000 50
P P
11 21
188 178 177 140 100 100 82 44
100 25 50 10-100 83 300 50 50
P P P P P P G P
22, 24 17, 18 12 14, 15 9 16 8 21
700-1500 110-11000 50
G P G
This work 26 19, 20
40 28 13-19
mode,7,36 i.e., a low current pulse was used for depositing the Cu layer and a high current pulse for the deposition of the Co-rich magnetic Co-Cu layer. If the lower current in the two-pulse mode is zero, the resulting deposit is termed pulse plated. If the current between the pulses used for depositing the ferromagnetic layers was anodic, the method is usually referred to as reverse pulse plated. According to the sign and the value of the current during the low current pulse, the deposition methods are abbreviated as cគ /cគ , cគ /0គ , or cគ /aគ , where cគ before the slash stands for the cathodic current of the high-current pulse, and cគ , 0គ , and aគ after the slash denote cathodic, zero, or anodic current, respectively. Deposition current is reported throughout this paper by using the convention that the cathodic current is negative and the anodic one is positive. The average current efficiency of the dc deposition was calculated from the measured weight of the deposits and from Faraday’s law. In the case of multilayers, the current efficiency for the Co-rich layer deposition was calculated by assuming that the copper layer deposition took place at 100% current efficiency. A current density of ⫺32.5 mA cm⫺2 was used to prepare the dc plated Co-rich bulk alloy and the Co-rich ferromagnetic layers in the different pulsed modes. By using an electron probe microanalysis 共EPMA兲 facility in a scanning electron microscope, the average Cu content of the dc plated alloy was found to be 5 ⫾ 2 atom %, and the rest was Co. No trace of other elements was detected within the resolution limit of EPMA 共about 0.1 atom % for metals兲. The copper content of the deposit calculated with the average current efficiency, the deposition current and the diffusion limited current of Cu deposition is 4.3 atom %, which is in good agreement with the value found by EPMA. The distribution of copper is not uniform in the dc plated deposit. The EPMA results showed that copper is somewhat more abundant at the substrate side of the deposit 共6.2 atom % on the average兲 whereas the copper concentration measured for the solution side is only 4.2 atom %. This can be explained by the evolution of the diffusion field of Cu2⫹ in the solution. The copper deposition current density was mostly varied within a range where Co deposition did not occur. According to the results of the potentiodynamic polarization measurements 共not presented here兲 and the EPMA composition analysis, pure Cu metal was deposited at current densities below ⫺1.25 mA cm⫺2. The bilayer number, N, in the multilayers was varied between 700 and 1500. The pulse plated and dc plated alloys were prepared by using the same charge as for a typical multilayer, i.e., 28 to 32 C cm⫺2. The typical thickness of the deposits measured with a mechanical gauge was 8.5 to 18 m. Magnetoresistance measurements.—The magnetoresistance of
the multilayers was measured on strip samples in the field-in-plane, current-in-plane 共FIP/CIP兲 configuration with the four-points-in-line method. 2 mm wide segments of the deposits were cut parallel to the ‘‘top’’ edge as defined by the sample position during the deposition. The MR ratio was defined with the following formula: ⌬R/R 0 ⫽ 关 R(H) ⫺ R(0) 兴 /R(0), where R(H) is the sample resistance in the magnetic field H and R(0) is the sample resistance when H ⫽ 0. It was found that the MR ratio of the electrodeposited multilayers depended on the vertical position of the 2 mm wide strip segment cut for the MR measurement. However, the trends obtained with varying deposition conditions were the same whichever segment of the samples was tested. Therefore, hereby we report the magnetoresistance of the 2 mm wide strip segment only that was centered at 13 mm from the top of the samples where the MR ratio was found to be the maximum. Structural characterization.—The crystal structure of the samples was studied by X-ray diffraction 共XRD兲 with a Philips X’pert equipment. The XRD patterns have been fitted by using the Profile Fit program 共Philips兲. The average crystal size was determined from the half width of the fitted peaks according to the Williamson-Hall method.38 The proportion of the coexisting phases was calculated from peak intensities corrected for multiplicity.38 Transmission electron microscopy 共TEM兲 experiments were carried out on a Philips M20 equipment using the Fresnel technique. The morphology and roughness at both sides of the deposited films were investigated with atomic force microscopy 共AFM兲 with a Nanoscope III instrument operated in the tapping mode. Results Optimization of the electrodeposition of Co-Cu/Cu multilayers.—Table I shows the typical bath compositions used in earlier studies and that applied in the present work for Co-Cu/Cu multilayer electrodeposition. It can be seen from Table I that, with the exception of Ref. 11, the deposition of multilayers with bilayer numbers higher than a few tens requires a fairly low 关 Co2⫹兴 / 关 Cu2⫹兴 concentration ratio in the solution. The choice of the metal ion concentration ratio is not arbitrary since it influences both the copper content of the cobalt-rich layer and the roughness of both the Co-Cu/Cu interface and the deposit surface.15 Besides, the Cu2⫹ concentration has to be high enough to provide the Cu content of each layer across the sample without an appreciable concentration change. Therefore, most of our plating solutions contained Cu2⫹ at the concentration of 25.0 mmol dm⫺3, and a few samples were made with 关 Cu2⫹兴 ⫽ 15 mmol dm⫺3. The Co2⫹ concentration was 1.00 mol dm⫺3 in
Downloaded on 2015-10-19 to IP 54.210.20.124 address. Redistribution subject to ECS terms of use (see ecsdl.org/site/terms_use) unless CC License in place (see abstract).
C170
Journal of The Electrochemical Society, 148 共3兲 C168-C176 共2001兲
each experiment. The 关 Co2⫹兴 / 关 Cu2⫹兴 concentration ratio was, hence, set up at 40 for the majority of our samples, which is quite low compared to those in the earlier publications cited 共see Table I兲. The metal ion concentrations applied here were selected on the basis of a short preliminary study of the magnetoresistance of the samples as a function of the Cu2⫹ concentration. Other authors have also mentioned that metal ion concentration in the plating bath was optimized in their work. Lenczowski et al.12 concluded that 关 Cu2⫹兴 ⫽ 6.8 mmol dm⫺3 is ideal for multilayer deposition. However, the components of the solution in their case were different from those of the bath used in this work. Thus, it is acceptable that the optimization resulted in different metal ion concentrations for the two cases. Additionally, the low Cu2⫹ concentration of the solution enlarges the deposition time, which is unfavorable for the deposition of relatively thick multilayers. The low current pulse amplitude was chosen such as to ensure that no Co was incorporated in the Cu spacer layer since this is a prerequisite of applying the layer as the nonmagnetic component in the multilayer structure to obtain good GMR. In most of the experiments, ⫺0.6 mA cm⫺2 was used for Cu deposition, which resulted in a pure Cu layer, as presented in the Experimental section. Regarding that this value is less than half of the diffusion limited current density of the Cu deposition, no significant surface roughness could develop at ⫺0.6 mA cm⫺2 as a result of the diffusion control of the copper deposition.7 The current density of the high current pulse was limited by the mechanical stress that disintegrated the samples at current densities higher than ⫺35 mA cm⫺2. Continuous multilayer deposits could only be obtained if the magnetic layer was thick enough. The choice of the copper counter electrode can be supported with several arguments. Cobalt counter electrode could not be used because upon the immersion of a Co electrode in the Cu2⫹-containing solution, copper precipitates at the electrode surface and cobalt dissolves according to the following exchange reaction Co ⫹ Cu2⫹ ⫽ Cu ⫹ Co2⫹
关1兴
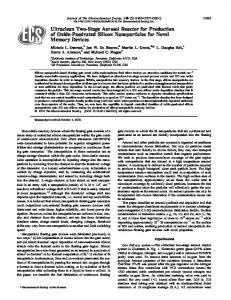
The copper counter electrode served as a sacrificial anode that restored the Cu2⫹ concentration in the solution. The amount of the excess copper dissolved during an experiment was negligible as compared to the total copper ion content of the solution. The current efficiency for dc plating was found to be 89% at ⫺32.5 mA cm⫺2, and increased slightly with current density 共87% at ⫺25 mA cm⫺2 and 91% at ⫺40 mA cm⫺2兲. If 100% current efficiency is assumed for the Cu deposition in the multilayers, the current efficiency calculated for the high current pulse is equal to or slightly lower than that obtained for the dc deposit obtained at the same current density. A pronounced decrease in the current efficiency of the Co-rich layer deposition was observed if the length of any of the pulses was too low. It is likely that the decrease in current efficiency is a consequence of the transient occurring at the beginning of both the low current and high current pulses. This phenomenon was well described for deposition under both potential control12,14,15,24 and current control.26 Although the current control should eliminate the current peaks and fluctuations during the transients, the capacitive component of the transient may lead to a change in the current efficiency. Magnetoresistance of the multilayer samples.—The MR curves for two samples that had the best GMR values are shown in Fig. 1. The facts that both the longitudinal and transverse MR components are negative in the whole magnetic field range and they are almost equal for a given sample indicate that here the GMR effect dominates the observed MR. The shape of the MR curves in Fig. 1 is very similar to those reported for electrodeposited Co-Cu/Cu 16,19,20 and Co-rich Co-Ni-Cu/Cu 7 multilayers with comparable layer thicknesses.
Figure 1. Magnetoresistance curves of two selected cគ /cគ plated Co-Cu/Cu multilayers. i(Co) ⫽ ⫺32.5 mA cm⫺2, t(Co) ⫽ 0.65 s, i(Cu) ⫽ ⫺0.6 mA cm⫺2, t(Cu) ⫽ 5.0 s.
Dependence of multilayer GMR on Cu spacer layer deposition time.—The MR ratio of cគ /cគ plated multilayer samples as a function of the deposition time of the copper layer is presented in Fig. 2. The Cu thickness calculated with Faraday’s law by assuming 100% current efficiency is proportional to the deposition time, and the proportionality factor 共deposition rate兲 is 0.22 nm/s 共at ⫺0.6 mA cm⫺2兲. Thus, the deposition time below 1.2 s corresponds to a submonolayer coverage with copper. In this case, the neighboring cobalt-rich layers can percolate, and their magnetizations are coupled ferromagnetically. This might be the reason that we could not observe GMR for very low nominal copper layer thicknesses as indicated by the positive longitudinal MR ratio for a Cu layer deposition time of 1 s in Fig. 2. Multilayers with larger than monolayerthick nominal copper layer thickness showed GMR, and the MR ratio reached a maximum 共see Fig. 2兲 where the layer thickness calculated with Faraday’s law was close to the first maximum observed in the ⌬R/R 0 vs. d共Cu兲 curve for Co/Cu multilayers prepared by using high-vacuum methods.4-6 However, at larger d共Cu兲 values,
Figure 2. Magnetoresistance ratio of electrodeposited Co-Cu/Cu multilayer samples at H ⫽ 8 kOe as a function of the Cu layer deposition time. Deposition conditions: i(Co) ⫽ ⫺32.5 mA cm⫺2, t(Co) ⫽ 0.65 s, i(Cu) ⫽ ⫺0.6 mA cm⫺2.
Downloaded on 2015-10-19 to IP 54.210.20.124 address. Redistribution subject to ECS terms of use (see ecsdl.org/site/terms_use) unless CC License in place (see abstract).
Journal of The Electrochemical Society, 148 共3兲 C168-C176 共2001兲
Figure 3. Magnetoresistance ratio of electrodeposited Co-Cu/Cu multilayer samples at H ⫽ 8 kOe as a function of the Cu layer deposition current density. Deposition conditions: i(Co) ⫽ ⫺32.5 mA cm⫺2, t(Co) ⫽ 0.65 s, t(Cu) ⫽ 5.0 s.
the ⌬R/R 0 vs. d共Cu兲 curve failed to decrease as observed for the Co/Cu multilayers obtained with vacuum techniques4-6 which is probably due to the fairly high interfacial roughness of the layers and the fluctuation in the sublayer thicknesses. The copper deposition time could not be increased unlimitedly, because from about 8 s deposition time, the whole multilayer flaked off from the substrate in an early phase of the experiments. Therefore, the higher order maxima of the GMR as a function of the copper layer thickness could not be determined by using the present bath. By using a citrate-containing bath,39 we experienced the same difficulties when the bilayer number was at least 200. Dependence of multilayer GMR on Cu spacer layer deposition current.—Figure 3 shows the MR ratio of the two-pulse plated multilayer samples as a function of the deposition current density of the Cu spacer layer. At the fixed 5 s long separation between the deposition pulses of the ferromagnetic layers, the maximum transverse magnetoresistance is obtained at ⫺0.6 mA cm⫺2. Assuming that the deposition plane is identical with the geometrical plane of the substrate, the calculated nominal Cu layer thickness is 1.1 nm at this deposition current density. The MR ratio of the samples remains comparable with the maximum value in the same series if the deposition current is varied in a wide range. If the cathodic current density increases, it has a little impact only on the magnetoresistance. If the copper deposition current i共Cu兲 approaches zero, and then reversed in sign 共cគ /aគ plating兲, the magnetoresistance of the multilayer samples are still quite high, though obviously no Cu electrodeposition could happen during the low current pulse, or, rather, the previously deposited ferromagnetic layer is expected to dissolve. This behavior of the samples leads to the conclusion that a significant part of the Cu spacer layer is deposited by means of Reaction 1. Figure 4 shows three selected MR curves to demonstrate that the character of the curves is identical, regardless of the magnitude and the sign of the current in the lowcurrent pulse, at least in the current amplitude range investigated. GMR properties as a function of the total thickness of the multilayers.—Figure 5 presents the MR ratio of the Co-Cu/Cu multilayer samples as a function of the total sample thickness 共i.e., the bilayer number N兲 while keeping the rest of the deposition parameters constant. It can be inferred from Fig. 5 that the magnetoresistance decreases with bilayer number. If the bilayer number is decreased from 1200 to 700, the increase in MR ratio is as high as 1%.
C171
Figure 4. Longitudinal magnetoresistance curves of three selected samples produced with different Cu deposition current densities. Deposition conditions: i(Co) ⫽ ⫺32.5 mA cm⫺2, t(Co) ⫽ 0.65 s, t(Cu) ⫽ 5.0 s.
Structure of the dc-deposited Co-rich Co-Cu alloy (master alloy).—Figure 6 shows the characteristic AFM pictures taken on the substrate side 共Fig. 6a兲 and the solution side 共Fig. 6b兲 of the master alloy. The large distance between the trenches in the sample surface 共see Fig. 6a兲 reflects the roughness of the Ti substrate, which was found to be about 500 nm. Both sides of the sample exhibit a granular morphology. The average granule size is about 100 nm at the substrate side of the sample 共Fig. 6a兲. On the solution side of the sample 共Fig. 6b兲, the size of some granules is over 2 m, but others are very small. The results of XRD measurements are summarized in Table II. The master alloy consisted of both hexagonal close-packed 共hcp兲 and face-centered cubic 共fcc兲 Co-Cu crystallites and it contained more fcc component at the solution side than at the substrate side. The fraction of the fcc crystallites increased gradually during deposition from about 50 to 67%. Under equilibrium conditions, pure Co metal forms a hcp structure at room temperature, and the fcc structure is stable above 422°C only.37 However, there are indications in the literature14 that the
Figure 5. Magnetoresistance ratio of the Co-Cu/Cu multilayer samples at H ⫽ 8 kOe as a function of the bilayer number N. Deposition conditions: i(Co) ⫽ ⫺32.5 mA cm⫺2, t(Co) ⫽ 0.85 s, i(Cu) ⫽ ⫺0.6 mA cm⫺2, t(Cu) ⫽ 5.0 s.
Downloaded on 2015-10-19 to IP 54.210.20.124 address. Redistribution subject to ECS terms of use (see ecsdl.org/site/terms_use) unless CC License in place (see abstract).
Journal of The Electrochemical Society, 148 共3兲 C168-C176 共2001兲
C172
Figure 6. AFM pictures taken on 共a兲 the substrate side and 共b兲 the solution side of the Co-rich master alloy deposited with dc current 关 i(Co) ⫽ ⫺32.5 mA cm⫺2兴 .
formation of pure fcc Co is possible during room temperature electrodeposition that was explained with the presence of codischarged and dissolved hydrogen distorting the hcp lattice to an extent that it finally transformed to the fcc structure. In our case, the main reason for the formation of an alloy with fcc structure was the incorporation of about 5 atom % Cu into the deposit. All the lattice plane distances detected by XRD in both the hcp and fcc phases of the master alloy are larger than the values given in
the literature for pure hcp and fcc Co crystals. Since the atomic volume of the Cu atom is higher than that of Co, the stretched lattice plane distances indicate the incorporation of Cu atoms in both phases. The increase in lattice plane distances of the hcp phase is not isotropic. The largest lattice plane distance increase was found in the 具001典 direction of the hcp Co structure. The lattice plane distance evaluated from the position of the 共002兲 reflection of the hcp phase was d hcp002 ⫽ 0.2031 nm for both the substrate and the solution side, which is much larger than that of the pure hcp Co (d hcp002 ⫽ 0.2023 nm). 40 On the other hand, the lattice plane distance in the 具101典 direction of the hcp structure of the master alloy was d hcp101 ⫽ 0.1916 and 0.1913 nm for the substrate and solution side, respectively, which indicates a smaller enlargement of the lattice plane distance with respect to the pure hcp value d hcp101 ⫽ 0.1910 nm. 40 In the master alloy, both the fcc- and hcp-type crystallites exhibited a preferred orientation. The hcp Co-Cu crystallites present a strong 具001典 texture and the fcc Co-Cu crystallites are slightly textured in the 具111典 direction. The 具001典 preferred orientation of the hcp Co-Cu crystallites and the occurrence of fcc Co-Cu during the electrodeposition are probably strongly related to each other. This might be due to the fact that for pure hcp Co the lattice plane distance along the 具001典 direction (d hcp002 ⫽ 0.2023 nm) 40 is very close to that of the 共111兲 lattice plane distance of pure fcc Co (d fcc111 ⫽ 0.20467 nm). 40 It seems very likely that, as a result of the larger atomic volume of the codeposited Cu atoms, the initially deposited Cu-contaminated hcp phase is distorted so much that finally it is transformed to a fcc phase as the deposition front propagates. As a result of the strong relationship between the growth directions of the hcp and fcc crystallites, it can be assumed that the 具110典 directions of the neighboring grains of the two different phases also coincide in the plane of the deposition since the two phases have practically the same lattice plane distances in the master alloy (d hcp110 ⫽ 0.1252 nm and d fcc220 ⫽ 0.1253 nm). On the other hand, the correlated growth of the two-phase structure may also be the reason for the anisotropic stretching of the hcp-Co structure since this anisotropy is necessary for a coherent intermixing of the crystallites of the two constituent phases. For the fcc phase, a ⫽ 0.35482 nm was measured in the master alloy. By using the pure metal room temperature values from Ref. 41 关a共fcc-Co兲 ⫽ 0.35446 nm and a共fcc-Cu兲 ⫽ 0.36148 nm] and applying Vegard’s law, the fcc phase in the master alloy can be estimated to have the composition Cu95Cu5 which agrees well with average Cu content of the deposit as measured by EPMA. The lattice parameter data reported for fcc Co-Cu solid solutions obtained by electrodeposition 共50 to 100 atom % Cu 42,43兲 and by melt quenching 共0-28 and 85-100 atom % Cu 44兲 indicate slightly higher lattice parameters with respect to Vegard’s law. Nevertheless, if we use these experimental lattice parameter data, the estimated Cucontent of the master alloy is about 4 atom % which is very close to the above value.
Table II. Main structural parameters derived from XRD measurements on the master alloy „dc plating… and on selected samples prepared with cᠪ Õ0ᠪ or cᠪ Õcᠪ plating. Plating mode dc
cគ /0គ cគ /cគ
Side
fcc phase ratio 共%兲
substrate
⬃50
solution
⬃67
substrate solution substrate solution
⬎98 ⬎99 ⬎99 ⬎99
Lattice parameters
Preferred orientation
d hcp002 ⫽ 0.2031 nm d hcp101 ⫽ 0.1916 nm a ⫽ 0.35482 nm d hcp002 ⫽ 0.2031 nm d hcp101 ⫽ 0.1913 nm a ⫽ 0.35678 nm a ⫽ 0.35824 nm a ⫽ 0.35806 nm a ⫽ 0.3590 nm
hcp: strong 具001典 fcc: weak 具111典 hcp: 具001典 fcc: weak 具111典 strong 具111典 modest 具111典 strong 具111典 modest 具111典
Repeat period —
3.5 nm 2.3 nm
Downloaded on 2015-10-19 to IP 54.210.20.124 address. Redistribution subject to ECS terms of use (see ecsdl.org/site/terms_use) unless CC License in place (see abstract).
Journal of The Electrochemical Society, 148 共3兲 C168-C176 共2001兲
C173
As pointed out above, the increase of the hcp lattice plane distances in the master alloy deposit was found to be anisotropic and, therefore, the application of Vegard’s law in this case is not appropriate for estimating the Cu content of the hcp phase. Since the Cu content of the fcc phase was practically the same as the average chemical composition measured by EPMA and the amounts of the hcp and fcc phases were comparable in the deposit, it is reasonable to assume that the Cu content of the hcp phase was also very close to 5 atom %. The grain diameter of the crystallites as deduced from XRD line broadening was 17 nm at the substrate side and 40 nm at the solution side. The grain size of both the fcc and hcp phases obeyed the same trend. TEM observations also confirmed that the grain sizes were a few tens of nanometers. Therefore, we can conclude that the large granules seen in the AFM pictures consist of a large number of crystallites and the fairly smooth surface of the deposit on the micrometer scale as observed by AFM should originate from the strongly correlated growth of the two coexisting phases. Structure of the pulse plated (cគ /0គ ) Co-Cu/Cu deposit.—A thick Co-Cu deposit was prepared by pulse plating. The high current pulses 共⫺32.5 mA cm2, 0.65 s兲 were interrupted with 5 s break periods. Hence, the nominal Cu layer thickness was 0, the nominal thickness of the Co-rich layer deposited during each pulse was 6.3 nm, and the number of the applied pulses was 1325. Based on our previous results on the Ni-Cu system,36 this pulse plated Co-Cu deposit is expected to be actually a compositionally modulated alloy with a layered structure very similar to the multilayers produced by cគ /cគ plating. Figure 7 presents the characteristic AFM picture of both sides of the sample. Similarly to the Co-Cu sample deposited in the dc mode, the substrate side of the cគ /0គ plated sample was relatively smooth, and reflects primarily the roughness of the substrate. At the solution side, however, the lateral size of the granules was about 2 m 共see Fig. 7b兲. The surface of the solution side is much richer in details than that of the dc plated sample. The top of the hills contains craters, indicating that a dissolution process may have taken place at the most exposed areas during the breaks between the pulses. According to the XRD investigations 共see Table II兲, the cគ /0គ plated Co-Cu deposit exhibited almost exclusively an fcc crystal structure, although a small amount 共1 to 2%兲 of hcp phase could also be observed. The XRD measurements also revealed that the growth of the fcc phase starts with a very strong 具111典 texture, but later the orientation becomes somewhat less pronounced. The XRD pattern of the cគ /0គ plated Co-Cu sample exhibited additional lines corresponding to superlattice reflections originating from a periodic composition modulation of the fcc structure. The repeat period obtained was 3.5 nm. This value is smaller than that calculated for the thickness of the layer deposited with a single pulse 共6.3 nm兲. The AFM surface roughness analysis indicated a surface area enhancement of 80% with respect to the geometrical surface area. Correspondingly, the actual current density is smaller to this extent, and this reduced current density yields a thickness of 3.5 nm deposited during a single pulse, in good agreement with the XRD bilayer repeat period. Based on the results of the XRD study and also on the similarity of the GMR behavior to the cគ /cគ plated samples, one can consider the cគ /0គ plated deposit as a multilayer. The compositional modulation is a consequence of two phenomena. First, the cobalt-rich layer deposited during each pulse undergoes a composition change as a result of Reaction 1 that leads to a copper enrichment at the electrode surface. Second, the diffusion field of the copper ions in the solution can relax during the pulse break and, therefore, the fresh deposit in the initial phase of the following pulse is rather copper-rich than at the end of the same pulse. The latter phenomenon was analyzed in detail by Roy and co-workers30-35 for the Ni-Cu system, and their conclusions are generally valid for metal pairs with high standard potential difference, i.e., for the Co-Cu system, too.
Figure 7. AFM pictures taken on 共a兲 the substrate side and 共b兲 the solution side of the Co-Cu alloy deposited in cគ /0គ mode. i(Co) ⫽ ⫺32.5 mA cm⫺2, t(Co) ⫽ 0.65 s, t(0) ⫽ 5.0 s.
The lattice parameter of the fcc phase is a ⫽ 0.35678 nm at the substrate side and a ⫽ 0.35824 nm at the solution side of the sample. These values are larger than the room-temperature lattice parameter of pure fcc Co (a ⫽ 0.35446 nm). 41 In order to explain the higher measured lattice parameter values, it should be taken into account that here one has to deal with a layered structure compositionally modulated along the thickness: layers with the approximate composition Co95Cu5 are alternating with pure Cu. Apparently, a coherent fcc superlattice is formed with an intermediate value of the lattice constant. Obviously, both layers are strongly stressed due to the approximately 2% lattice mismatch between the Co95Cu5 and Cu layers. Structural properties of a cគ /cគ plated Co-Cu/Cu multilayer.— This section deals with the structure of the multilayer that exhibited the highest MR ratio 共9%, see Fig. 1兲 among our samples. The deposition parameters of the sample were as follows: i共Co兲 ⫽ ⫺32.5 mA cm⫺2, t共Co兲 ⫽ 0.32 s, i共Cu兲 ⫽ ⫺0.6 mA cm⫺2, t共Cu兲 ⫽ 5.0 s. The AFM study of this sample revealed that the growth of the film starts with very fine granules 共Fig. 8a兲, similarly to the dc plated Co-Cu master alloy, and their width increases during the deposition,
Downloaded on 2015-10-19 to IP 54.210.20.124 address. Redistribution subject to ECS terms of use (see ecsdl.org/site/terms_use) unless CC License in place (see abstract).
C174
Journal of The Electrochemical Society, 148 共3兲 C168-C176 共2001兲
Figure 9. X-ray diffractogram of a cគ /cគ plated Co-Cu/Cu multilayer highlighted around the 共111兲 diffraction peak with the two satellite peaks as marked with the arrows. 共For deposition parameters, see Fig. 8.兲
nm兲 by the roughness inferred from AFM measurement 共1.91兲, one obtains 2.4 nm, which is in good agreement with the 2.3 nm bilayer thickness obtained with the help of the XRD data. The agreement of the experimental and calculated repeat periods indicates that the final roughness of the deposition surface is attained shortly after the beginning of the deposition. The TEM image of the same multilayer is shown in Fig. 10. The direct imaging of the individual layers showed that the bilayer thickness was 2.3 ⫾ 0.1 nm. The latter data is in excellent agreement with that established from the satellites of the XRD pattern. Discussion
Figure 8. AFM pictures taken on 共a兲 the substrate side and 共b兲 the solution side of a selected Co-Cu/Cu multilayer. Deposition parameters: i(Co) ⫽ ⫺32.5 mA cm⫺2, t(Co) ⫽ 0.32 s, i(Cu) ⫽ ⫺0.6 mA cm⫺2, t(Cu) ⫽ 5.0 s.
achieving 2-3 m at the solution side 共Fig. 8b兲. Taking into account the similarity of the surface morphology of the cគ /0គ plated 共Fig. 7兲 and cគ /cគ plated 共Fig. 8兲 alloys, they can be regarded as the members of the same series in which only a technical parameter is different, i.e., the current of the second pulse, but the morphology is determined mainly by the current modulation. According to the XRD measurements, this sample has an fcc lattice with an average lattice parameter of a ⫽ 0.35806 nm at the substrate and a ⫽ 0.3590 nm at the solution side. This multilayer exhibited a highly oriented 具111典 texture. The general experience was that the preferred orientation of the grains is more pronounced at the beginning of the deposition than later, and after a few hundred of repeat periods, the original texture is no longer as pronounced as in the initial phase. This decrease in the degree of orientation with increasing distance from the substrate is probably correlated with the increasing Cu concentration established with the help of XRD and EPMA. Around the 共111兲 Bragg maximum, satellite peaks can be seen for the multilayer sample 共see Fig. 9兲 and the repeat period of the multilayer is 2.3 nm as derived from the position of the satellite peaks. This repeat period is significantly different from the nominal repeat period of 4.7 nm obtained from the nominal ferromagnetic Co-Cu 共3.6 nm兲 and Cu spacer 共1.1 nm兲 layer thicknesses. The serious discrepancy between the nominal and the XRD bilayer repeat periods is attributed to the surface roughness of the sample. Dividing the bilayer thickness calculated with Faraday’s law 共4.7
The results presented in this paper revealed that the electrochemical deposition of nanoscale multilayers is influenced by the exchange reaction and its influence is stronger for the Co-Cu system than that found previously for the Ni-Cu pair.36 For both systems, it is difficult to estimate what is the ratio of the amounts of copper deposited by means of the current and that produced in the metal exchange reaction. It is speculated that for the Co-Cu system in case of the cគ /0គ plated and anodically treated 共cគ /aគ 兲 samples, almost the entire spacer layer originates from Reaction 1, and a minor amount of Cu of the spacer layer is deposited by the transient at the beginning of the cathodic pulse. For multilayer samples, if the difference
Figure 10. Cross-sectional TEM image taken on the same Co-Cu/Cu multilayer as shown in Fig. 8.
Downloaded on 2015-10-19 to IP 54.210.20.124 address. Redistribution subject to ECS terms of use (see ecsdl.org/site/terms_use) unless CC License in place (see abstract).
Journal of The Electrochemical Society, 148 共3兲 C168-C176 共2001兲 between the geometrical and the AFM surface areas is taken into account, the thickness of the Cu layer deposited with the low current pulse is only 0.58 nm 共if i ⫽ ⫺0.6 mA cm⫺2 and t ⫽ 5 s). This thickness is much below the position of the first maximum of the ⌬R/R 0 vs. d共Cu兲 curve obtained for Co/Cu multilayers prepared with vacuum techniques.4-6 If the position of the first GMR maximum obtained for samples prepared with physical methods 共1.1 nm兲 is adopted, one can conclude that about half of the Cu layer is produced by the exchange reaction in our samples. A systematic investigation of the exchange reaction between copper and cobalt was carried out by Bradley and Landolt.26 By applying pulse-plating conditions, they found that the exchange reaction takes place even at the longest pulse off-times 共up to 1600 s兲. They concluded that the reason why the exchange reaction persists so long is that the growth of the copper adlayer is not epitaxial but rather columnar, and therefore uncovered cobalt-rich areas can be found on the sample surface even at the end of long pulse off-times. The nucleation of the copper islands on cobalt probably plays a significant role in the kinetics of Reaction 1. Since copper and cobalt are insoluble in each other and the inclination of the Co-Cu pair to produce intermixed metastable phases is low, the spontaneous exchange reaction automatically results in the occurrence of two segregated phases. The situation is quite opposite to the case of the Cu-Ni pair where the high mutual solubility allows the elements to deposit onto each other without a significant hindrance originating from nucleation, and therefore, the full coverage of the surface with Cu atoms can be attained even if the nominal coverage is only a monolayer. Another relevant study of the Co-Cu system24 showed that cobalt underlayers can dissolve even if a protective copper overlayer is also deposited onto it. In spite of the fact that the composition of the solutions used in the present study and by Shima et al.24 were different, Ref. 24 drew important conclusions that are valid for our case, too. It is claimed24 that the ratio of the cobalt dissolved and that deposited is low but differs significantly from zero 共it is close to 0.1兲 at the layer thickness characteristic of multilayers with good GMR. Therefore, it is possible that cobalt dissolution takes place despite the nominal relative surface coverage with copper is substantially higher than 1. This phenomenon can also contribute to the change in the thickness ratio of the alternating metal layers. Alper et al.45 also drew the attention to that cobalt dissolution during the copper pulse can be a significant factor in the formation of the interface properties of the Co-Ni-Cu/Cu multilayers. They found that the GMR measured for the Ni-Co-Cu/Cu samples increased with lowering the pH of the bath. The decrease in GMR toward less acidic solutions was attributed to the enhanced Co dissolution and the resulting rough interface. However, one should also take into account the possibility that the lifetime of the intermediates and the amount of the metal oxide and/or hydroxide deposited together with the metal can also vary with pH. Besides the exchange reaction, the total thickness of the multilayers also impacts the MR behavior of the samples. As the deposition front propagates, the morphology of the deposit surface continuously changes, and the character of the substrate becomes less and less pronounced. The surface roughness, surface morphology, crystallite size and composition achieved at the solution side of the samples differ significantly from those characteristic of the substrate side. Along with these changes, the loss in preferred crystal orientation can also be observed. The decrease in magnetoresistance with bilayer number is a consequence of the evolution of the multilayer structure as the specimen grows. Though the crystallite size increases slightly across the samples toward the solution side and this is supposed to result in an increase in the MR ratio, there are other effects that prevent the magnetoresistance from increasing. The loss in preferred orientation of the crystallites is likely to be one of the factors responsible for the decline in magnetoresistance with bilayer number. Also, the increase in the deposit surface area leads to at least two phenomena that both can cause a decrease in magnetoresistance. First, the planes of the
C175
bilayers become inclined with respect to the substrate plane.27 Second, the surface roughness evolves in a manner that finally it results in a distribution of both the bilayer thickness and the inclination angle of the bilayer planes with respect to the substrate plane. Therefore, the structural parameters measured with XRD can be regarded as mean values. The distribution of every parameter mentioned above leads to a decrease in magnetoresistance. Furthermore, Ne´eltype orange peel coupling associated with increased roughness resulting in an increased tendency of the sublayer magnetization for a ferromagnetic alignment due to magnetostatic coupling46 is also likely to be an important reason why the GMR declines with bilayer number. Conclusions 1. Co95Cu5 /Cu multilayers have been produced by using electrochemical deposition with current control. The maximum room temperature GMR achieved at H ⫽ 8 kOe was about 9%. 2. The role of the exchange reaction in the formation of the Cu spacer layer has been analyzed. It has been established that a significant part of the Cu layer was produced by the exchange reaction. If the current between the Co pulses was set to either zero 共cគ /0គ mode兲 or to a low anodic current 共cគ /aគ mode兲, the exchange reaction was still sufficient to produce a Cu spacer layer which resulted in a GMR comparable with that achieved for cគ /cគ samples. 3. The control of the deposition time of the Cu layer at a fixed current can regulate the Cu layer thickness much better than can the deposition current density at a fixed deposition time. Though the direct application of Faraday’s law to determine the layer thicknesses is not possible in this case either, the MR ratio vs. Cu layer thickness curve exhibited a maximum at about the same Cu thickness as that established for sputtered and MBE-prepared samples. 4. The surface roughness of the samples as measured by AFM is applicable to calculate the effective surface area during the deposition. The corrected bilayer thickness is in excellent agreement with that obtained with either TEM or XRD. 5. While the dc plated master alloy (Co95Cu5) contained a comparable amount of both the hcp and fcc phases, the cគ /0គ and cគ /cគ multilayer samples were composed almost exclusively of an fcc phase. 6. The substrate side of the samples shows a strong crystallographic orientation, which becomes less pronounced toward the solution side. The loss in GMR with increasing sample thickness is partly ascribed to the structural disorder developed during the deposition. Acknowledgments One of the authors 共L.P.兲 gratefully acknowledges Dr. E. To´thKa´da´r and Dr. J. To´th for their help in learning the experimental techniques of the investigation of magnetic/nonmagnetic multilayers. A part of the work was supported by the Hungarian Scientific Research Fund 共OTKA, grant F 032046兲. The XRD work has been performed on an apparatus purchased by the Eo¨tvo¨s University under grant CEF 1156. Furthermore, we have benefited from a joint collaborative research grant 共D-36/97兲 supported by the HungarianGerman Intergovernmental Science and Technology Cooperation Program. References 1. G. Binasch, P. Gru¨nberg, F. Saurenbach, and W. Zinn, Phys. Rev. B, 39, 4828 共1989兲. 2. M. N. Baibich, J. M. Broto, A. Fert, F. Nguyen Van Dau, F. Petroff, P. Etienne, G. Creuzet, A. Friederich, and J. Chazelas, Phys. Rev. Lett., 61, 2472 共1988兲. 3. T. R. McGuire and R. I. Potter, IEEE Trans. Magn., 11, 1018 共1975兲. 4. S. S. P. Parkin, R. Bhadra, and K. P. Roche, Phys. Rev. Lett., 66, 2152 共1991兲. 5. S. S. P. Parkin, Z. G. Li, and D. J. Smith, Appl. Phys. Lett., 58, 2710 共1991兲. 6. D. H. Mosca, F. Petroff, A. Fert, P. A. Schroeder, W. P. Pratt, Jr., and R. Laloee, J. Magn. Magn. Mater., 94, L1 共1991兲. 7. W. Schwarzacher and D. S. Lashmore, IEEE Trans. Magn., 32, 3133 共1996兲. 8. M. Dariel, L. H. Bennett, D. S. Lashmore, P. Lubitz, M. Rubinstein, W. L. Lechter, and M. Z. Harford, J. Appl. Phys., 61, 4067 共1987兲. 9. R. D. McMichael, U. Atzmony, C. Beauchamp, L. H. Bennett, L. J. Schwarzen-
Downloaded on 2015-10-19 to IP 54.210.20.124 address. Redistribution subject to ECS terms of use (see ecsdl.org/site/terms_use) unless CC License in place (see abstract).
C176
10. 11. 12. 13. 14. 15. 16. 17. 18.
19. 20. 21. 22. 23. 24. 25. 26.
Journal of The Electrochemical Society, 148 共3兲 C168-C176 共2001兲
druber, D. S. Lashmore, and L. T. Romankiw, J. Magn. Magn. Mater., 113, 149 共1992兲. S. Z. Hua, D. S. Lashmore, L. J. Schwarzendruber, W. Egelhoff, Jr., K. Raj, and H. D. Chopra, J. Appl. Phys., 81, 4582 共1997兲. K. D. Bird and M. Schlesinger, J. Electrochem. Soc., 142, L65 共1995兲. S. K. J. Lenczowski, C. Scho¨nenberger, M. A. M. Gijs, and W. J. M. de Jonge, J. Magn. Magn. Mater., 148, 455 共1995兲. E. A. M. van Alphen, A. H. J. Colaris, S. K. J. Lenczowski, C. Scho¨nenberger, M. A. M. Gijs, and W. J. M. de Jonge, J. Magn. Magn. Mater., 156, 29 共1996兲. P. Nallet, E. Chassaing, M. G. Walls, and M. J. Hytch, J. Appl. Phys., 79, 6884 共1996兲. E. Chassaing, A. Morrone, and J. E. Schmidt, J. Electrochem. Soc., 146, 1794 共1999兲. Y. Jyoko, S. Kashiwabara, and Y. Hayashi, J. Electrochem. Soc., 144, L5 共1997兲. A. Dinia, K. Rahmouni, G. Schmerber, H. El Fanity, M. Bouanani, F. Cherkaoui, and A. Berrada, Mater. Res. Soc. Symp. Proc., 475, 611 共1997兲. H. El Fanity, K. Rahmouni, M. Bouanani, A. Dinia, G. Scmerber, C. Me´ny, P. ´ . Czira´ki, F. Cherkaoui, and A. Berrada, Thin Solid Films, 318, 227 Panissod, A 共1998兲. Y. Ueda, N. Hataya, and H. Zaman, J. Magn. Magn. Mater., 156, 350 共1996兲. Y. Ueda, N. Kikuchi, S. Ikeda, and T. Houga, J. Magn. Magn. Mater., 198-199, 740 共1999兲. O. I. Kasyutich, T. A. Tochitskii, and V. M. Fedosyuk, Phys. Status Solidi A, 162, 631 共1997兲. M. Shima, L. Salamanca-Riba, T. P. Moffat, R. D. McMichael, and L. J. Schwarzendruber, J. Appl. Phys., 84, 1504 共1998兲. M. Shima, L. Salamanca-Riba, T. P. Moffat, and R. D. McMichael, J. Magn. Magn. Mater., 198-199, 52 共1999兲. M. Shima, L. Salamanca-Riba, and T. P. Moffat, Electrochem. Solid-State Lett., 2, 271 共1999兲. K. Attenborough, H. Boere, J. De Boeck, G. Borghs, and J.-P. Celis, Appl. Phys. Lett., 74, 2205 共1999兲. P. E. Bradley and D. Landolt, Electrochim. Acta, 45, 1077 共1999兲.
´ . Czira´ki, I. Gero¨cs, B. Fogarassy, B. Arnold, M. Reibold, K. Wetzig, E. To´th27. A Ka´da´r, and I. Bakonyi, Z. Metallkd., 88, 781 共1997兲. ´ . Czira´ki, J. G. Zheng, A. Michel, Zs. Cziga´ny, G. Nabiyouni, W. Schwarzacher, 28. A E. To´th-Ka´da´r, and I. Bakonyi, Z. Metallkd., 90, 278 共1999兲. 29. O. I. Kasyutich, W. Schwarzacher, V. M. Fedosyuk, P. A. Laskarzhevskiy, and A. I. Masliy, J. Electrochem. Soc., 147, 2964 共2000兲. 30. S. Roy, M. Matlosz, and D. Landolt, J. Electrochem. Soc., 141, 1509 共1994兲. 31. S. Roy and D. Landolt, J. Electrochem. Soc., 142, 3021 共1995兲. 32. P. Bradley, S. Roy, and D. Landolt, J. Chem. Soc., Faraday Trans., 92, 4015 共1996兲. 33. S. Roy, Surf. Coat. Technol., 105, 202 共1998兲. 34. S. Roy, in Inst. Chem. Eng. Symp. Ser., 145, 81 共1999兲. 35. S. Roy, Plat. Surf. Finish., 86, 76 共1999兲. 36. E. To´th-Ka´da´r, L. Pe´ter, T. Becsei, J. To´th, L. Poga´ny, T. Tarno´czi, P. Kamasa, I. ´ . Czira´ki, and W. Schwarzacher, J. Electrochem. Soc., 147, Bakonyi, G. La´ng, A 3311 共2000兲. 37. T. B. Massalski, Binary Alloy Phase Diagrams, ASM International, Materials Park, OH 共1990兲. 38. H. P. Klug and L. E. Alexander, X-Ray Diffraction Procedures for Polycrystalline and Amorphous Materials, Wiley, New York 共1974兲. 39. M. Uhlemann, Unpublished results. 40. ASTM Powder Diffraction Files, Joint Committee on Powder Diffraction Standards, Swarthmore, PA 共1972兲. 41. P. Villars and L. D. Calvert, Pearson’s Handbook of Crystallographic Data for Intermetallic Phases, American Society of Metals, Metals Park, OH 共1985兲. 42. Y. Ueda and M. Ito, Jpn. J. Appl. Phys., 33, L1403 共1994兲. 43. H. Zaman, A. Yamada, H. Fukuda, and Y. Ueda, J. Electrochem. Soc., 145, 565 共1998兲. 44. W. Klement, Jr., Trans. Metall. Soc. AIME, 227, 965 共1963兲. 45. M. Alper, W. Schwarzacher, and S. J. Lane, J. Electrochem. Soc., 144, 2346 共1997兲. 46. P. Fuchs, U. Ramsperger, A. Vaterlaus, and M. Landolt, Phys. Rev. B, 55, 12546 共1997兲.
Downloaded on 2015-10-19 to IP 54.210.20.124 address. Redistribution subject to ECS terms of use (see ecsdl.org/site/terms_use) unless CC License in place (see abstract).