AN ENSEMBLE OF SOM NETWORKS FOR DOCUMENT ORGANIZATION AND RETRIEVAL Apostolos Georgakis1 and Haibo Li1 and Mihaela Gordan2 1
Digital Media Laboratory (DML) Department of Applied Physics and Electronics, Ume˚a University, SE-90187, Sweden
[email protected] 2 Basis of Electronics Department Tech. University of Cluj-Napoca Cluj-Napoca, RO-3400, Romania
[email protected]
ABSTRACT In this paper a variant of the well-known self-organizing map algorithm is exploited for document organization and retrieval. An ensemble of self-organizing maps are employed in an effort to boost the performance of the standard algorithm. In doing so, the feature space is uniformly sampled and the bootstrapped sets that are created are supplied to each of the constituent members of the ensemble. The proposed variant along with the standard selforganizing map algorithm are used to partition the document repository into clusters of semantically related documents. The quality of clustering offered by the proposed variant is accessed quantitatively via information retrieval experiments using a set of test documents to query the text clusters created by the proposed algorithm. The same experiment is repeated for the standard self-organizing algorithm. An improved performance with respect to the average recall-precision curves is achieved by the proposed variant compared to the standard algorithm. 1. INTRODUCTION Document organization and retrieval has been an active research and development area for the past 30 years. An integral component in document organization is document indexing [1]. In document indexing, the body of the documents, also known as corpus, is decomposed into terms (index terms) that are used as indicators of the document contents. A fundamental problem in the aforementioned task is the evaluation of the contextual similarity between documents. In this paper, we are interested in the so-called vector space model [2, 3], where the available textual data of the training documents as well as the query-documents are encoded into numerical vectors. Each vector element corresponds to a different word type, that is, a distinct word appearance in the corpus [4]. It is generally agreed upon that the contextual similarity between documents exists
also in their vectorial representation1 . Therefore, it can be assessed by the use of any vector metric. Moreover, the documents marked as being similar or relevant to each other can also be ranked in a decreasing similarity order with the help of a vector metric. Subsequently, the numerically encoded documents can be organized using any clustering algorithm. One wellknown document organization method, capable of creating semantically related document collections is the WEBSOM [5] - [8]. The WEBSOM is based on the Self-Organizing Map (SOM) or Kohonen maps [9]. The SOMs are capable of forming a nonlinear mapping from an arbitrary high-dimensional data manifold, the so-called input space, onto a low-dimensional lattice. Low dimensional grids, usually 2D or 3D have prominent visualization properties and, therefore, are employed to visualize the highdimensional data. An extensive review of the literature on the SOM algorithm, containing nearly 5400 works, can be found in [10, 11]. Other SOM applications to document clustering are reported in [12, 13]. In this paper, we propose a modification of the SOM algorithm witch is based on bootstrapping. In doing so, the SOM algorithm is trained with slightly different versions of the feature space. Then, after the completion of the training phase, the resulted mappings of the feature space on the SOM are merged together into one and final map. This is done in order to benefit from the fact that ensemble methods lead to higher classification accuracies. In what follows, Section 2 contains a brief description of the standard SOM algorithm, whereas, the next Section describes the SOM variant which is based on bootstrap aggregation. Subsection 3.1 describes the procedure of merging the constituent SOM maps and Subsection 3.2 describes the process of aligning individual neurons in each of the constituent maps in order to generate the fi1 Treating
the documents as a bag-of-words is not the ideal method of preserving the content, currently this is the universally accepted approach.
nal SOM map. Moreover, Section 4 describes the usage of the SOM algorithm and its variant for information retrieval purposes and finally Section 5 provides the experimental results regarding the comparison between the proposed variant and the standard SOM algorithm. 2. SELF-ORGANIZING MAPS Let usndenote by X the set of vector-valued observations, T X = xj ∈ IRNw |xj = (x1j , x2j , . . . , xNw j ) , j = 1, 2, . . . , N }, where Nw corresponds to the dimensionality of the feature vectors that encode the N available documents. The set X will be addressed as feature space henceforth. Let also W denote the set © of reference vectors of the neuª rons, that is, W = wl (t) ∈ IRNw , l = 1, 2, . . . , L , where the parameter t denotes discrete time and L is the number of neurons on the lattice. Due to its competitive nature, the SOM algorithm identifies the best-matching, winning reference vector ws (t) (or winner for short), to a specific feature vector xj with respect to a certain distance metric. The index s of the winning reference vector is given by: L
s = arg min kxj − wl (t)k, l=1
(1)
where k · k denotes the Euclidean distance. The reference vector of the winner as well as the reference vectors of the neurons in its neighborhood are modified toward xj using: ( wi (t) + a(t) [xj − wi (t)] ∀i ∈ Ns wi (t) = (2) wi (t) ∀i ∈ / Ns where a(t) is the learning rate and Ns denotes the neighborhood of the winner and the transition between the time instants t and t + 1 is achieved whenever the entire feature space has been presented to the network. A neighborhood updating, especially in the early iterations, is performed in order to achieve a global ordering of the input space onto the lattice, which is crucial for the good resolution of the map [9]. The term standard SOM will henceforth denote the on-line algorithm proposed by T. Kohonen without any modifications or speed-up techniques [9]. 3. BAGGING SOM From section 2 and Eq. (2) is evident that the standard SOM algorithm is performing a prediction or even better an approximation of the probability distribution function (pdf) of the feature space. This approximation can be viewed in the updating of the reference vectors of the neurons comprising the lattice. Recently a number of ways of combining predictors have been developed [14, 15, 16]. Perhaps the simplest approach is to bag predictors. This paper proposes a variant of the standard SOM algorithm which relies in bagging, that is, on an ensemble or combination of predictors. Bagging works by applying a learning algorithm on
a number of bootstrap samples of the feature space. Each of these applications yields a clustering or classification. The resulting ensemble of classifiers is combined by taking a uniform linear combination of all the constructed classifiers. Bootstrapping is a simple but also effective approach of estimating the statistics of the feature space. The method consists of creating a number of data subsets, Xi , i = 1, 2, . . . , D, by sampling from the set X with uniform probability with replacement of each sample2 . Each instance of the standard SOM algorithm3 is then trained separately on its respective data subset and then the resulted networks are fused together in a process which will be explained in the following Subsections. Due to the fact that the SOM networks are trained on slightly different instances of the feature space (the density functions of the subsets Xi are expected to be different), then, with high probability we expect to get slightly different resulted networks. Petrakieva et. al. in [18] are outlining the problems that arise with the SOM algorithm when the reference vectors of the neurons are randomly initialized. Namely, the resulted network topologies, even in the case of using the same feature space, are not completely identical. Since the SOM algorithm performs a dimensionality reduction through the mapping of the feature space on the 2D lattice, the maps are free to twist in any direction which oftenly offers local minimizations. In contrast to the training process proposed in [18], the present paper suggests the following procedure: • Creation of the Xi , i = 1, 2, . . . , D data subsets. • Random initialization of the reference vectors for all the standard SOM algorithms. • Training of the networks (either batch training or online). • Merging of the resulted maps. This step is described in depth in Subsections 3.1 and 3.2. 3.1. Network fusion Let wij denote the ith neuron corresponding to the jth SOM map after the completion of the training phase for all the networks. Let Lij denote the set of feature vectors that are assigned to the above neuron. The first step which generally admittedly is the most difficult one is the combination of the outputs of the several SOM networks towards the formation of one final SOM map, that is to find the associations between the neurons wij , ∀i, j. For example, let suppose that there are only three SOM networks and that they are designated to extract five clusters each from the feature space. The goal is to combine the networks in a way that features to be placed in a same neuron of the final map if and only if they were assigned 2 Each feature point has a probability of ( Nw −1 )Nw ∼ 0.3679 of = Nw not appearing in each bootstrap sample [17]. 3 In total we are training D independent SOM networks.
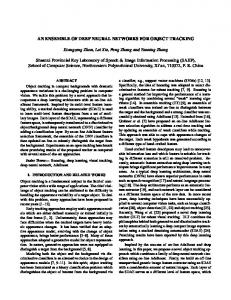
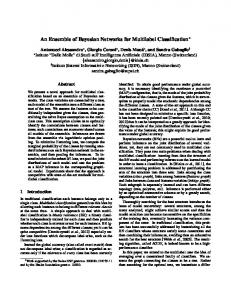
to a same neuron in both of the networks. This task is not trivial because there is no guarantee that the ith cluster in the first network corresponds to the ith cluster in the second network. So, the networks must be aligned before they can be merged. It should be noted here that we are interested in finding the groups of features that are common among various neurons; we are not interested in isolated features. In this paper, the neurons are aligned according to the assumption that neurons that are “similar” should be close to each other also in the IRNw hyper-sphere which contains the feature space. Actually, the order is reversed; neurons that are close to each other in the IRNw should be similar. That is, lets wab21 and wab43 be the neurons whose sets Lba21 and Lba43 respectively contain more common features than any other neuron couple. Then, the reference vectors corresponding to these neurons will be, with higher probability, closer to each other than another possible neuron combination under the Euclidean distance. In aligning the networks one should partition the LD neurons into L disjoint clusters. There are two constraints though that both has to be met at the same time: • Each cluster will contain only D neurons. • Each cluster will contain only one neuron from each of the D networks. The constrains simply state that each neuron of the output map is the union of just one neuron from each of the D constituent SOM maps. Under the above constrains is evident that a brute force approach ¡ to ¢the global minimization problem has complexity O LD which obviously is unacceptable even for small values of the parameter D whereas the suboptimal solution described in subsection 3.2, which relies on¢ dynamic programming, has complex¡ ity O (D − 1) L2 . Figure 1 clearly depicts the dramatic gap between the two alternatives mentioned above. 3.2. Neuron alignment In this paper the neurons are aligned according to their paired distance in the IRNw hyper-sphere. That is, if we were to merge just two networks then each neuron from the hypothetical network A would be matched with the neuron from the network B that would have been closer. Figure 2 depicts the example mentioned in the second paragraph of subsection 3.1. The first step in the dynamic programming approach is to merge networks A and B. In doing so we must compute the distance between all the pairs of neurons from map A to map B. In Figure 2 it can be seen that the neuron w11 is closer to w22 and further more w21 is closer to w52 and so on. The average vector between each pair of neurons will be used afterwards in the second level to merge the third map (network C) into the previous two networks. In merging the third map onto the previous two, we have to compute the distances between the average vectors from the previous level and the © reference ª vectors from network C. In that case the pair w11 , w22 is closer to w13 and
therefore these three neurons are grouped together. After the last network has been merged with the previous two maps we need to “build” the final network (see Figure 2). In doing so the reference vector of each neuron is the average vector of the neurons grouped together in the previous step. The last step towards the formation of the final map is the creation of the set Lif inal which is the set of documents assigned to the ith neuron of the final map. These sets are the unions of the sets corresponding to the clusters of neurons formed in the previous step. Let fij denote frequency of the jth document in the set Lif inal . If the frequency is close to the value D then more neurons in the constituent networks had that particular neuron assigned to them during the training phase. Therefore, the more frequent a document is the higher its importance to the particular neuron of the final map. That is, the documents assigned to a particular neuron are ordered into descending order of appearance. 4. APPLICATION TO INFORMATION RETRIEVAL 4.1. Corpus description The Distribution 1.0 of the Reuters-21578 text categorization corpus compiled by David Lewis [19] has been used to test the proposed SOM variant. It consists of 21.578 documents which appeared on the Reuters newswire in 1987 and were originally collected by the Carnegie group. The documents are marked up using SGML tags and are manually annotated using 135 topic categories according to their content. Since our approach is clearly a vector space approach [2], a series of actions were taken in order to encode the textual data into numerical vectors. During the first step, the SGML tags and entities in the collections were removed. Subsequently, numbers and punctuation marks were removed. The sole punctuation mark left intact was the full stop in order to provide a rough sentence delimiter. Another reason that justifies the preservation of the full stop is that collocations, that is, expressions consisting of two or more than two words are meaningful only within the scope of a sentence. Text cleaning was also applied in order to remove some common English words such as articles, determiners, prepositions, pronouns, conjunctions, complementizers, abbreviations. Non-English frequent terms were also removed by applying stopping. Subsequently, stemming was performed. Stemming refers to the elimination of the word suffixes so that the vocabulary shrinks, although it keeps the informative context of the text. It can be considered as an elementary clustering technique, with the word roots (stems) forming distinct clusters. The underlying assumption is that morphological variants of words are semantically related [20]. The commonly used Porter stemmer was applied [21]. Finally, prior to encoding the documents into vectors, the stems whose frequency was below a certain threshold were eliminated. Table 1 depicts the statistics of the corpus. The last column of Table 1 contains the number of
Brute force complexity
Dynamic programming complexity
30
5
10
10
4
10 20
10
3
10
2
10
10
10
1
10 0
0
10
10
120 100
15
80 60
120 100
15
80 60
10 40
Y−axis
10 40
20
5 Y−axis
X−axis
20
5 X−axis
Figure 1. The computational complexity between the brute force (left) and the dynamic programming approach (right). The X-axis corresponds to the number of constituent SOM networks and the Y-axis corresponds to the number of the neurons in each individual network.
Corpus Reuters-21578
Table 1. Word tokens 2.642.893
Corpus statistics. Stem types (Cut-off) Before After 28.670 4.671
documents that was used after the completion of the aforementioned preprocessing steps. The number of remaining documents in the corpus after preprocessing is nearly 12% lower than the initial value. This is due to the fact that some documents did not contain any textual information either from the beginning of the process or they have lost all their textual information due to preprocessing and thresholding steps. Such documents were rejected. The resulting corpus was partitioned into two distinct sets, a training and a testing set, according to the recommended Modified Apte split of the collection [19].
Due to the recommended splitting of the corpus some documents are not assigned to any one of the two sets. The first set, the training corpus, contains 8.762 documents and it is used during the training phase of the algorithms. The second set contains 3.009 documents and it is used during the recall phase of both the standard SOM algorithm and the SOM variant.
Number of documents 19.043
4.2. Language Modeling From a statistical point of view, the contextual similarities between documents can be evaluated using the frequency of appearance of the word types. Unfortunately, a simple count of the word types is not enough. In the majority of the techniques that are exploited in statistical language modeling [3], for every word type that is being encoded, its preceding word types in the sentence (history) are taken into consideration. Let V = {w1 , w2 , . . . , wNw } denote the set of word types (vocabulary) found in the corpus, where Nw = |V | denotes the vocabulary size. The a ∗ priori probability P (w1∗ w2∗ . . . wm ) of the word sequence ∗ ∗ ∗ ∗ w1 w2 . . . wm with wr ∈ V can be expressed as the product of conditional probabilities: ∗ P (w1∗ w2∗ . . . wm )=
m Y
P (wr∗ |hr )
(3)
r=1
© ª ∗ where hr = w1∗ w2∗ . . . wr−1 denotes the history of the rth word. A widely used language model based on Eq. (3) is the n-gram, where n denotes the number of preceding
Figure 2. The alignment of three networks and the subsequent merging into one final map. words taken into consideration [3]. In this paper, we adopt the bigram model where only one preceding word is used to encode each word, i.e.: P (wr |hr ) ' P (wr |wr−1 ) =
η (wr−1 , wr ) , η (wr−1 )
(4)
with η (wr−1 , wr ) and η (wr−1 ) denoting the number of observed bigrams (wr−1 , wr ) and word types wr−1 , respectively, in the training corpus. In the following, the discussion will be based on the conditional probabilities (4) computed for the generic observed word bigram blm = (wl , wm ). Let xlm = P (wm |wl ), l, m = 1, 2, . . . , Nw , denote the conditional probability of the bigram blm over the entire corpus. In encoding the ith document of the training corpus we will employ the conditional probabilities for each¡ of the bigrams found in the corpus. Let us construct ¢ the Nw2 × 1 vector that holds the conditional probabilities of the bigrams found in the ith document of the training corpus:
xi =
|V | Nw X X l=1 m=1
xlm elm
=
δ11 (i)x11 , δ12 (i)x12 , ..., δ1Nw (i)x1Nw , ..., δNw 1 (i)xNw 1 , ..., δNw Nw (i)xNw Nw
T
(5)
¡ ¢ where elm denotes the Nw2 × 1 unit vector having one in the (l × Nw + m)th entry and zero elsewhere, and δlm (i) denotes the delta function that equals 1 if the bigram blm is present in the ith document and is zero otherwise.
5. EXPERIMENTAL RESULTS In evaluating the document organization through retrieval, both algorithms exploit the document clusters formed during the training phase. The query-documents undergo all the preprocessing steps described earlier and are encoded into feature and indicator vectors. These vectors substitute the vectors in Eq. (1). For each query, the algorithms identify the winning neuron on the map and retrieve the training documents associated with the winner. The winner neuron in both algorithms corresponds, with high probability, to the cluster which contains the most relevant documents in the training corpus with respect to the documentquery. The retrieved documents are then ranked according to their distance from the query-document using the Euclidean distance. Finally, the retrieved documents are labeled as either relevant or not to the query-document, with respect to the annotation category they bear. For each query, this classification leads to a different partition of the training set according to the retrieval volumes. Table 2 is the 2 × 2 contingency table which shows how the collection of the documents is divided. In the contingency table, n1 corresponds to the total number of relevant documents in the corpus and n2 denotes the number of retrieved documents [1]. The effectiveness of the proposed algorithm against the standard SOM is measured using the precision and the recall ratios [1, 22]. Precision is defined as the proportion of retrieved documents that are relevant, P =
r , n2
(6)
whereas, recall is the proportion of relevant documents that are retrieved, r R= . (7) n1 As the volume of retrieved documents increases the above ratios are expected to change. The sequence of
Table 2. Contingency table for evaluating retrieval. Retrieved Not-Retrieved Relevant r x n1 = r + x Not Relevant y z n2 = r + y
’Acq’ category
’Earn’ category
0.55
0.65 Zipf variant Standard SOM
Zipf variant Standard SOM
0.5 0.6 0.45
0.55 Precision
Precision
0.4
0.35
0.5
0.3
0.25 0.45 0.2
0.15 0.1
0.2
0.3
0.4
0.5 Recall
0.6
0.7
0.8
(a)
0.9
0.4 0.1
0.2
0.3
0.4
0.5 Recall
0.6
0.7
0.8
0.9
(b)
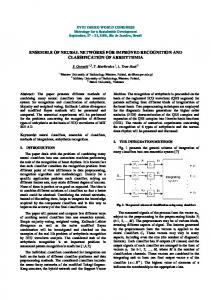
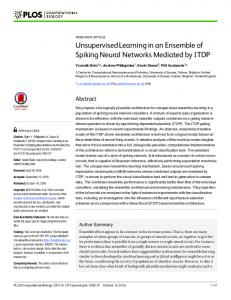
Figure 3. The average recall-precision curves of the standard SOM and the proposed variant for: (a) the “acq” category and (b) the “earn” category. (recall, precision) pairs obtained yields the so-called recall-precision curve. An average over all the curves corresponding to the same topic that were obtained from the test set produces the average recall-precision curve [1]. In order to evaluate the performance of the algorithms we have chosen the “acq” and “earn”categories. Figures 3a and 3b depict the average recall-precision curves for the standard SOM and the proposed variant for the two topics with the highest frequencies. The first one corresponds to the “acq” topic and the second to the “earn” topic. For small recall volumes the standard SOM performs sightly better than the proposed variant in the “acq” category but this is temporarily since when the recall volume gets bigger the performance of the standard algorithm degrades faster. On the other hand, for the “earn” category the results are more clear; the proposed variant outperforms the standard SOM in almost every recall volume. 6. FUTURE WORK One problem that the proposed SOM variant faces is the total destruction of the topological correlation for adjacent neurons on the final map. Being aware of the fact that the SOM algorithm is a prime candidate for visual exploration of any short of information repository, it becomes evident that the above mentioned shortcoming should be addressed properly. 7. CONCLUSIONS The bootstrapping technique has motivated us to investigate the performance of the standard SOM algorithm un-
der slightly modified version of the feature space. The ensemble of classifiers that were gathered after the training phase of the standard SOM algorithm were merged into one final SOM network. The proposed SOM variant was compared against the standard SOM, when both algorithms were applied for document organization using the Reuters-21578 corpus. It has been demonstrated that the performance of the proposed SOM, with respect to the average recall-precision curves is superior to the standard SOM algorithm. 8. REFERENCES [1] R. R. Korfhage, Information Storage and Retrieval, New York: J. Wiley, 1997. [2] G. Salton and M. J. McGill, Introduction to Modern Information Retrieval, McGraw Hill, 1983. [3] D. Manning and H. Sch¨utze, Foundations of Statistical Natural Language Processing, Cambridge, MA: MIT Press, 1999. [4] R. B. Yates and B. R. Neto, Modern Information Retrieval, ACM Press, 1999. [5] S. Kaski, T. Honkela, K. Lagus, and T. Kohonen, “WEBSOM-self-organizing maps of document collections,” Neurocomputing, vol. 21, pp. 101–117, 1998. [6] K. Lagus, T. Honkela, S. Kaski, and T. Kohonen, “WEBSOM for textual data mining,” Artificial Intelligence Review, vol. 13, pp. 345–364, 1999.
[7] T. Kohonen, S. Kaski, K. Lagus, J. Saloj¨arvi, V. Paatero, and A. Saarela, “Organization of a massive document collection,” IEEE Trans. on Neural Networks, vol. 11, no. 3, pp. 574–585, 2000. [8] K. Lagus, S. Kaski, and T. Kohonen, “Mining massive document collections by the WEBSOM method,” Information Sciences, vol. 163, pp. 135– 156, 2004. [9] T. Kohonen, Self Organizing Maps, Springer-Verlag, 3rd edition, 2001. [10] S. Kaski, J. Kangas, and T. Kohonen, “Bibliography of self-organizing map (SOM) papers: 19811997,” Neural Computing Surveys, vol. 1, pp. 102– 350, 1998. [11] M. Oja, S. Kaski, and T. Kohonen, “Bibliography of self-organizing map (SOM) papers: 1998-2001,” Neural Computing Surveys, vol. 3, pp. 1–156, 2003. [12] A. Rauber and D. Merkl, “The somlib digital library system,” in Proc. of 3rd Europ. Conf. on Research and Advanced Technology for Digital Libraries (ECDL’99), 1999. [13] D. Roussinov and H. Chen, “Information navigation on the web by clustering and summarizing query results,” Information Processing and Management, vol. 37, no. 6, pp. 789–816, 2001. [14] L. Breiman, “Using iterated bagging to debias regressions,” Machine Learning, vol. 45, no. 3, pp. 261–277, 2001. [15] P. Domingos, “A unified bias-variance decomposition for zero-one and squared loss,” in Proc. of 17th Conf. of the American Association for Artificial Intelligence (AAAI’00), 2000, pp. 564–569. [16] B. Bakker and T. Heskes, “Clustering ensembles of neural network models,” Neural Networks, vol. 12, pp. 261–269, 2003. [17] B. Efron and R. J. Tibshirani, An introduction to bootstrap, Chapman & Hall, 1993. [18] L. Petrakieva and C. Fyfe, “Bagging and bumping self-organising maps,” Computing and Information Systems Journal, 2003. “Reuters-21578 text categoriza[19] D. D. Lewis, tion test collection, distribution 1.0,” 1997, http://kdd.ics.uci.edu/databases/reuters21578/reuters21578.html. [20] W. B. Frakes and R. Baeza-Yates, Information Retrieval: Data Structures and Algorithms, Upper Saddle River: Prentice-Hall, 1992. [21] M.F. Porter, “An algorithm for suffix stripping,” Program, vol. 14, no. 3, pp. 130–137, 1980.
[22] F. Sebastiani, “Machine learning in automated text categorization,” ACM Computing Surveys, vol. 34, no. 1, pp. 1–47, 2002.