Broken Bar Fault Detection using Fused DWT-FFT in FPGA Platform Parth Sarathi Panigrahy, Pratyay Konar and Dr. Paramita Chattopadhyay* Department of Electrical Engineering, Indian Institute of Engineering Science and Technology, Shibpur, Howrah, India
[email protected],
[email protected],
[email protected] Abstract— This paper proposes a FPGA friendly fused DWTFFT based technique for broken rotor bar fault detection of induction motor. Discrete wavelet transform is implemented in FPGA platform realizing its time-frequency perseverance quality. The smallest length ‘haar’ wavelet is capable for detecting broken rotor bar fault with a satisfactory level of accuracy. Since haar wavelet is used the computational burden and resource utilization are reduced as compared to others. In addition to that significant reduction in FFT computation to analyze the spectrums of specific band makes this approach very FPGA friendly. Index Terms— Condition monitoring, field-programmable gate arrays (FPGAs), Broken rotor bar fault, DWT, FFT, Vibration analysis.
I. INTRODUCTION Among different rotating machines, Induction motors covers around 85% of worldwide power consumption with its various industrial applications. These are subjected for large production continuously and therefore efficient on-line monitoring of such motor condition becomes current demand from many industrial fields. On-line condition monitoring is considered smart as without any trained personnel the associated fault can be detected and classified [1]. Unlike offline monitoring procedure, the motor does not need to shutdown periodically. There are several faults that are associated with Induction motors that lead to catastrophic failure such as mechanical imbalance or misalignment which appear to be easily traceable and obvious defects. The problem with squirrel cage induction rotors is that the defects in rotor bar particularly are invisible to convenient analysis, yet can still be catastrophic to the motor [2].Various types of rotor designs such as casting or pressing of rotor bars, the type of bar material etc. are responsible to develop the rotor defects in its continuous run operation. Vibration analysis in frequency domain is one of the most popularly utilised techniques for fault detection of rotating machines. Some other employed methods for fault detection of induction motors are methods based on motor current signature analysis (MCSA). Due to non-invasive property, these two methods are very much appreciable. The frequency analysis for vibration signal is found more acceptable in many papers as most of the faults of the induction motors produce strong features in vibration. But a necessary spectrum analyser for this purpose is very expensive. So, the necessity of a dedicated and low cost frequency analysing instrument is very much required.
Emerging trend for online vibration monitoring necessitates capturing small variation of the fault frequencies accurately which are buried in the signal. The algorithms should be hardware friendly and minimise the cost and complexity. Ansari et al. [3] proposed a multi channel vibration analyzer with multi channel data acquisition system. Bilski used commercially available acquisition board and Lab View environment to develop a Virtual spectrum analyzer [4]. A fast digital signal processing equipment with dedicated analyzer and a display unit was developed by Betta et al [5]. They also proposed a vibration spectrum analyzer using Fast Fourier Transform (FFT) with adjustable parameters [6]. Here different fault spectrum was simulated using a signal generator. A new era began when the Field Programmable Gate Array (FPGA) were proposed [7] to be used for the vibration analysis of motor. Vite-Frias developed an embedded system in FPGA [8] to detect induction motor failures by measuring the vibration transient signals at the start-up using Discrete Wavelet Transform (DWT). On-line monitoring of motor faults implemented in low cost FPGA has also been reported in [9]. The present paper proposes an efficient and economic fault detection device by utilising the advantages of various signal processing tools in cascade. In this work DWT is implemented in FPGA platform, understanding its time-frequency perseverance quality. The fundamental rotational frequency component, which is generated due to broken rotor bar fault [10], is captured by applying FFT, to the desired narrower band obtained by DWT. This technique provides less computational complexity, which is suitable for low-cost FPGA implementation. II. VIBRATION ANALYSIS This section presents the theoretical background of the different signal processing techniques used in the proposed methodology. The experimental process for capturing the vibration signal is also described. The results obtained using each signal processing tools are furnished and compared, followed by the implementation of DWT in FPGA. A. Experimental Setup and Data Acquisition Spectra Quest Machinery Fault Simulator (MFS) [12] is used for simulating different induction motor faults in this work. Two identical 3 ph induction motors, one healthy and the other with three broken bar of rating 1/3 H.P., 190 V, 50 Hz, 2980 rpm were used. The radial vibration data from the motor frame
978-1-4799-5912-9/14/$31.00 ©2014 IEEE
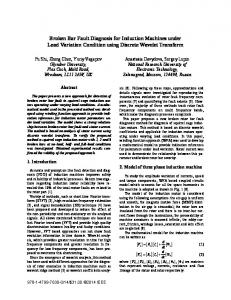
is captured using piezo-electric type accelerometer probe (100mV/g). The experimental setup is shown in Fig 1. Radial frame vibration data (2048 pt) is recorded at a sampling frequency 2560 Hz. Studies of behavioral difference under no-load and finite-load conditions of induction motor are done. The load is varied from 0.5 lb-in to 10 lb-in given with the help of brake-clutch mechanism and belt pulley system [12]. The result obtained for medium range load (5 lb-in) to the induction motor is shown in this paper. Successful results are also obtained for other loading condition using proposed method.
Fig 2: FFT of the Acquired Signal
C. DWT Analysis DWT is shown as an extremely good signal processing tool for analysis of non-stationary or transient signals [26].
Fig 1: Experimental Setup
B. FFT Analysis Discrete Fourier transform (DFT) [11] of a time domain data sequence x(n) for an N-point data set, is given as, N −1
X (k ) = ∑ x(n)WNnk 0 ≤ k ≤ N-1 n =0
where n and k are the discrete-time and frequency indexes, respectively. The Twiddle factor W is given by
W
nk N
nk ⎞ . ⎛ = exp⎜ − j 2π ⎟ N⎠ ⎝
Apart from low energy content sidebands high amplitude of the fundamental rotational frequency are obtained in the FFT spectrum of the steady-state radial vibration signal for Broken Rotor Bar Fault. Fig. 2(a), Fig. 2(c) shows the time-domain signal for a healthy motor and its corresponding spectrum respectively. Fig. 2(b), Fig. 2(d) shows the time-domain signal for a Broken Bar faulty motor and its corresponding spectrum respectively. In Fig. 2(d), the amplitude of the fundamental vibration frequency has greatly increased (3-5 times) due to Broken Bar fault. It is important to note that although the desired frequency component of interest is at around 49 Hz, FFT makes unnecessary computation for the entire frequency range (0-1280) Hz as the sampling frequency is set at 2560 Hz.
Fig 3: Mallat algorithm.
The discrete wavelet transform (DWT) is usually computed using the pyramidal algorithm proposed by Mallat as represented in Fig. 3. This algorithm is based on a pair of low pass (h), high pass (g) filters, followed by down sampler .The output of the high-pass filters are known as details dj(n) and those of the low-pass filters are known as approximations aj(n). Down sampling by a factor of 2 compresses and decimates half of the output samples. In practice compressing is processing of a down sampler output till the occurrence of next output. Therefore, at each level of DWT, not only number of samples gets halved but also sampling time becomes doubled. Iterative process (convolution followed by down sampling) between consecutive levels in Mallat’s hierarchical algorithm, leads to half the active frequency band. As a result, the frequency band for approximations and details are obtained as:
⎡ fs ⎤ ⎡ fs ⎤ ⎢0, 2 L +1 ⎥ and ⎢0, 2 L ⎥ respectively ⎣ ⎦ ⎣ ⎦ for a required decomposition level L. All the band of frequencies that can be extracted from the signal acquired at a sampling frequency (fs) of 2560 Hz is shown in Table-I. The decomposed output of DWT results in logarithmic finer resolution towards lower frequency zone. Hence, DWT is considered as more appropriate for detection of defect frequency that exists in lower frequency zone.
Thus, only level 4 DWT is implemented in FPGA platform. Fig. 4(a) shows the time domain vibration signal for a healthy motor, and Fig. 4(b) shows the time-domain vibration signal for the motor with broken rotor bar fault. The approximate coefficient for level 4 DWT decomposition is shown in Fig. 4(c) for the healthy motor and in Fig. 4(d) for the motor with broken rotor bar fault.
TABLE I. DWT DECOMPOSITION LEVEL FREQUENCY BANDS FOR A SAMPLING FREQUENCY FS = 2560 HZ Level
Approximation Bandwidth
Detail Bandwidth
1
[0, 640]Hz
[640, 1280]Hz
2
[0, 320]Hz
[320, 640]Hz
3
[0, 160]Hz
[160, 320]Hz
4
[0, 80]Hz
[80, 160]Hz
5
[0, 40]Hz
[40, 80]Hz
6
[0, 20]Hz
[20, 40]Hz
As the DWT structure depends solely on two bandpass filters, the computational complexity is influenced by the filter length. The basic filters in discrete time domain were found by Haar with a clear idea of blocking the constant through highpass filter and allowing it through low-pass filter. This justification can be found by z-domain system function for −1 −1 and 1 + z high and low pass filters given by 1 − z 2 2 respectively. So the coefficients used for high pass filter are 0.5, -0.5 and that of low pass filter are 0.5, 0.5. Extending the concept of Haar, the family of Daubechies filter is evolved to enhance the smoothness at low pass side and high fluctuations at high pass side. For instance, a polynomial with lower degree represents high fluctuation signal and this phenomenon can be obtained by cascading several 1 − z −1 functions. In this way the order of the filter increases. This leads to increase in computational burden on digital system with implementation of higher order filter in Daubechies family. Further, it is important to select an appropriate filter, as various features of the signal are highlighted distinctly with different types of filters. In application to fault diagnosis of induction motor, it becomes important to study the effect of different filter coefficients for each fault. In this work it was realised that, the proposed approach can efficiently detect the rotational frequency spectrum using Haar filter coefficients in DWT structure for detection of ‘broken rotor bar’ fault. For broken rotor bar detection, since the desired frequency component of interest is at around 49 Hz, bandwidth (0-80Hz) needs to be extracted which corresponds to 4th Level DWT.
Fig 4: DWT Approximate coefficients (A4) of the Acquired Signal
D. Combined DWT with FFT Analysis The idea of combining DWT with FFT for analysing vibration signal to detect broken rotor bar fault is to tap the advantages of both of these signal processing tool. DWT is used to extract only the specific frequency band of interest, and the FFT is used to estimate the precise location of the characteristic fault frequency within this band [13]. Thus, by combining DWTFFT the frequency spectrum of the signal can be zoomed, without affecting the FFT frequency resolution. Moreover, by this technique we can obtain the same frequency resolution with reduced number of data length and hence it finds suitability for FPGA implementation. The processing time and resource utilization can be considerably optimized. Fig 5 and 6 shows the application of the proposed combined DWT-FFT analysis. Fig. 5(a) and Fig 6(a) shows the timedomain vibration signal for a healthy motor and a motor with broken rotor bar fault respectively. To extract the frequency band containing the fault frequency (1X RPM) DWT is applied to the time domain signal to obtain the level-4 approximation coefficients shown in Fig 5(b) and Fig 6(b). Next, FFT of these coefficients gives the zoomed frequency spectrum where the fault frequency can be identified with significant increase in the fundamental component Fig 6(c). Thus, the combined DWT-FFT technique enhances the detectability of the fault frequency component with less resource and computation time.
Fig. 7: Schematic representation of proposed work
Fig 5: Combined DWT and FFT analysis for Healthy Motor
Fig 6: Combined DWT and FFT analysis for Broken Rotor Bar Fault
E. FPGA-Based Implementation The schematic of the proposed methodology for FPGA implementation is shown in Fig 7. 1.1 DWT in FPGA The whole DWT Algorithm is developed using Xilinx System Generator (XSG) [14] maintaining fixed point format of 16 bit data width in 2’s complement representation. One bit is allocated for each sign part and integer part where remaining 14 bits are kept for fractional part.
XSG is a module in Simulink developed by Xilinx in order to generate VHDL code directly from functions implemented in Matlab. A Matlab Simulink model of 4-level DWT-IDWT structure is developed using blocks from Xilinx Block set for the proposed work. For instance, 2-level DWT-IDWT model is presented in Fig. 8. Instead of taking the raw signal from ADC at this stage, the test inputs are taken from a developed look up table. Using 128k ROM from ALTIUM IP, the input data is stacked and processed by 12 bit counter which changes the address location of input. The required clock frequency corresponding to sampling rate is obtained from global clock using the frequency generator present in Altium. The data from ROM is fed to the developed core (green coloured) of DWT algorithm. The output is observed in digital and analogue domain using logic analyser, titled as LAX_4K16( memory 4k and 16 bit width). In this way the total structure, from ROM to logic analyser including several other blocks is made schematically. The top schematic was compiled, synthesized, built and programmed successfully to FPGA .The result from the device view in live design is compared with result from Matlab. Logic analyser used in the structure is treating the data as unsigned and shows the analogue signal accordingly. But as the total functionality was done with signed 2’s compliment form, the interpretation in analogue signal from logic analyzer appears as wrong. So, to take care of this problem and to realize the pattern at least, the signal output is added with offset of 1pu constant. After adding the offset of 1pu the pattern of different details and approximations can be seen using LAX analogue output. The whole structure developed in altium is shown in Fig. 9. The target FPGA is Spartan3AN XC3S1400AN from Xilinx working at an operating clock frequency of 50 MHz
Fig 8: DWT implementation using Xilinx System Generator (XSG)
results is termed as error signal. The energy or the RMS value of the error signal is found and given in Table II. It can seen that FPGA output for DWT algorithm is very satisfactory realising the ignorable error from Table II. However, error at each level is propagated forward and goes on increasing as we move further in the hierarchy due to cumulative computational error. 1.2 FFT of the DWT output from FPGA The FFT spectrums of the decoded analogue output from FPGA corresponding to 4th level approximation can be done to detect broken rotor bar fault. The sub-band analysis developed by DWT gives different advantages which are as follows: Fig 9: Altium Schematic of DWT
Fig 10 and Fig 11 presents the respective results obtained from Matlab (wavemenu) and FPGA Logic analyser. The signals highlighted as SIGNAL, D1, D2, D3, D4, A4 in Fig 10 are, input signal, details (D) and approximation (A) respectively corresponding to 4th level DWT with adding an offset of 1. This is done to make the result all positive values for unipolarity voltage level at Logic Analyser. Remaining signals are the actual output from FPGA giving visually wrong interpretation of the pattern, though the decoded analogue data is the real correct data used for FFT. The output data obtained at each DWT level from FPGA and Matlab (wavemenu) is compared assuming the Matlab output as standard output. The comparison reveals that, the resulting output of FPGA at each DWT level differs by a factor of 0.707L from Matlab output, where L is the number of level. This happens due to two modifications applied in the algorithm: 1. Selection of filters coefficients are 1.4 times of actual Haar coefficients. 2. Each level output is scaled down by 2 in order to take care of over flow. Hence, each level output from FPGA is multiplied to appropriate factor and then it is compared with Matlab (wavemenu) result. The time domain difference between these
1.
2.
The fault frequency is captured using 128 point FFT for 4th level approximation coefficients whereas 2048 point FFT would be required if the input data were analysed, maintaining same resolution of 1.25 Hz. This phenomenon of DWT is interpreted as ‘zooming’ the desired band of interest out of the entire spectrum. DWT creates opportunity to diagnose multi-class fault, analysing various band which may carry different fault features in both time and frequency domain.
Fig 10: Matlab (wavemenu) output of DWT
5.
6.
7.
8.
9. Fig 11: FPGA output of DWT TABLE II.
RMS ERROR OF FPGA OUPUT
Different decomposed signal
|e(n)|
Detail (level-1)
0.7 x 10⁻⁴
Detail (level-2)
0.9 x 10⁻⁴
Detail (level-3)
1.3 x 10⁻⁴
12.
Detail (level-4)
1.7 x 10⁻⁴
13.
Approximation (level-4)
5.1 x 10⁻⁴
III. CONCLUSION This paper proposes a fused DWT-FFT based technique for analysis of vibration signal to meet the need of a cost-effective digital instrument for motor fault detection. It is clear that, DWT is very much suitable for making sub-band using appropriate wavelet filter. Thus it creates an opportunity to identify the different fault classes. Keeping in view, DWT has been implemented in the FPGA platform. The result obtained from FPGA is found to be satisfactory by considering the errors in the Table II. Interestingly, the smallest length Haar filter, is able to identify the broken bar fault efficiently, which minimizes the resource utilization. Further optimization of resource for DWT implementation can be suggested by only implementing the necessary branch in the hierarchal structure. In addition to that significant reduction in FFT computation to analyze the spectrums of specific band makes this approach very FPGA friendly. REFERENCES 1.
2.
3.
4.
10.
A. O. Moreno, R. J. R.Troncoso, J.A. V.Frias, J. R. R.Gillen and Arturo Garcia-Perez, “Automatic Online Diagnosis Algorithm for Broken-Bar Detection on Induction Motors Based on Discrete Wavelet Transform for FPGA Implementation,” IEEE Trans. Ind. Electron. vol. 55, no. 5, pp. 2193 – 2202, May 2008. J. Cibulka, M.K. Ebbesen, G. Hovland, K.G. Robbersmyr and M.R. Hansen, “Modeling, Identi cation and Control,” vol. 33, no. 2, pp. 69-86, 2012. S. A. Ansari and R. Baig, “A PC-based vibration analyzer for condition monitoring of process machinery,” IEEE Trans. Instrum. Meas., vol. 47, no. 2, pp. 378–383, Apr. 1998. P. Bilski and W. Winiecki, “Virtual spectrum analyzer based on data acquisition card,” IEEE Trans. Instrum. Meas., vol. 51, no. 1, pp. 82–87, Feb. 2002.
11.
14.
G. Betta, C. Liguori, and A. Pietrosanto, “A multi-application FFT analyzer based on DSP architecture,” IEEE Trans. Instrum. Meas., vol. 50, no. 3, pp. 825–832, Jun. 2001. G. Betta, M. D’Apuzzo, C. Ligouri, and A. Pietrosanto, “An intelligent FFT-analyzer,” IEEE Trans. Instrum. Meas., vol. 47, no. 5, pp. 1173–1179, Oct. 1998. G. Betta, C. Ligouri, A. Paolillo, and A. Pietrosanto, “A DSP-based FFTanalyzer for the fault diagnosis of rotating machine based on vibration analysis,” IEEE Trans. Instrum. Meas., vol. 51, no. 6, pp. 1316–1322, Dec. 2002. J. A. Vite-Frias, R. J. Romero-Troncoso, and A. Ordaz-Moreno, “VHDL core for 1024-point radix-4 FFT computation,” in Proc. Int. Conf. ReCon- Fig, Puebla, Mexico, 2005, p. 24. C. R. Donate, R. J. R. Troncoso, A. G. Perez, D. A. Montes, “FPGA based embedded system for induction motor failure monitoring at the start-up transient vibrations with wavelets,” in Int. Symp. Indus. Embed. Sys., vol. pp. 208-214, June 2008. L.M.C. Medina, R. J. R. Troncoso, E. C. Yepez, J. J. R. Magdaleno, J. R. M. Almaraz,,” FPGA-Based Multiple-Channel Vibration Analyzer for Industrial Applications in Induction Motor Failure Detection,” IEEE Trans. Instrum. Meas., vol. 59, no. 1, Jan 2010. G. Proakis and D. K. Manolakis, Digital Signal Processing, Principlesand Applications, 4th ed. Englewood Cliffs, NJ: PrenticeHall, 2006. Spectra Quest, Inc., USA, Machinery fault Simulator (MFS) - User Manual, 2005. N. Roy, P. Purkait and K.Bhattacharya, “Application of wavelet and fourier transforms for vibration analysis of motor”, IEEE Indicon 2005 Conference, Chennai, India, pp 609-613, 11-13 Dec. 2005. System Generator for DSP, User guide, UG640 (13.1), Mar., 2011.