Cost-Time Sensitive Decision Tree with Missing Values1 Shichao Zhang1, 2, Xiaofeng Zhu1 , Jilian Zhang 3 , Chengqi Zhang2 1
Department of Computer Science, Guangxi Normal University, Guilin, China 2 Faculty of Information Technology, University of Technology Sydney P.O.Box 123, broadway, NSW2007, Australia 3 School of Information Systems, Singapore Management University {zhangsc, chengqi}@it.uts.edu.au,
[email protected],
[email protected]
Abstract. Cost-sensitive decision tree learning is very important and popular in machine learning and data mining community. There are many literatures focusing on misclassification cost and test cost at present. In real world application, however, the issue of time-sensitive should be considered in costsensitive learning. In this paper, we regard the cost of time-sensitive in costsensitive learning as waiting cost (referred to WC), a novelty splitting criterion is proposed for constructing cost-time sensitive (denoted as CTS) decision tree for maximal decrease the intangible cost. And then, a hybrid test strategy that combines the sequential test with the batch test strategies is adopted in CTS learning. Finally, extensive experiments show that our algorithm outperforms the other ones with respect to decrease in misclassification cost.
1
Introduction
Inductive learning techniques have met great success in building models that assign testing cases to classes in [1, 2]. Traditionally, inductive learning built classifiers to minimize the expected number of errors (also known as the 0/1 loss). Cost Sensitive Learning (CSL) is an extension of classic inductive learning for the unbalance in misclassification errors. Much previous work of CSL has focused on how to minimize classification errors. However, there are different types of classification errors, and the costs of different types of errors are often very different. For example, for a binary classification task in medical domain, the cost of false positive (FP) and the cost of false negative (FN) are often quite different. In addition, misclassification cost is not the only cost to be considered when applying the model to new cases. In fact, there are a variety of costs are often referred in cost-sensitive learning in [3], such as, misclassification cost, test cost, waiting cost, teacher cost, and so on. Much precious research focuses on test cost and misclassification cost in [4-7] and select some attributes to test in order to minimize the total cost. They considered not only the misclassification cost but als o test cost instead of the right ratio of the 1
This work is partially supported by Australian large ARC grants (DP0559536 and DP0667060), a China NSF major research Program (60496327), China NSF grant for Distinguished Young Scholars (60625204), China NSF grants (60463003), an Overseas Outstanding Talent Research Program of Chinese Academy of Sciences (06S3011S01), an Overseas-Returning High-level Talent Research Program of China Ministry of Personnel, a Guangxi NSF grant, and an Innovation Project of Guangxi Graduate Education (2006106020812M35).
classification. But in these work, the test cost and the misclassification cost have been defined on the same cost scale, such as dollar, which is incurred in a medical diagnosis. For example, the test cost of attribute A 1 is 50 dollars, A 2 is 20 dollars, the cost of false positive is 600 dollars, and the cost of false negative is 800 dollars. But in fact, a same cost scale is not always reasonable. For sometimes we may encounter difficulty in defining the multiple costs on the same cost scale. It is not only a technological issue, but also a social issue [20, 21]. For example, in medical diagnosis, how much money we should assign for a misclassification cost? So we need to involve the costs with different scales in cost-sensitive learning. Next, it is necessary for considering waiting cost, which is defined as “the cost of performing a certain test may depend on the timing of the test” [3] in medical analysis. Time -sensitive costs are relatively common. For example, in any classification problem that requires multiple experts, one of the experts might not be immediately available. That will be paid the cost of waiting. The research on waiting time has broadly been studied in economics [8], medical service [9], and so on, but a little research [6, 10] can be found in cost-sensitive learning. Hence, it is necessary to take the waiting time into account in cost-sensitive learning. Thirdly, the data is often incomplete in real-world applications, i.e. the data may contain missing values . There are many methods [11, 12] to handle the missing data and there are only a little literatures [4-7] focused on dealing with missing values in cost-sensitive learning. How to deal with the missing values in training sets and in test sets is still a hot issue in cost-sensitive learning. In this paper, waiting cost (WC) will be defined firstly and talked about with misclassification cost and test cost in cost-sensitive learning later. Then cost-time sensitive decision tree (referred to CTS decision tree) will be constructed with missing values that are appearing in training sets as well in test sets. Next, a hybrid test strategy in which the usually sequential test strategy and single batch strategy will be combined to consider is proposed after constructing the cost-time sensitive decision tree. Different from the existing methods, our method presents some characteristics as fellows: 1) Introducing a new cost concept—waiting time cost—in details in cost-sensitive learning based on the research in medical application and economics. 2) In training set examples, the CTS decision tree is built based on a new attribute splitting method which is a trade-off among classification ability, misclassification cost and tangible cost (including test cost and waiting cost). 3) A hybrid test strategy which can receive the most decrease for misclassification cost or intangible cost in limited tangible costs is proposed for the test examples with missing values in order to test the constructed CTS decis ion tree. The rest of the paper is organized as follows. In section 2 we review the related work. Then we present our methods in section 3 and experimental results will be presented in section 4. Finally, in section 5 we will conclude our work with a discussion of future work.
2 Review of Pervious Work Cost-sensitive learning was first applied to the medical diagnosis for solving various problems. In real-world applications, there are many other costs besides the
misclassification cost in [3]. We follow the categorization as mentioned in [13] and give a refined review in category 4 on classifiers sensitive to both attribute costs and misclassification costs as follows: l Classifiers minimizing 0/1 loss. This has been the main focus of machine learning, from which we mention only CART and C4.5. They are standard top-down decision tree algorithms. C4.5 introduced the information gain as a heuristic for choosing which attribute to measure in each node. CART uses the GINI criterion. Weiss et al. [14] proposed an algorithm for learning decision rules of a fixed length for classifications in a medical application; there are no costs (the goal is to maximize prediction accuracy). l Classifiers sensitive only to attribute costs. The splitting criterion of these decision trees combines information gain and attribute costs in [15, 16]. These policies are learned from data, and their objective is to maximize accuracy (equivalently, to minimize the expected number of classification errors) and to minimize expected costs of attributes. l Classifiers sensitive only to misclassification costs. This problem setting assumes that all data is provided at once [17], therefore there are no costs for measuring attributes and only misclassification costs matter. The objective is to minimize the expected misclassification costs. l Classifiers sensitive to both attribute costs and misclassification costs. More recently, researchers have begun to consider both test and misclassification costs: [4-7, 18] proposed a new method for building and testing decision trees that minimizes the sum of the misclassification cost and the test cost. The objective is to minimize the expected total cost of tests and misclassifications. Both algorithms learn from data as well. As far as we know, some researchers believe that it is necessary to consider the misclassification cost and test cost simultaneously. Under this assumption, the doctors must make their optimal decisions concerning the trade-offs between the less test cost and lower misclassification cost. Some researchers use a simple strategy to quantify the misclassification cost to be the same as the test cost [4, 6, 19] (for example, use dollar as cost unit). However, the unit scales for different costs are usually various in real-world applications, and it is always difficult for people to quantify these various unit scales of costs into a sole unit [20, 21]. The literature [20, 21] proposed a costsensitive decision tree that considers two different unit scales for costs. However, this method did not treat the tangible cost (such as test cost and waiting cost etc) and intangible cost (such as misclassification cost) as two different resources essentially, instead it divides all the costs into two groups of cost, that is the target cost and the source cost. It often happens that the result of a test is not available immediately. For example, a medical doctor typically sends a blood test to a laboratory and gets the result in the next day. In [6, 10], they regarded the cost of waiting time as waiting cost or delay cost. In this paper, we give our definition of waiting time and combine it with test cost and common cost as tangible cost in our proposed algorithm. There exists missing values during the process of cost-sensitive learning. Sometimes, values are missing due to unknown reasons or errors and omissions when data are recorded and transferred. As many statistical and learning methods cannot
deal with missing values directly, examples with missing values are often deleted. However, deleting cases can result in the loss of a large amount of valuable data. Thus, much previous research has focused on filling or imputing the missing values before learning and testing. However, under cost-sensitive learning, there is no need to impute any missing data and the learning algorithms should make the best use of only known values and that “missing is useful” to minimize the total cost of tests and misclassifications. There is a little research that has paid attention to this, such as, [22]. In this paper, we will talk about the case in which missing values can be encountered both in training sets and test sets. In summary, waiting cost which will be defined in advanced is combined the others costs in order to cost-sensitive learning, a novelty CTS decision tree can be built and a hybrid test strategy will be proposed to test the constructed decision tree with missing values in the dataset. Extensive experiments will show the efficiency of our method.
3 Building CTS Decision Tree We assume that the training data and test data contain some missing values. In our proposed CTS decision tree, these processes will be considered: 1) selecting the splitting attributes. 2) building the CTS decision tree. 3) testing the constructed CTS decision tree. 3.1 Some Definition of Costs Turney [10] has created taxonomy of the different types of cost in inductive concept learning in [3]. According to this taxonomy there are nine major types of costs. In this paper, we will take three of them into account. 3.1.1 Misclassification Cost Misclassification cost: costs incurred by misclassification errors. This type of errors is the most crucial one and most of the cost-sensitive learning research has investigated the ways to manipulate such costs. These error costs can either be constant or conditional depending on the nature of the domain. Conditional misclassification costs may depend on the characteristics of a particular case, on time of classification, on feature values or on classification of other cases. 3.1.2 Test Cost Test cost: costs incurred for obtaining attribute values. The necessity for test cost is proportional to the cost of misclassification. If the cost of misclassification surpasses the costs of tests greatly, then all tests of predictive value should not be taken into consideration. Similar to error costs, test costs can be constant or conditional on various issues such as prior test selection and results, true class of instance, side effects of the test or time of the test.
3.1.3 Waiting Cost It often happens that the result of a test is not available immediately. For example, a doctor typically sends a blood test to a laboratory and gets the result in the next day. A person waiting for the blooding test results will undertake pains, pressures. That is to say, a person must pay some cost for waiting the results of test. In this paper, the waiting cost only reflects the cost of waiting of results after a test is performed. And waiting cost will be confined to the assumption as follows: 1. Waiting cost relates to the waiting time. Different waiting time presents different waiting cost. However, the longer waiting time, the smaller waiting cost maybe. For instance, waiting time for 10 minutes will present more serious effect for the person with heart attack than the one only with catching a cold. The waiting cost of the former will be much more larger than the latter in the same waiting time. 2. Waiting cost varies from person to person, for place to place. For two persons with heart attack, to waiting 10 minutes for the old man is more danger than the twenties, so the waiting cost for the former will higher than the latter. 3. Waiting cost relates the resources of the test. That is to say, a higher income will have a higher waiting cost with the same amount of waiting time [8]. It is obvious that a rich maybe more care the waiting time than the poor in medical test. In this paper, we assume all the waiting cost for each attribute is a constant that will be decided by the specialist in the domain, denoted as WCi , i = 1,..., n , where n is the number of attributes. For satisfied the above three assumptions, each will be multiplied by a coefficient α which is the ratio of a waiting cost to the corresponding assumptions. In particular, WCi = 0 if the result of test can be got at once or means the waiting have little impact for the result of later test. WCi = ∞ , if the next test cannot be performed until the result of the former is presented even if the real waiting time for the result of the test can be got in a finite time, such as several seconds. So the value of WCi is between 0 and ∞ . For ease of calculation, we will regard the scale of waiting cost as the same unit of the test cost. Furthermore, in a batch test, for example, the attributes A1 ,...Ai are tested at the same time, we will get WC = max{WCt } . t = 1,...i
3.1.4 Tangible Cost & Intangible Cost In this paper, we regard Misclassification Cost as Intangible Cost (we refer it to IC) which means the cost exists but cannot be explained with some unit, such as dollar. On the contrary, Tangible Cost (noted as T_C) means the cost exists and can be explained with some unite, such as dollar, time and so on. The value of T_C for attribute i can be defined as follows: T _ Ci = TCi + αWCi , i = 1,..., n , where n is the number of attributes. In particular, in our test strategy shown in section3.3, a numb er of attributes will be test at the same time at the aim to receiving the best system performance. For example, a set of blood tests shares the common cost of collecting blood from the patient. This common cost (referred to CC) is charged only once, when the decision is made to do the first blood test. There is no charge for collecting blood for the second blood test, since we may use the blood that was collected for the first blood test. It is practical for considering common cost during the process of test and it is also helpful to improve
the test accuracy in same test cost. Hence, in batch test, the value of T_C can be calculated as follows: i
T _ C1,..., i = ∑ TCt − CCt + max{αWCt } t =1
(1)
t =1,...i
3.2 Building CTS Tree 3.2.1 Selecting the Attributes for Splitting There exist many kinds of splitting criterion to construct decision trees. Such as, the Gain (in ID3), the Gain Ratio (in C4.5) and minimal total cost. However, the methods (for instance, in ID3 or C4.5) consider the classification ability for the attribute without taking the costs into account. On the contrary, the method with minimal total cost [19] concerns the cost without paying much attention to the classification ability of the attribute. In our view, we hope to obtain optimal results both on the classification ability and on cost under the assumption of the limited resources. So in our strategy, the term ‘Performance’ which is equal to the return (the Gain Ratio multiplied by the total misclassification cost reduction) divided by the inves tment (tangible cost) is employed to meet our demand. That is to say, we select the attribute with larger Gain Ratio, lower test cost and decreas e the misclassification cost. The ‘Performance’ is defined as follows: i (2) Performance(A)=( 2 GainRatio(A,T) -1)*Redu_Mc(A i )/ (TC(Ai )+1) i Where, GainRatio(A i ,T) is the Gain Ratio of attribute A i , TC(A i ) is the test cost of attribute Ai . Redu_Mc(A i ) is the decrease of misclassification cost brought by the attribute A i , and we get: n
Redu_Mc(A i )=Mc-∑ Mc(A i )
(3)
i=0
Where Mc is the misclassification cost before testing the attribute Ai . If an attribute Ai has n branches, then ∑ n M c ( A ) is the total misclassification cost i i =0 after splitting on A i . For example, in a positive node, the Mc = fp * FP, fp is the number of negative examples in the node, FP is the misclassification cost for false positive. On the contrary, for examples, in a negative node, the Mc = fn * FN, where fn is the number of positive examples in the node, FN is the misclassification cost for false negative. We select the attribute with maximal values of Performance(A i ) ( i=1,…,n; n is the number of attributes) as the current splitting attribute during the process of constructing the CTS decision tree. 3.2.2 Building Tree Our algorithm chooses an attribute with maximal Performance based on formula (2) to generate a node. Then, similar to C4.5, our algorithm chooses a locally optimal attribute without backtracking. Thus the resulting tree may not be globally optimal. However, the efficiency of the tree-building algorithm is generally high. Some notes will be presented for constructing as follows:
Firstly, according to the formula (2), we select the attribute with maximal Performance as current splitting attribute to generate a node or a root node. If a number of the attributes’ Performance is equal, the criterion to select test attribute should follow in priority order: 1) the bigger Redu_Mc; 2) the bigger test cost. This is because that our goal is to minimize the misclassification cost. Secondly, there are missing values in the training set while building the CTS decision tree. Zhang et al. [22] experimentally demonstrated all kinds of methods for dealing with missing values for constructing cost-sensitive decision tree, and made a conclusion that the best method would be the internal node strategy in [19] in which the missing values will be handled by internal nodes without being imputed. Hence, we will employ the internal nodes method to dealing with missing values in the training examples in our cost-time sensitive decision tree. Another important point is how to stop building tree. In the process of classify a case using a decision tree, the layer that will be visited may be different if the resources provided is different. The more resources a case has, the more layers it will be visited. For allowing a decision tree that can fit for all kinds of needs, the condition of stopping building tree is similar to the C4.5. That is to say, when one of the following two conditions is satisfied, the process of building tree will be stopped. (a) all the cases in one node are positive or negative; (b) all the attributes are used up. The next problem is how to label a node when it has both positive and negative examples. In traditional decision tree algorithms, the majority class is used to label the leaf node. In our case, as the decision tree is used to make predictions to minimize the misclassification cost or intangible cost under given resources. That is, at each leaf, the algorithm labels the leaf as either positive or negative (in a binary decision case) by minimizing the misclassification cost or intangible cost. Suppose that there is a node, P denotes that the node is positive and N denotes that the node is negative. The criterion is as follows: P if p*FN > n*FP N if p*FN < n*FP Where, p is the number of the positive case in the node, while n is the number of negative cases. FN is the cost of false negative, and FP is the cost of false positive. If a node including positive cases and negative cases, we must pay the cost of misclassification no matter what we conclude. But the two costs are different, so we will choice the smaller one. Here we consider that the cost of the right judgment is 0. For example, there is a node including 20 positive cases and 24 negative cases, and if the cost of the false positive and false negative is the same, the node will be considered negative. But in our view, they are different, such as FN is 800 and FP is 600, the node will be considered positive because 16000 is larger than 14400. In reality, considering the situation that a patient (positive) is classified as health (false negative), the result may be that he will lose of his life. On the contrary (false positive), he may only need to pay the cost of medic ine fee, etc. So the cost is different. And in general, we think that the cost of false negative (FN) is larger than the cost of false positive (FP).
Finally, the attribute at the top or root of the tree is likely the attribute which is with zero (or small) tangible cost, more decrease of the intangible cost and strongly classification ability without missing values base on the principle of our constructing cost-time sensitive decision tree. 3.3 Performing Tests on Test Examples After the decision tree is built and all the nodes are labeled, the next interesting question is how this tree can be used to deal with test examples and pay the minimal misclassification cost or intangible cost confined to any tangible costs. There exist many kinds of test strategies in a number of literatures in [4-7, 19]. We can classify all these test strategies into three catalogues: sequential test strategies, batch test strategies and the hybrid test strategies combined the sequential method with the batch one. In our CTS decision tree, it isn’t practical for either the single sequential strategies or the batch strategies to be employed after considering waiting cost and the test examples with different resources. For example, a test example with enough test resources would not care about the test cost but consider the waiting time. In a medical test, the rich maybe test all the attributes under the unknown attribute (or node) which will be got the result costing more waiting time. This changes the sequential strategies to batch one. On the contrary, facing a number of attributes to be tested, the poor maybe only select one attribute to test due to the limited resources. Hence, in this paper, we will propose a hybrid method in which either sequential strategy or batch strategy will be chosen by some principles. The hybrid strategy is constructed as follows: At first, calculating the utility for each attribute based on the below definition:
Utility =
IC T _C
(4)
Secondly, computing the utility for some batch attributes which will satisfy some rules below: 1) This batch attributes will be recommended by the specialist in these domains. These attributes will be combined mainly by some common cost. 2) All the T_C of these attributes won’t exceed the resource for this test example. Different from the principle in [6] in which more attributes would be added into the batch until ROI does not increase, the time complexity of our method for computing utility is only linear because the batch is limited due to introduction by the specialist. And the number of the combination will be 2 n in the method in [6]. It is feasible for the specialists to decide the batch attributes as the researchers in this domains acquaint all the tests which can be grouped better than the single test. This can decrease the tangible costs as well as the time complexity of our algorithm. On the other hand, the limited resources for the test examples will be considered different from existing methods in which the limited resources have not been taken into account, such as, in [4-7, 19]. Thirdly, the attribute(s) with the maximal utility for the result coming from the former two processes will be tested firstly. And the test strategy will be regarded as the sequential strategy while the attribute tested firstly is a single one. Otherwise, it is
a batch strategy. So we call our method as a hybrid strategy as there exists both sequential method and batch strategy in our method. This process for testing will be continued until all tests are completed or the resources of the test example are used up.
4 Experimental Analyses In this section, we empirically evaluate our algorithm with real-world datasets in order to show its effectiveness. We choose two real-world datasets, listed in Table 1, from the UCI machine learning repository [23]. Each dataset is split into two parts: the training set (60%) and the test set (40%). These datasets are chosen because they have some discrete attributes, popular in use and have a reasonable number of examples. The numerical attributes in datasets are discretized at first using a minimal entropy method [24]. Because there is no missing values in these four datasets , we artificially apply MCAR mechanism on these datasets under different missing rates. And the missing values in the conditional attributes are under missing rates of 10%, 20%, 30%, 40%, 50% and 60%, respectively. To assign Test Cost, we randomly select a cost value that satisfied the constraint of falling into [1, 100] for each attribute. The costs for test are generated at the beginning of each imputation. The misclassification cost is set to 600/800(600 for false positive and 800 for false negative). Note that here the misclassification cost is only a relative value. It has different scales with test costs. Table 1. Datasets used in Experiments Instances
Attributes
Classes(N/P)
Tic-tac-toe
958
9
332/626
Mushroom
8124
21
4208/3916
For comparison, in section 4.1, we construct three CTS decision trees with different splitting criterion to demonstrate the efficiency of our splitting criteria without concerning about the waiting cost (i.e., the value of waiting cost for each attribute in each dataset is equal and constant). One CTS decision tree with the splitting criteria of gain ration is denoted as GR, the method with the minimal total cost is referred to as MTC and our method is regarded as PM. The experimental results of the effect for waiting cost will be presented in section 4.2.
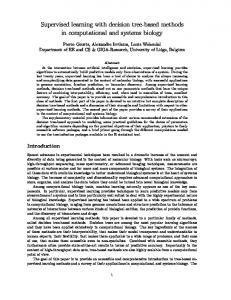
4.1 Experiments for algorithm’s efficiency In this section, we evaluate the performances of different algorithms on datasets under different levels of missing rates. For each experiment, we do not consider the resources of test example , i.e., each test example has enough test cost to be tested. The test cost is 900 and 2100, respectively for dataset Tic-tac-toe and Mushroom. Figures 1 and 2 provide detailed results from these two datasets, where the x-axis represents the missing rate and the y-axis is the Misclassification Cost.
700
Misclassification Cost
Misclassification Cost
600
GR MTC PM
800
600 500 400 300 200
GR MTC PM
550 500 450 400 350 300
0.1
0.2
0.3
0.4
0.5
0.1
0.6
0.2
0.3
0.4
0.5
0.6
Missing Rate
Missing Rate
(1)
(2)
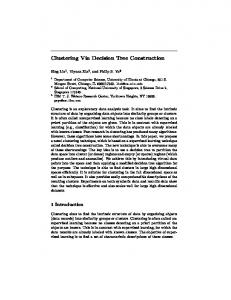
Figure 1 The misclassification cost VS the missing rate From Figures 1, we can see that with the increase of the missing rate, all methods suffer from the increase of misclassification cost, because more missing values have been introduced and the model generated from the data has been corrupted. When comparing with the different algorithms, we find that PM is the best among these methods in terms of misclassification cost at different missing rate. The experimental results demonstrate that the method with Formula (2) for spitting attributes is best than the naive methods, such as maximal grain ratio method or the minimal total cost method under the assumption of without limited resources. In the above paragraph, we did not fix the test costs and we assumed each attribute will be tested with the enough test resources. However, in real applications, there exists a limited resources, such test cost. In this subsection, we will use all kinds of test cost levels to test the efficiency of our method comparing with the other two methods. The experimental results of dataset Tic-tac-toe are shown in Figure 3 and 4, for missing rate 20% and 40% respectively. The domain of test cost is between 100 and 600 in Figure 3 and 4, the results of MC is presented in y-axis. The results show that our PM algorithm performs better than the other two algorithms in the terms of limited test costs. 700 GR MTC PM
600 550
Misclassification Cost
Misclassification Cost
650
500 450 400 350 300
680
GR MTC PM
660 640 620 600 580 560
100
200
300
400
500
600
100
200
300
400
Test Cost
Test ost
(1)
(2)
500
600
Figure 2. The misclassification cost VS the test cost From Fig. 1 to 2, we can make a conclusion that the splitting criterion of PM algorithm is best than the maximal grain ratio and minimal total cost method with all kinds of resources, such as test cost.
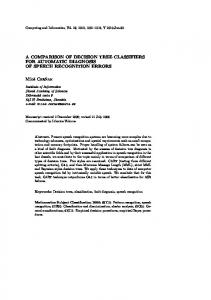
4.2 Experiments for Waiting Cost In section 3, we analyze it is practical for talking about waiting cost into the CTS learning. In this section, we will experimental test this method. In order to investigate the effect of various waiting costs, we set up three levels for waiting costs: (a) all waiting costs are 0 (denoted as Max0 in Figure 3); (b) all delay costs are randomly assigned from 0 to 50; and (c) all delay costs are randomly assigned from 0 to 100. We also design some common cost in our experiments. In our opinion, the higher waiting cost, the less test cost is. This is because there are more common costs which can efficient decrease the test cost for the test examples. From Figure 3, we can see this meets our expectations. 560 540
MAX0 MAX50 MAX100
1500 1450
520
Test Cost
Test Cost
1550
MAX0 MAX50 MAX100
500 480
1400 1350 1300 1250
460
1200 0.1
0.2
0.3
0.4
0.5
0.6
0.1
0.2
0.3
0.4
Missing Rate
Missing Rate
(1)
(2)
0.5
0.6
Figure 3. The test cost VS the missing rate
5 Conclusions In this paper, we introduce waiting cost into cost-sensitive learning with misclassification cost and test cost to construct CTS decision tree with a new splitting criterion. Then a hybrid test strategy is proposed to test the constructed CTS decision tree with missing values and limited resources. Extensive experiments show our method outperforms the existed methods and it is feasible for talking about waiting cost in CTS learning. In the future, we will further demonstrate the advantages of CTS decision tree.
References 1. 2. 3.
Quinlan, J. R. (1993) C4.5: Programs for Machine Learning. Morgan Kaufmann Publishers. Mitchell, T.M. (1997) Machine Learning McGraw Hill. Turney, P.D. (2000), Types of cost in inductive concept learning, Workshop on CostSensitive Learning at the Seventeenth International Conference on Machine Learning, Stanford University, California.
4. 5. 6. 7. 8. 9.
10.
11. 12. 13. 14. 15.
C.X. Ling, S. Sheng, Q. Yang. Test Strategies for Cost-Sensitive Decision Trees. (TKDE), Volume 18, Number 8, pp. 1055-1067, 2006 Q. Yang., C.X. Ling, X. Chai, and R. Pan. Test-Cost Sensitive Classification on Data with Missing Values. (TKDE), Volume 18, Number 5, 2006. Pages: 626 - 638. V.S. Sheng and C.X. Ling. Feature Value Acquisition in Testing: A Sequential Batch Test Algorithm. (ICML'2006), Pages 809-816, 2006. V.S. Sheng, C.X. Ling, A. Ni, and S. Zhang. Cost-Sensitive Test Strategies. Proceedings of the Twenty-first National Conference on Artificial Intelligence (AAAI-06), 2006. M.A. Koopmanschap, et al. (2005).Influence of waiting time on cost-effectiveness, Social Science & Medicine 60 (2005) 2501–2504 David A. Cromwell, (2004),Waiting time information services: An evaluation of how well clearance time statistics can forecast a patient’s wait, Social Science & Medicine 59 (2004) 1937–1948. Turney, P.D. (1995) Cost-Sensitive Classification: Empirical Evaluation of a Hybrid Genetic Decision Tree Induction Algorithm, Journal of Artificial Intelligence Research 2, pp. 369-409, 1995. Qin, Y.S., et al. (2007). Semi-parametric Optimization for Missing Data Imputation, Applied Intelligence, 2007,. Zhang, C.Q. et al. (2007). Efficient Imputation Method for Missing Values. PAKDD, 2007: LNAI 4426, pp. 1080–1087, 2007. V. B. Zubek Learning Cost-Sensitive Diagnostic Policies from Data, A Ph.D Dissertation submitted to Oregon State University, 2003. S. M. Weiss, R. S. Galen, and P. V. Tadepalli, Maximizing the predictive value production rules, Artificial Intelligence, Vol 45(1-2):47-71, 1990. Nunez, M. (1991), The use of background knowledge in decision tree induction, Machine
Learning, 6, pp. 231-250. 16. Tan, M. (1993). Cost-sensitive learning of classification knowledge and its applications in robotics. Machine. Learning Journal, 13, 7--33. 17. Domingos, P. (1999) MetaCost: A General Method for Making Classifiers Cost-Sensitive. In Knowledge Discovery and Data Mining, Pages 155-164. 18. Greiner, R, Grove A. and Roth D. (2002) Learning Cost-Sensitive Active Classifiers, Artificial Intelligence Journal 139:2, pp. 137-174. 19. Charles Ling, et al. (2004), Decision Trees with Minimal Costs. In: Proceedings of 21st International Conference on Machine Learning, Banff, Alberta, Canada, July 4-8, 2004. 20. Z. Qin, C. Zhang and S. Zhang, Cost-sensitive Decision Trees with Mult iple Cost Scales. In: Proceedings of the 17th Australian Joint Conference on Artificial Intelligence (AI 2004), Cairns, Queensland, Australia, 6-10 December, 2004. 21. Ni, A.L.,Zhu, X.F. and Zhang, C.Q,.(2005)Any -Cost Discovery: Learning Optimal Classification Rules, Australia AI 2005: 123-132. 22. Shichao Zhang, Zhenxing Qin, Charles Ling and Shengli Sheng, "Missing is Useful": Missing Values in Cost-sensitive Decision Trees. IEEE Transactions on Knowledge and Data Engineering, Vol. 17 No. 12 (2005): 1689-1693. 23. Blake, C.L., & Merz, C.J. (1998). UCI Repository of machine learning databases [http://www.ics.uci.edu/~mlearn/MLRepository.html]. 24. Fayyad, U. M., & Irani, K. B. (1993). Multi-interval discretization of continuous-valued attributes for classification learning. In Proceedings of the 13th International Joint Conference on Artificial Intelligence, pages 1022--1027. Morgan Kaufmann.