Journal of Medical Sciences Vol. 1(1), pp. 12-24 Dec. 2012 Available online at http://www.wynoacademicjournals.org/med_sciences.html ISSN 2320-1282 ©2012 Wynoacademic Journals
DEVELOPING LINEAR MULTIPLE REGRESSION MODEL OF INDIAN MALES AND VALIDATING THE RESULTS WITH BIA ANALYSER 1
Ghazala et al, Ph.D. research scholar Jamia, Millia Islamia, New Delhi. Email:
[email protected]
Acceptance Date: Nov. 17, 12
Background: The Bioelectrical Impedance analysis has been used extensively in assessing Total Body Water and Fat Free Mass of various groups of people. It has many advantages over other methods and safe, rapid, portable, easy to perform and require minimum operator training. Regression equations play great role to estimate the body density and fatness specific to the owing to methodological and biological factors. Purpose: Research has been done to study the body composition of different ethnic groups, different age groups, different sex, and different level of physical activeness. Earlier scientists have measured various parameters of body composition of Indian population using MALTRON-II. However, literature shows that prediction equations have not been developed for Indian population. In the present research paper, an attempt has been made to develop BIA equations for 44 Indian male subjects; data reference PhD thesis (1). Keywords: R(2.9.2) Software, Bio Electrical Impedance Analysis, Prediction Equation, MALTRON-II, Multiple Regression Analysis, Total Body Water, Fat Free Mass, Impedance Index. Method: Data of reference (1) included vital information about body composition such as age, TBW, FFM, height, weight, impedance and phase at 5k, 50k, and 100k. This data was then used to calculate the impedance index i.e. (height2/impedance) at 5 KHz, and 50KHz. since BIA is used for the assessment of body fluid status. The relationship between densitometrically determined fat free mass (FFM) with body impedance ®, body weight (W) and body height (H) was analysed, taking age and sex into account. BIA measures of resistance and impedance are proportional to body water volume, if body electrolyte status is normal and to the length of conductor or stature (eg. Stature2/resistance). This method uses regression analysis to drive prediction equation of Indian population, wherein the main aim is to predict one variable, which is called dependent variable from 1 or more independent variable also called as predictor variable. Data was fed into R software, which is an integrated suite of software facilities used for data manipulation, calculation and graphical display. It is used for effective data handling and storage facility. The main use of R software is for regression analysis, which was then used to generate the prediction equation. The prediction equation developed here is through multiple regression analysis. In multiple regression analysis the equation is of the form given below; Y=m1x1+ m2x2+ m3x3+...........+mnxn+ c; where c is intercept and mj’s are the weight’s assigned to each of the predictor variables by the regression solution. Calculation is quite complex and best performed with the help of Statistical software. For our paper, we have made use of R (2.9.2) software. Result: Data used in commercial software provided 4 BIA equations for TBW and FFM at frequencies of 5
KHz and 50 KHz. This data included other statistical data such as mean, standard deviation and correlation of Total Body Water (TBW) and Fat Free Mass (FFM) with Impedance index and Weight. Besides this scatter matrix plot for Total Body Water(TBW) and Fat Free Mass (FFM) at 5KHz, 50KHz. Normal distribution of standardised residuals showing the relationship between TBW and FFM at 5KHz, 50KHz. with Impedance index and weight, Scale location plot, Residual verses leverage plot, standardised residual verses cook’s distance plot are plotted. These plots for linear model objects, gives the diagnostic information about the linear model. Conclusions: The final race-combined TBW prediction equations included stature2/resistance and body weight. Multiple regression analysis was carried out on clinical data through R 2.9 software. The BIA prediction equation for Total Body Water and Fat Free Mass was developed at different frequencies of 5 KHz. and 50 KHz respectively. The data was taken for Indian males lying in a limited age span of 17-22 years.
INTRODUCTION The term Body Composition illustrates the different components that, when taken together, makes up a person’s body weight. Maintaining a healthy body composition is a key to healthier and longer life. For analysis of body composition, it is often suitable to think of the body as made of two components: fat and non-fat. The non-fat portion is called “Fat Free Mass” or “Lean Body Mass”. However, body can be taken into different compartment models for body composition assessments. Only body composition
13 Med. Sci analysis can determine how much muscle and fat are lost or gained as the result of any nutrition, exercise, or pharmaceutical prescription. By measuring body composition, a person’s health status can be accurately assessed and the effects of both dietary and physical activity program are better directed. Therefore, accurate analysis of body composition is necessary to determine the status of health of any individual. Imbalance body fat is a cause of many diseases. Excess of fat in human body is directly correlated with the nutritional disorder in human body called as obesity and depletion of fat from the normal level is associated with malnutrition and anaeroxia nervosa. Both Anorexia nervosa and obesity is a nutritional disorder and there are many health risks associated with obesity and malnutrition. Obesity is a cause of much coronary heart disease, and other heart related diseases, hypertension and type 2 diseases, gallstones in gallbladder, osteoarthritis, breathing pain, menstrual irregularities and infertility in women, prosteoarthritis in men. Malnutrition and anorexia nervosa is associated with anaemia, goitre, diahorrea, anxiety, scaling and cracking of lips and mouths, regular fainting, premature aging of skin and body weakness. Body composition analysis is thus necessary to determine level of body fat and hydration level of subjects. In India when it comes to general health of people, there is a large disparity between urban elite class and rural class. According to the survey of 2007, nearly 4050 million people are obese which accounts for nearly 15.2% of total population. According to another survey carried out 213 million people are undernourished or malnourished. Therefore, India is facing serious problem regarding the nutritional status of the people. Attention must be given to determine the body composition of people so that appropriate measures can be taken if people are facing abnormality in their health due to their abnormal nutritional status. Hydrodensitometry, Air Displacement Plethysmography, Hydrometry, Skin Folds Analysis, Near Infrared Interactance Method, Dual Energy X-ray Absorbtiometry are the few methods through which we determine the various elements of body composition. Besides this Computer, Axial Tomography and Magnetic Resonance Imaging are also used for the body composition analysis. Though these methods are very accurate, yet the main disadvantage of these methods is that these methods are quite expensive and labour intensive. In addition, CT exposes the subject to radiations. It is used in large-scale status of body composition and assessment of body fluid status. Its main limitation is that its accuracy is dependent on the selection of appropriate prediction equation, which should be as specific as possible to the study of groups in terms of age, sex, ethnicity, level of fatness, and health status. Although some of the published equation for Asian, population can be applied to Indian Population.
Yet a specific prediction equation needs to be developed for Indian population. This study aims at developing the prediction equation for Indian population. SUBJECTS AND METHOD: Data of 44 Indian males from reference (1) was taken to develop the prediction equation. The descriptive analysis of Indian population including age, weight, height, Total Body Water(TBW), Fat Free Mass (FFM), Impedance at 5k, 50k frequency, and Phase angle at the same frequency was shown in table(1). This data was then used to calculate the body strature i.e. (height2/impedance).This data is shown in table (2). Then the algorithm to predict TBW, FFM of Indian population using R (2.9.2) software was developed. Then a generalized equation showing the relationship between Total Body Water (TBW), Impedance Index and weight was developed. Similar procedure was adapted to develop the prediction equation of subject showing the relationship between Fat Free Mass (FFM), Impedance index and Weight of the subjects taken from reference(1). LITERATURE SURVEY: Many scientists have been contributing in the past to the development of body composition prediction equations for cohorts of individual belonging to different ethnic groups, age groups, sex and according to their level of physical activity. Martin Wabitch et.al in 1996 developed an equation for the prediction of total body water (TBW) from bioelectrical impedance analysis (BIA) in obese children and adolescents before and after weight reduction using multiple-regression analysis. Jordan R Moon et.al in 2007 has used a 3C model approach to estimate percentage body fat estimations in college women, where they have estimated their BF by field or laboratory method and compared it with Siri 3 C model. Ellis, Kenneth J in 2009 used a 4C reference model on white, black and hispanic ethnic groups and compared with the classic models of Fomon, Ziegler, and Haschke to examine differences in body fat, protein and mineral mass. Mary Horlick et.al in 2002 used bioelectrical impedance analysis models for prediction of total body water and fat-free mass in healthy and HIV-infected children and adolescents. This study confirms that BIA prediction models may not be appropriate for individual evaluation but are suitable for population studies. Terry T, et.al in 2002 studied white, African and American children and developed prediction equation for them, which was published in American Diabetic Association. Lilian et.al in 2008, developed BIA prediction for severely obese patients. Terry L.Dupler, et. al in 2000, developed body composition prediction equation for elderly men. When, it comes to literature on developing human body composition prediction equation, there is huge matter and research that has been done until date on various cohorts of individuals. This research paper is our first step in developing BIA equation of Indian males and validating the results with those obtained through BIA instrument. Here we have taken that step.
14 Med. Sci.
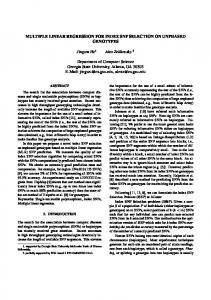
Flowchart depicting the procedure carried out in developing BIA prediction equation:
START
N=44,Wt.Ht.Z are weight,height and impedances of subjects at f1=5KHz.;f2=50KHz.
(Zif1,f2,=(Ht.2/Z))k=1……N K=K+1 No
Is K=N Yes TBWf1,f2,~(lm(Zif1,f2 +Wt.) FFMf1,f2~(lm(Zif1,f2 +Wt.)
TBWf1,f2 = (a0×Zif1,f2 + a1×Wt.+c1) FFMf1,f2,f3,f4= (b0×Zif1, f2,f3,f4 + b1×Wt.+c2)
STOP
Fig1: Flowchart showing the general process to develop linear model at different frequencies.
15 Med. Sci. STATISTICAL METHOD: The data included 44 Indian male subjects, whose clinical information such as weight, height, sex, Total Body Water(TBW), Fat Free Mass(FFM) were taken from reference(1).The need to develop generalised prediction equation arises to estimate the body composition of individuals varying in age, sex, ethnicity, fatness or physical level of activity. Kim et al. in 1994 developed the BIA prediction equation for 84 Japanese boys in the age span of 9-14 years. Nayeli Macius et al. in 2007 developed and cross validated the BIA prediction for 155 Mexican subjects. Besides this several other scientist such as Deurenberg in 1991, Kushner in 1992 have already been contributing in developing the BIA prediction equation either for different ethnicities or for people of particular age group and they have been using multiple regression technique to do so. Now, multiple regression technique is in itself a very complex procedure, particularly when the number of independent or predictor variable are large. Scientists have been using different soft wares in the past to develop and predict the BIA prediction equation. Usually S.P.S.S. software, S.A.S. software has been used for this purpose. In the present paper R, (2.9.2) software is being used for the regression analysis. This software is helpful in developing the linear mathematical model of human body composition of samples taken from reference (1). The main advantage of this software is that it gives the scientific meaningful model. Besides this, it is easy to operate and is helpful in giving us the various graphical plots of the clinical data of the samples taken from reference (1). Table below shows the descriptive statistics of Indian males. Table1: Descriptive statistics of Indian Subjects (n=44)
Variables
Mean ± S.D.
TBW FFM Weight Sex Zi at 5 KHz Zi at 50 KHz
35.42864 50.83568 61.44318 44 males 39.33305 45.35905
± 4.782066 ± 8.145936 ± 12.676299 ± 6.840573 ± 7.945996
PREDICTION EQUATION DEVELOPED: The obtained equations are of the form: TBW (f 1, f2) = a0×Zi (f 1, f2) + a1×Wt.+ c1 ….(1) FFM (f 1, f2) = b0×Zi (f 1, f 2) + b1×Wt.+ c2 ….(2) Where TBW (f1,f2) and FFM(f1,f2) is Total Body Water and Fat Free Mass at frequencies f 1=5KHz.,f2=50KHz., ZI(f1,f2,) is the calculated Impedance index i.e. (height2/impedance) of the subjects at these frequencies, c1 and c2 are intercepts of equation (1) and (2) respectively, a0, b0 are coefficients multiplied by Impedance index(ZI )variable; a1, b1 are coefficients multiplied by variable dry weight (Wt.) of the subjects measured in Kg. Results: The study was able to develop BIA prediction equation for Indian males. The prediction equations developed for Total Body Water at 5 KHz, 50 KHz are as shown below: TBW BIA= (0.36643)×ZI5k + (0.19441)×Body weight + 9.0683 ………………(1) TBW BIA= (0.327711)×ZI50k + (0.189686)×Body weight + 8.906831 ………………(2) In a similar pattern the prediction equation for FFM was developed at frequency of 5KHz and 50 KHz, The developed equations are shown below: FFMBIA= (0.70670)×ZI5k + (0.26569)×Body weight + 6.71417 ………………(3) FFMBIA= (0.63790)×ZI50k + (0.25355)×Body weight + 6.32183 ………………(4)
16 Med. Sci.
Table 2: Descriptive statistics of Indian males (n= 44) together with BIA equations developed. 2
2
No.
Prediction equation developed.
Frequency used
Standard Error
Residual Error
Multiple R
Adjusted R
1.
TBW=0.36643×Zi+ 0.19441×Wt.+ 9.0683
5KHz
Intercept = 1.49764 Zi = 0.06696 Wt. = 0.03614
1.683 on 41 df
0.8854
0.8799
2.
TBW = 0.327711×Zi + 0.189686×Wt.+ 8.906831
50 KHz
Intercept = 0.242953 Zi=0.009174 Wt.=0.005711
0.2747 0n 41 df
0.9969
0.9967
3.
FFM = 0.7067×Zi + 0.26569×Wt.+ 6.71417
5 KHz
Intercept = 1.96956 Zi=0.08806 Wt.=0.04752
2.213 on 41 df
0.9296
0.9262
4.
FFM = 0.6379×Zi + 0.25355×Wt.+ 6.32183
50 KHz
Intercept = 1.71937 Zi = 0.06524 Wt. = 0.04089
1.944 on 41 df
0.9457
0.9231
17 Med. Sci.
Table 3: Comparative study of measured and predicted value of TBW and FFM at different frequencies, for Indian males. No.
1. 2. 3. 4. 5. 6. 7. 8. 9. 10.
TBW predicted 5KHz. 37.73 37.015 29.99 30.123 32.658 42.16 30.697 29.279 30.571 31.915
at
TBW predicted 50KHz 38.238 37.081 29.419 30.021 32.666 41.852 30.87 29.856 30.587 41.217
at
TBW measured
FFM predicted 5KHz
38.42 37.18 29.2 29.94 32.62 41.72 30.81 29.81 30.72 41.71
54.902 53.394 42.161 42.116 45.092 61.523 42.931 40.739 42.484 58.369
at
FFM predicted 50 KHz 55.896 53.528 41.044 41.108 46.438 60.921 43.29 41.895 42.502 60.77
at
FFM measured
56.32 55.14 38.75 41.41 46.7 60.21 42.81 38.92 48.02 42.71
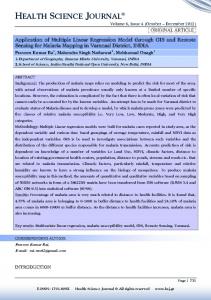
Fig.2: Scatter Plot Matrix distribution of body composition of Indian males; showing the relationship between Total Body Water(TBW) in litres, Impedance Index (Height2/Impedance) of body at frequencies of 5KHz, 50KHz and weight of body in Kg.
18 Med. Sci.
Fig.2: Scatter Plot Matrix distribution of body composition of Indian males; showing the relationship between Total 2 Body Water(TBW) in litres, Impedance Index (Height /Impedance) of body at frequencies of 5KHz, 50KHz and weight of body in Kg.
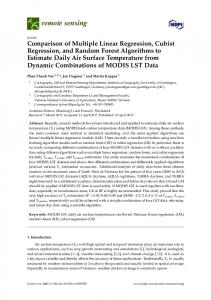
Fig3: Random scatter distribution of residual versus fitted values of Indian males showing the relationship between Total Body Water (TBW) in litres, Impedance Index (Height2/Impedance) of body at 5KHz, 50KHz, frequency in (cm2/Ω) and Weight of body in Kg.
19 Med. Sci.
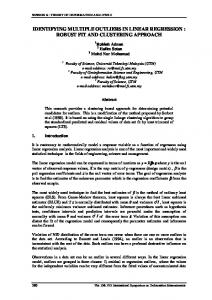
Fig.4: Normal distribution versus Standardized residuals of Indian subjects showing the relationship between Total 2 2 Body Water (TBW) in liters, Impedance Index (Height /Impedance) of body at frequencies of 5KHz,50KHz,.in (cm /Ω) and Weight of body(Kg),
Fig5: Scale location plot between the square root of standardized residuals versus fitted values of Indian males showing the relationship between Total Body Water (TBW) in litres, Impedance Index (Height2/Impedance) of body at frequencies of 5 KHz, 50 KHz in (cm2/Ω) and Weight of body (Kg)
20 Med. Sci.
Fig6: Residual versus leverage plot and standardized residuals verses cook’s distance plot of Indian males showing 2 the relationship between Total Body Water (TBW) in litres, Impedance Index (Height /Impedance) of body at 2 frequencies of 5KHz, 50 KHz, in (cm /Ω) and Weight of body(Kg),
Fig.7: Scatter Plot Matrix distribution of body composition of Indian males; showing the relationship between Fat Free Mass (FFM) in (Kg), Impedance Index (Height2/Impedance) of body at frequencies of 5KHz, 50KHz, in (cm2/Ω) and Weight of body in Kg,
21 Med. Sci.
Fig8: Random scatter distribution of residual versus fitted values of Indian males showing the relationship between 2 2 Fat Free Mass (FFM) in Kg, Impedance Index (Height /Impedance) of body at 5KHz, 50KHz frequency in (cm /Ω) and Weight of body in Kg
Fig.9: Normal distribution versus Standardized residuals of Indian males showing the relationship between Fat Free Mass (FFM) in Kg, Impedance Index (Height2/Impedance) of body at frequencies of 5KHz, 50KHz. in (cm2/Ω) and Weight of body in Kg,
22 Med. Sci.
Fig10: Scale location plot between the square root of standardized residuals versus fitted values of Indian males 2 showing the relationship between Fat Free Mass (FFM) in Kg, Impedance Index (Height /Impedance) of body at 2 frequencies of 5KHz, 50KHz in (cm /Ω) and Weight of body (Kg).
Fig11: Residual versus leverage plot and standardized residuals verses cook’s distance plot of Indian males showing the relationship between Fat Free Mass (FFM) in Kg, Impedance Index (Height 2/Impedance) of body at frequencies of 5KHz, 50KHz in (cm2/Ω) and Weight of body(Kg),
23 Med. Sci.
RESULTS AND DISCUSSION The study was carried out on a limited number of Indian subjects, 44 in number. However the method used for statistical analysis provided a good opportunity to develop the more precise and accurate equation for large number of Indian subjects. Further, a gender-based equation can also be developed for Indian population. However, collection of clinical data is in itself a complicated job. Multiple Regression Analysis is used here to develop the BIA prediction equation. Multiple regression analysis was carried out on clinical data through R 2.9 software. The BIA prediction equation for Total Body Water and Fat Free Mass was developed at different frequencies of 5 KHz and 50 KHz. respectively. The prediction equations developed for Total Body Water at 5 KHz. and 50 KHz. were as shown below: TBW BIA= (0.36643)×ZI5k + (0.19441)×Body weight + 9.0683 ……………… (1) TBW BIA= (0.327711)×ZI50k + (0.189686)×Body weight + 8.906831 ………………(2) Where TBW BIA is Total body water in litres, ZI5kis Impedance index of body at 5KHz frequency in (cm2/Ω). Frequency, ZI50kis Impedance index of body at 50KHz frequency in (cm2/Ω), Body weight is the weight of the body in Kg. The prediction equations developed for Fat Free Mass at 5 KHz. and 50 KHz. were as shown below: FFMBIA= (0.70670)×ZI5k + (0.26569)×Body weight + 6.71417 ……………… (3) FFMBIA= (0.63790)×ZI50k + (0.25355)×Body weight + 6.32183 ……………… (4) Where FFMBIA is Fat Free Mass of body in Kg., ZI5k is Impedance index of body at 5KHz. frequency in (cm2/Ω). Frequency, ZI50kis Impedance index of body at 50KHz. frequency in (cm2/Ω), Body weight is the weight of the body in Kg. The other statistical analysis such as Standard Error of Estimate (S.E.E.) for Intercept, Impedance index at 5KHz and 50 KHz, Residual Standard Error (R.S.E.), Multiple R squared, F statistics for different equation, p- value, t value, mean, standard deviation of predictor variable i.e. Impedance index and weight and dependent variable i.e. TBW and FFM at 5 KHz. and 50 KHz. and correlation of body composition elements with each other are already given where algorithm to develop BIA prediction equation for TBW and FFM is given at different frequencies of 5 KHz. and 50 KHz. Besides this Table 3 gives the value of TBW and FFM obtained through instrument and by the equation developed at different frequencies of 5 KHz. and 50 KHz. CONCLUSION AND FUTURE SCOPE OF WORK: The study was able to develop BIA prediction equation for Indian males. For developing the BIA prediction equation for TBW and FFM at 5KHz. and 50 KHz, we have included Impedance index (height2/Impedance) and weight of the body of cohorts of sample from reference (1).Sex of the individual was not included because here the data taken is only of cohorts of male. The prediction equation developed in the present paper is the first BIA prediction equation for TBW and FFM for Indian subjects. Table 3 gives the comparison of the value of TBW and FFM obtained through MALTRON-II instrument and the one obtained through multiple regression analysis at 5 KHz. and KHz. It is observed that the equation gives correct value and there is very small error while obtaining these values of body composition of Indian subjects. However, external validation still needs to be done for further accuracy of the equation. Besides this, the limitation of the present work is that our prediction equation was developed for a very limited number of subjects. Further, the data was carried out for Indian males lying in a limited age span of 17-22 years. So, the prediction equation developed for Indian population can be made more accurate and generalised if large no. of clinical data are collected and the results can be more generalized if the data collected are not gender specific. The prediction equation for Total Body Water and Fat Free Mass will be more generalised if it includes Sex of the subject as the independent variable.
Corresponding Author: Ghazala Perveen Khan,
[email protected],
[email protected],
[email protected]
24 Med. Sci. REFERENCES 1. Carlo B, Luigi V, Biagio D I,Vincenzo B, Domenico C, Carlo L, Anna R, and Nicola D’A2007. Development and Validation of Bioimpedance Analysis Prediction Equations for Dry Weight in Haemodialysis Patients. Clin J Am Soc Nephrol 2: pp:675-680 2. Cameron B R and Robert T D 2007 Regional body composition in college-aged Caucasians from anthropometric measures, Nutrition & Metabolism, doi:10.1186/1743-7075,pp:4-29 3. [Deurenberg P, Deurenberg-YM, Foo LF, Schmidt G and Wang J.2003. Differences in body composition between Singapore Chinese, Beijing Chinese and Dutch children. European Journal of Clinical Nutrition. 4. Deurenberg P, Van dKK, Leenen R, Weststrate JA, Seidell JC.1991, Sex and age specific prediction formulas for estimating body composition from bioelectrical impedence: a cross-validation study. Int J Obes ;15:17-25 5. Goswami PN. Thesis under the supervision of Dr. Munna Khan; 2008, Prediction and measurement of Human Body composition using Non-Invasive technique. 6. Jean CD, Pierre MP, Corinne BD, Pierre C, Bernard B, Christine B, and Philippe P, Couratier. 2003. 1-3 Validation of bioelectrical impedance analysis in patients with amyotrophic lateral sclerosis . The American Journal of Clinical Nutrition. 7. Jordan R M, Holly R H, Sarah E T, Masaru T, Murat K, Michael D R, Eric D R, Kim S J, Dalbo VJ, Ashley A W, Abbie T S, Joel T C and Jeffrey R S. 2007. Percent body fat estimations in college women using field and laboratory methods: a three-compartment model approach. Journal of the International Society of Sports Nutrition ,doi:10.1186/1550-2783, pp:4-16 8. Kushner RF, Schoeller DA.1986. Estimation of body water by bioelectrical impedence analysis. Am J Clin Nutr ;44:417-24 9. Noe¨l C, Paula L G, Melanie M W, Charlotte B, Nicola C D, John M P, and Shane A N.2004. Regression equations to estimate percentage body fat in African pre-pubertal children aged 9. Am J Clin Nutr, Vol. 80, No. 1, pp: 70-75. 10. Nyboer J.1981. Percent body fat by four terminal bioelectrical impedance and body density in college freshmen. Proceedings of the V International Conference on Electrical Bio-impedance , Tokyo.,Vol-8,pp:56-71 11. Segal KR. Van LM, Fitzgerald PI, Hodgdon JA, Van ITB.1988, Lean body mass estimation by bioelectrical impedence analysis: a four site cross validation study. Am J Clin Nutr ;47:7-14 12. Shah A H, Rakhshanda B; 2009.Body composition, its Significance and model for assessment: Pakistan Journal of Nutrition .Vol-2,pp:198-202 13. Sun SS, Chumlea WC, Heymsfield SB, Lukaski HC, Schoeller D, Friedl K, Kuczmarski RJ, Flegal KM, Johnson CL & Hubbard Van S ,2003 .Development of bioelectrical impedance analysis prediction equations for body composition with the use of a multicomponent model for use in epidemiological suerveys,Vol77,pp:331-340 14. Troiano RP, Flegal KM, Kuczmarski RJ.1995. Overweight prevalence and trends for children and adolescents: The National Health and Nutrition Examination Surveys, 1963 to1991. Arch Pediatr Adolesc Med ;Vol-149:1085–91 15. Verena KH, Jane RA, Michael RK, Simon DC, Shu H Z, Julie N B, Margie G, Sloane M, Manfred J M, and Kevin J G.2007.Total body protein in healthy adolescent girls: validation of estimates derived from simpler measures with neutron activation analysis. The American Journal of Clinical Nutrition; Vol-85,pp:66-72