UNSUPERVISED CLASSIFICATION USING WISHART CLASSIFIER Mounira Ouarzeddine , Boularbah Souissi , Aichouche Belhadj-Aissa USTHB, F.E.I, BP N° 32 El Alia Bab Ezzouar, Alger, Algérie, Email:
[email protected],
[email protected],
[email protected]
ABSTRACT In this paper we describe an unsupervised classification for polarimetric SAR images based on an eigenvector analysis of the coherency matrix which is calculated for each pixel and used to retrieve three important polarimetric classification parameters: Entropy, Alpha and Anisotropy. This classification procedure is based on the polarimetric decomposition theoreme introduced by Cloude and Pottier. They propose to identify polarimetric scattering mechanisms in the H-α plane sub-divided into 8 basic zones characterising different scattering behaviors. The different class boundaries, in the H-α plane, have been determined so as to discriminate surface scattering (SR), volume scattering (VD) and double bounce scattering (DB) along the α axis and low, medium and high degree of randomness along the entropy axis. The anisotropy is the third polarimetric indicator which is particularly useful to discriminate scattering mechanisms with different eigenvalue distributions. The 8 resulting clusters are splited each in two by comparing the anisotropy of each pixel to a threshold fixed to 0.5. The result of these classifications H-α and H-α–A were used as a training basis in the Wishart and Wishart classifications based on the Wishart statistics of multilook coherency matrix. The interpretation leads to the discrimination of different types of trees in the natural media that cannot be achieved without applying the wishart statistics. The resulting classes show an enhanced description and understanding of the observed scene. The polarimetric classification algorithms have been tested using the fully polarimetric airborne data sets acquired in the region of oberpfaffenhofen in Munich, Germany in the Pband. 1 INTRODUCTION Classification of SAR data acquired in single polarisation is difficult because of the poor separability of different characteristic scatterers at the ground. The availability of different polarisations is necessary, hence these can lead to the improvement of radar detection when the behaviour of parameters related to the objects on the ground is not identical. Throughout the years and especially in the last two decades, the ability of radar polarimetry to
obtain more information about physical properties of the surface than single-channel SAR data has led to a wide range of applications in geoscientific research, especially in agriculture, forestry, hydrology, flood plain, rural, infrastructure maintenance, volcanology, seismology and archeology. Radar backscattering is function of the electromagnetic wave parameters such as wave frequency, its polarisation and its incidence angle and other depending on the target such as surface geometry and dielectric characteristics of the medium [1]. In this context, an important objective is to extract physical information from the observed scattering of microwaves by surface and volume structures. One of the great challenges for polrimetric radar is to classify, sort and identify targets of all kinds. Recently, the characterisation and classification of terrain-cover using polarimetric SAR data has been extensively investigated and reported on. Earlier, The land classification algorithms based on the target scattering mechanisms have led to highly descriptive results about the physical properties of the earth surface. The fully polarimetric radars record the complete characterisation of the scattering field in all the configurations (HH, VV, HV, and VH), with their intensities or amplitudes and relative phases. The recorded polarimetric data allows a better characterisation of the scatterers based on the decomposition theorems [2]. Several work were focused on these theorems to identify the scattering mechanisms and their properties. Significant interpretation procedures, based on the classification and identification of the scattering mechanism were developed in order to distinguish various scatterers or targets. A combined use of physical scattering characteristics and statistical properties for terrain classification is desirable. In this paper, We propose a classification a and analysis of fully polarimetric data using a combination of entropy/alpha/anisotropy and complex whishart classifier. The combined classification procedure presented and discussed in this paper, is applied to PolSAR images of oberpfaffenhofen in Munich acquired by the AerS1 SAR system.
1
2 PRINCIPAL OF POLARIMETRIC DECOMPOSITIONS Polarimetric decomposition rely on the scattering matrix which describes mainly how radar targets or the elements on the ground surface scatter the electromagnetic energy. This matrix which is of dimension (2x2) is built for each Pixel. It is defined by[3]: ⎛ ⎞ S = ⎜⎜ S HH S HV ⎟⎟ ⎝ SVH SVV ⎠
(1)
Where H indicates horizontal polarisation and v indicates vertical polarisation. the elements of the matrix can be used for the representation of radar target scattering in any polarisation state. The first objective of decomposition theory is to express the average of the scattering mechanism in a sum of independent elements aiming to associate a physical mechanism to each component [2]. Several decomposition techniques were proposed. These techniques are based on three principal approaches [3][4][5] known as coherent methods, Huynen decomposition and non coherent methods. These methods split the scattering matrix into the sum of elementary scattering matrices, each one defining a deterministic scattering mechanism. The most used is the Pauli vector decomposition [2]. The Pauli vector is given by: ⎡ S hh + S vv ⎤ r 1 ⎢ Kp = S hh − S vv ⎥⎥ 2⎢ ⎣⎢ 2 S hv ⎦⎥
( 2)
Fig. 1: Contributuin of different mechanisms
In this work we are using the non coherent decomposition proposed by cloude and pottier using the Pauli basis. It is based on the coherency matrix given by [2]: r r [T ] = k p .k T p
(3)
This is a multilook 3x3 positive semi-definite hermitian coherency matrix, where the superscript T denotes the matrix transpose, and < > indicates multilook averaging. The 2 on the term is to ensure consistency in the span (total power) computation. The eigenvectors and eigenvalues of the coherency matrix T can be calculated to generate a diagonal form of the coherency matrix which can be physically interpreted as statistical independence between a set of target vectors. The eigenvalues of T therefore have direct physical significance in terms of the components of scattered power into a set of orthogonal unitary scattering mechanisms given by the eigenvectors of T , which for radar backscatter themselves form the columns of a 3 x 3 unitary matrix. Hence we can write an arbitrary coherency matrix in the form [6]:
[ ]
[ ]
[ ]
i =3
[T ] = [U 3 ][∑][U 3 ]−1 = ∑ λi ui ui*T
The first element of the vector expresses odd bounce scatterer such as the sphere, the plane surface or reflectors of trihedral type. The second one is related to a dihedral scatterers or double isotropic bounce and the third element is related to horizontal and a cross polarising associated to the diffuse scattering or volume scattering.
where [∑] is a 3x3 diagonal real elements ⎡λ1 [∑] = ⎢⎢ 0 ⎢⎣ 0
The polarimetric response of a given pixel is often a result of a mixture of scattering mechanisms. In fig. 1 we give the example of forest medium. we notice direct backscatter from branches(1), Direct backscatter from trunks(2), Direct backscatter from ground(3), Double-bounce scattering from trunks and ground(4), and double-bounce scattering from branches and ground(5). The polarimetric response is interpreted according to the contributing scatterers.
[U 3 ] = ⎢⎢sin α1 cos β1e iδ
(4)
i =1
matrix with nonnegative
0⎤ λ2 0 ⎥⎥ (5) 0 λ3 ⎥⎦ and [U 3 ] = [u1 u 2 u 3 ] is a unitary matrix, where u1 , u 2 , and u 3 are the three unit orthogonal eigenvectors. (6) ⎡
cos α1
1
⎢⎣ sin α1 sin β1e iγ 1
0
cos α 2 sin α 2 cos β 2 e iδ 2 sin α 2 sin β 2 e iγ 2
cos α 3 ⎤ sin α 3 cos β 3 e iδ 3 ⎥⎥ sin α 3 sin β 3 e iγ 3 ⎥⎦
There are four variables of interest, two from the eigenvalues, namely the entropy H and anisotropy A, and two from the eigenvectors, the α and β angles. The parameter α is an indicator of the type of scattering mechanism, and it ranges from 0 to 90
2
degrees. These parameters are easily evaluated as [7]: i =3
α=
∑Pα
(7)
i i
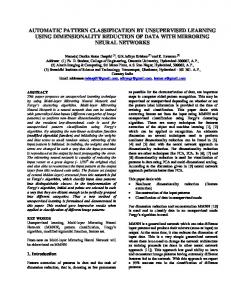
Fig. 2 gives a general description of the observed scene and shows the four forest types in particular. On this image part, we distinguish four types of forests:
i =1
where Pi are the probabilities obtained from the eigenvalues λi with : 0 ≤ Pi =
λi
≤1
i =3
∑λ
(8)
i
i =1
Class 4
To introduce the degree of statistical disorder of each target, the entropy is defined from the logarithmic sum of eigenvalues of the coherency matrix :
∑ P log ( P ) i
3
i
G:HV B:HH+VV
Class 2 Class 3
i =3
H =−
R:HH-VV
(9)
Class 1
i =1
The entropy H represents the randomness of the scattering, H = 0 indicates a single scattering mechanism (isotropic scattering) while H = 1 indicates a random mixture of scattering mechanisms with equal probability and hence a depolarising target. The anisotropy A is a parameter complementary to the entropy. The anisotropy measures the relative importance of the second and the third eigenvalues of the eigen-decomposition. It is given by:
λ − λ3 A= 2 λ 2 + λ3
(10)
If the pair H − α plotted on a plane then they are confined to a finite zone. This plane is subdivided into eight zones characterizing different classes of different scattering mechanisms. 3. DATA USED The test site is the operbfofenhoffen area in Munich Germany. It is composed of various agriculture areas, forests, and urban area. The Pband (72 cm) polarimetric image in a completely polarimetric mode of the E-SAR (Expiremental Synthetic Aperture Radar) system of the DLR (the German Aerospace Center) was used. The PolSAR images are of important value to supply information on terrain type. Fig. 2 shows a composite color of the test site using the Pauli basis. The P-band wave are able to penetrate forest canopy and get reflected from tree trunks and soil, thus offering the possibility to obtain information on the forest structure.
Fig. 2: RGB image in the Pauli basis Fig. 2 :RGB image in the Pauli basis
Class 1: Mixed natural young forest: Very young (about 4-5 years old), both coniferous and deciduous dense trees are contained in this forest class. Class 2: Dense coniferous forest .This class of forest contains coniferous trees, whish are relatively higher (in average 30m) and are so dense. Class 3: Old deciduous forest: This forest class contains old deciduous trees. They have big stem and medium height (20m). Trees are populated with low dense. Class 4: Young deciduous forest: This class contains both coniferous and young deciduous trees . Both trees are in medium size and have medium dense population. Trees height is averagely 15m. 4 CLASSIFICATION 4.1. Entropy_ alpha_anisotropy decomposition The basic scattering mechanism of each pixel of a polarimetric SAR image can then be identified by comparing its entropy and parameters to fixed thresholds. The different class boundaries, in the Halpha plane, have been determined so as to discriminate surface reflection (SR), volume diffusion (VD) and double bounce reflection (DB) along the axis and low, medium and high degree of randomness along the entropy axis. Detailed explanation, examples and parameter are observed with respect to
3
the H − α decomposition. Comments concerning the different classes can be found in the publication of Cloude and Pottier [6]. The entropy /alpha space for the test site is given in fig.3.a and the corresponding classification is given fig.3.b
anisotropy zones and Z2, Z4, Z6, Z8, Z10, Z12, Z14, Z16 are zones with important degree of anisotropy. With the introduction of the anisotropy, more details can be observed. The area of interest is squared. It is hard on this result to distinguish between forest types.
Z1 Z2 Z3 Z4 Z5 Z6 Z7 Z8 Fig. 3.a : Entropie/Alpha space Z9 Z10 Z9
Z11 Z12
Z8
Z13 Z14
Z7
Z15 Z16
Z6
Fig. 4 :Entropy /Alpha/Anisotropy partition
Z5 Z4 Z2 Z1
4.2.Modelisation by the Wishart complex distribution The eight and the sixteen classes resulted from the H − α and H / A / α decompositions are used as training sets for the initialization of the unsupervised Wishart classifier [6][7]. For a coherency matrix Ti of a pixel i of a
multilook image (L-looks) knowing the class ωi, the Wishart complex distribution is given by [7]:
Fig. 3.a :Entropy /Alpha partition
It can be observed that the proposed segmentation permits to identify in a macroscopic way the type of scattering mechanism as shown in Fig.3a. Agricultural fields and bare soils are characterized by surface scattering. Scattering over forested areas is dominated by volume scattering. When the anisotropy parameter is introduced, it allows the possibility to distinguish different clusters where the centers belong to the same H − α partition. Each zone in the H/alpha space is splited in two. This technique increases the number of classes from 8 to 16. In fig. 4, we give the H / A / α decomposition. Each zone in the H − α space is subdivided in two partition using the anisotropy parameter. The Z1, Z3, Z5, Z7, Z9, Z11, Z13, Z15 are weak
p( Ti / ωm ) =
N qN Ti
N −q
exp( −tr ( N [Σ m ]−1 Ti ))
K ( N , q) Σ m
N
(11) With
(
Σ m = E Ti Ti ∈ ωm 1 = Nm
)
(12)
Nm
∑ Ti
(13)
i =1 Where Nm is the pixel number of ωm
And K (N , q ) is the factor of standardization given by :
4
q K ( N , q) = π q( q −1) / 2 ∏ Γ( N − i + 1) i =1
(14)
Where q=3 in the case of reciprocity (i.e., Shv=Svh), and tr (.) indicate the determinant and the trace of the matrix respectively, and Γ(.) is the gamma function. A probabilistic measurement of the distance between the matrix of coherence of an unspecified pixel Ti , and the average matrix of coherence
The clusters of the first itération are used us a training set for the second itération until a consequent result is obtained. The combined Entropy/Alpha and Wishart classification gives more details compared to the entropy/alpha decomposition. The result is given in fig. 6.
C8 C7
∑ m of the class candidate ωm , is obtained using:
C6
−1 [T ] ) d ( [Ti ] , Σ m ) = ln Σ m + tr (Σ m i
C5
(15)
Mathematically, each coherency matrix of an individual pixel is assigned with the most likely class ωm with the minimal distance, if and only if : (16) d ( [Ti ] , Σ m ) ≤ d ( [Ti ] , Σ n ) for all wm ≠ wn The classification procedure is summerized in the flowshart given by fig. 5. Retrieval of the H − α and H − α -A spaces
C4 C3 C2 C1 Fig. 6. Classification entropy/alpha/ whishart
The forests site from the former classification is still mixed and do not delineate the forests type borders. The result of entropy/anisotropy/alpha decomposition used in the wishart classifier gave better result. We can see this in fig. 7.
Average coherency matrix computing for each classe
Modelisation by the complex distribution of Wishart
probabilistic measurement of the distance
Pixel assignement with minimal distance
Classified image H − α _ Wishart and H − α -A wishart
Fig. 7. Classification entropy/Anisotropy/alpha/ wishart
Fig 5: General flowshart of the classification
5
Classe 1, which contains both coniferous and deciduous young and dense trees, represent a dominant double bounce scattering. This because of the strong scattering of leaves and trunks. 5. CONCLUSION
Polarimetric SAR image is rich of information. In this study, we have shown the unsupervised classification of PolSAR data acquired over the Oberpfaffenhofen test site through two H −α and polarimetric decompositions: H − α − A . Also, we have stressed the role of these methods as first stage in an iterative maximum likelihood approach based on the complex Wishart distribution. The introduction of the anisotropy information in the second approach is useful for class identification to distinguish between different cluster centers.We used the H − α partition in the first appoach. In this context, more precise details of different terrain classes types are observed such as man-made targets, forest types and agriculture fields. It can be observed in fig. 7 that, in general, the classification shows an enhanced description and understanding of the observed scene. The entropy/Alpha/Anisotropy partition gives a confuse classification. The forest classes are mixed. With the use of the whishart distribution, the four forest classes seem to be better delineated if we compare with the RGB composite color.
[5] J.R. Huynen, “Phenomenological theory of radar targets.” ,Technical Report, University of Technology, Delft, The Netherlands, 1970. [6] S. R. Cloude and E. Pottier, “ An entropy based classification scheme for land applications of polarimetric SAR,” IEEE TGRS, vol.35, n°.1, pp. 68-78, Jan. 1997 [7] J. S. Lee, M R Grunes, T L Ainsworth, L J Du, D L Schuler, S R Cloude, “unsupervised Classification using Polarimetric Decomposition and the Complex Wishart Distribution,” IEEE Transactions Geoscience and Remote Sensing, Vol 37/1, No. 5, p 2249-2259, Sep. 1999.
6. ACKNOWLEDGEMENT The Authors wish to thank the Ex company Aerosensing for providing data. REFERENCES
[1] F. T. Ulaby and C. Elachi, “Radar polarimetry for geoscience applications,” Artech House, Norwood, MA, 1990 [2] S. R. Cloude and E. Pottier, “A review of target decomposition theorems in radar polarimetry,” IEEE transaction on Geoscience andi. Remote Sensing, vol. 34, pp. 498-518, Mar. 1996 [3] R. Touzi and F. Chabonneau, “Characterization of target symmetric scattering using polarimetric SARs,” IEEE transaction on Geoscience and. Remote Sensing, vol. 40, no. 11, pp. 693-711, Nov. 2002 [4] K. P. Papathanassiou, “Polarimetric SAR interferometry,” PhD_Thesis the faculty of natural sciences, department of physics, technical university Graz, Austria, Feb. 1999.
6