IEEE TRANSACTIONS ON POWER SYSTEMS, VOL. 31, NO. 3, MAY 2016
1779
A Dynamic Coherency Identification Method Based on Frequency Deviation Signals Ahmed M. Khalil, Graduate Student Member, IEEE, and Reza Iravani, Fellow, IEEE
Abstract—This paper presents a new method to dynamically determine coherent generators and electrical areas of an interconnected power system. The proposed method is based on dynamic frequency deviations of both generator and non-generator buses, with respect to the system nominal frequency. The proposed method 1) largely overcomes the limitations of the existing model-based and measurement-based coherency identification methods, 2) enables dynamic tracking of the coherency time-evolution, and 3) provides noise immunity which is imperative in practical implementation. The method also promises the potential for real-time coherency calculation. The proposed method is applied to the 16-machine/68-bus NPCC system based on time-domain simulation studies in the PSS/E platform and the results are compared with those of the classical slow-coherency (model-based) method and a measurement-based method. Index Terms—Coherency identification, coherent generators, frequency deviation, measurements-based, wide area monitoring.
I. INTRODUCTION
T
HE dynamic response of a multi-machine, large, interconnected power system to a disturbance includes multiple electromechanical oscillatory modes, approximately in the frequency range of 0.1–2 Hz. A subset of these modes constitutes the inter-area oscillatory modes [1]. The generators within an electrical area exhibit unison dynamic behavior, i.e., the frequencies and phase-angles of their inter-area oscillations are almost the same. Such units are referred to as “coherent” generators [2]. Identification of coherent generator groups is required for: • Controlled-Islanding [3]–[6]: This is to limit the spread of cascading events by partitioning the system into multiple controllable and self-sustainable islands. Different constraints, e.g., minimization of the generation-load imbalance based on real or real/reactive power have been adopted for coherency identification [6]. Coherent areas form the basis for islanding process. • Wide-Area Control [7]–[9]: This is to provide effective damping for inter-area oscillations through the identification of critical nodes and appropriately locating phasor measurements units (PMUs). Manuscript received August 14, 2014; revised December 28, 2014 and April 16, 2015; accepted June 25, 2015. Date of publication July 28, 2015; date of current version April 15, 2016. Paper no. TPWRS-01105-2014. The authors are with the Department of Electrical and Computer Engineering, University of Toronto, Toronto, ON M5S 3G4, Canada (e-mail:
[email protected];
[email protected]). Color versions of one or more of the figures in this paper are available online at http://ieeexplore.ieee.org. Digital Object Identifier 10.1109/TPWRS.2015.2452212
The technical literature reports two types of methods [10]–[15] for the coherency identification: 1) Model-based Methods: In this category the system eigen structure, based on a linearized dynamic model of the system, is used for the identification. 2) Measurement-based Methods: This category utilizes signals, e.g., generator speeds or bus voltages, for coherency identification. These signals are either measured or deduced from time-domain simulation of a nonlinear dynamic model of the system. The slow-coherency identification method [16], based on the two-time scale theory, belongs to the former category and is widely reported in the technical literature. This method assumes that coherency is independent of 1) disturbance severity and 2) details of the generator model [17]. Therefore, it neglects the electrical dynamics of the generators and inherently is not capable of considering the impacts of generator controllers on the coherency. Based on structural decomposition approach, [18] proposes a coherency identification method which considers the generator detailed nonlinear model. The slow-coherency concept divides the coherent generators into 1) tight coherent groups and 2) loose coherent groups [19]. In a tight coherent group all the generators are coherent with respect to each other. A loose coherent group is a set of generators in which each generator is coherent at least with one generator in the group; i.e., it is not necessary for all generators to be coherent, respectively. The slow-coherency method is also based on a prespecified number of coherent groups, thus it does not guarantee to prevent formation of loose coherent groups. Furthermore, it should be noted that 1) changes in the system operating conditions, 2) change in the system configuration, and 3) discrete operational modes of specific subsystems, e.g., HVDC links and wind power plants, can alter the system coherency structure. However, the slow-coherency identification inherently cannot account for such effects. Based on the continuation method, [20] presents an approach to consider changes in the coherency due to variations in the system operating conditions. The measurement-based coherency identification methods largely overcome the above limitations of the model-based methods. The reported measurement-based methods in the technical literature are based on the use of 1) fast Fourier transform [21]–[23], 2) empirical mode decomposition with the Hilbert transform [24]–[26], 3) energy functions [27], [28], 4) artificial neural networks [29], [30], 5) self-organizing maps [7], [31], 6) Partitioning Around Medoids [32], 7) graph theory [33], 8) particle swarm optimization [34], 9) mutual information theory [8], 10) nonlinear Koopman modes [35], 11) support vector clustering [36], 12) principal component analysis (PCA)
0885-8950 © 2015 IEEE. Personal use is permitted, but republication/redistribution requires IEEE permission. See http://www.ieee.org/publications_standards/publications/rights/index.html for more information.
1780
IEEE TRANSACTIONS ON POWER SYSTEMS, VOL. 31, NO. 3, MAY 2016
[37], and 13) K-harmonic means clustering (KHMC) [38]. An extensive review of different coherency identification methods is presented in [39]. The limitations of existing measurement-based methods include 1) excessive computational burden, 2) significant amount of data processing, 3) inability to handle partial observability and/or missing data, and 4) sensitivity to noise. This paper proposes a measurement-based coherency identification method which 1) overcomes the aforementioned limitations, 2) provides a mechanism for real-time tracking and visualization of dynamic coherency evolution, 3) has potential for on-line coherency determination, and 4) shows immunity to white noise in the measurements. The proposed method is based on determining frequency deviations of the power system generator buses, e.g., based on the use of a wide area monitoring system (WAMS), and we refer to it as the dynamic coherency determination (DCD) method. This paper also extends the DCD method to nongenerator buses and identifies each electrical area based on both coherent generators and the associated non-generator buses. The proposed DCD method is applied to NPCC [40] test system and the results are compared with those obtained from 1) a model-based slow-coherency identification method and 2) a measurement-based coherency identification method [41]. The study results demonstrate the degree of noise immunity of the DCD method as compared with those of the ICA and the PCA methods [41]. The reminder of this paper is organized as follows. The proposed DCD method is described in Section II. Section III presents the results from the application of the DCD method to a test system. Section IV reports the DCD method's CPU time and noise immunity and provides a comparison with those of the model-based and measurement-based methods. Section V concludes the paper. II. DYNAMIC COHERENCY DETERMINATION (DCD) METHOD
where is the number of generators in the coherent group. COIFD is a representative of the coherent group for identifying the corresponding electrical area. • Frequency deviation is equally calculable at non-generator buses. This provides a means to associate non-generator buses to coherent generator groups and construct electrical areas. Subsequent to a disturbance in the power system, the frequency deviation of bus “ ” at time can be determined from the rate of change of the phase angle of the bus voltage (3) where is the system nominal frequency, is the voltage phase angle of bus “ ”, and and are time instants. Therefore, for a time interval (T) subsequent to a disturbance, n frequency deviation measurements are specified where (4) The vector-space tors, where
is formed by the frequency deviation vec(5)
and (6) is the number of buses. Equation (5) assumes that where voltage measurements of all buses are available or can be calculated from the measurements of the observable buses, i.e., the system is fully observable. A. Identification of Coherent Generators The frequency deviation vectors of the generator buses form the vector-space where
The DCD method is composed of two steps. • Identification of coherent generator groups. • Association of non-generator buses with the appropriate coherent generator groups to form “electrical areas”. The required signal for the DCD method is the frequency deviation, with respect to the system nominal frequency, within a pre-specified time period. This signal is obtained at each bus “ ” of the system at pre-specified time instants and form the frequency deviation vector
Two generators “ ” and “ ” are considered coherent after a disturbance if the difference in the corresponding rotor angles, and therefore the terminal bus frequency deviations, remain relatively small throughout the time interval of interest. This difference between the frequency deviation vectors can be expressed by the coherency coefficient which is defined as the cosine of the angle between and
(1)
(8)
The reasons for selecting the frequency deviation signal are: • Frequency deviation is a natural representative of the status of variations in the generator rotor angle upon which the concept of coherency is defined. • Frequency deviation vectors can be used to determine the Center Of Inertia Frequency Deviation (COIFD) vector of a group of coherent generators. We define the COIFD vector as the average frequency deviation vector of the generators of a coherent group (2)
(7)
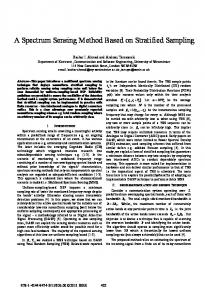
ranges from to 1 where indicates identical frequency deviation vectors and thus “perfect coherency”. This is practically the case when generators “ ” and “ ” are connected to the same bus. In the proposed method, the degree of coherency is determined based on the difference between the CC and a pre-specified value is the limit which separates coherent and non-coherent generators. Based on the value of , we define as follows: Definition: Two frequency deviation vectors, and , are “related” in terms of coherency if they are located in the same space formed by a right angle cone (from hereafter “cone”)
KHALIL AND IRAVANI: A DYNAMIC COHERENCY IDENTIFICATION METHOD BASED ON FREQUENCY DEVIATION SIGNALS
1781
based on a more relaxed value of as compared to of (9). The reason for relaxing is to come up with a viable and practically meaningful number of coherent groups. If is too close to unity, then each generator constitutes a group. If is much smaller than unity, then all generators will form one group. These are the two extreme limits of any coherency identification method. — Select a relaxed (as compared to value for , e.g., (11) Calculate the for each pair “ ” and “ ” groups of STEP-I. — Merge the two “related” groups “ ” and “ ” with the highest into a new coherent group “ ” Fig. 1. Definition of related/unrelated frequency deviation vectors in terms of coherency.
whose axis is along one of the two frequency deviation vectors and the cosine of its vertex angle is equal to , otherwise they are unrelated. Fig. 1 shows that frequency deviation vectors and are within the cone whose axis is along and the cosine of its vertex angle is . Therefore, and are related to in terms of coherency; however, does not belong to the same space and is “unrelated” to . It should be noted that and are not necessarily related to each other. Fig. 1 also indicates that CC of any two related vectors, e.g., and , is either smaller than or equal to . Thus to decompose the vector-space into a set of coherent groups, sets of “related” frequency deviation vectors, where each set is expressed by its unique COIFD, need to be determined, as follows. STEP-I: The objective of this step is to divide generator buses into groups where in each group all frequency deviation vectors are tightly “related”, i.e., is close to 1, e.g., 0.99. — Select a value for , e.g., . Select a generator bus, e.g., bus “ ” and assign it to group “ ”. Assign to group “ ” all the generator buses “js” such that (9) Thus all the generators of group “ ” are tightly and bilaterally related. This also ensures the uniqueness of the group, irrespective of the bus selected to start the process. — Continue the above step for the remaining buses until all the buses are divided in K groups with m buses in each group. Both K and m are integers that can assume values of unity or larger. — Calculate COIFD vector of each group (10) where
is the number of generators in group , and is the reference vector for group . STEP-II: The objective of this step is to combine the tightly “related” generator groups of STEP-I into coherent groups,
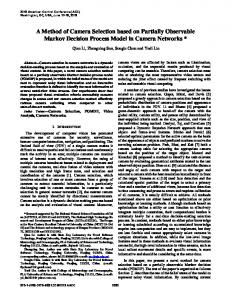
(12) — Repeat the above two sub-steps until all the CCs are less than . Step-II divides all the generator buses into coherent groups with a COIFD vector representing each group. The COIFD vectors are used in the next phase of the DCD method. B. Association of Non-Generator Buses Subsequent to identification of the coherent generator groups from the previous subsection, the non-generator buses are associated to each group, as follows. — Determine of each non-generator bus “ ”. — Calculate for each non-generator bus “ ” and every coherent group “ ” where group “ ” is represented by its vector (12). — Associate non-generator bus “ ” to the coherent group which provides the highest value of . It should be noted that: — Similar to all measurement-based methods, the DCD method requires full-observability. All generator buses are observable; however, the non-generator buses must be either observable or equipped with PMUs. — Categorization/admission process of the non-generator buses to coherent groups, is not dependent on the selected value of which is used only for coherency identification of generators. The reason is that the non-generator buses are admitted to group which they exhibit the highest CC with. The following sections present the results from applying the DCD method to a study system. III. STUDY RESULTS This section provides the results from the application of the proposed DCD method to the test system of Fig. 2 which is composed of 16 machines and 68 buses and represents an equivalent of the NPCC system [40]. The reported studies are based on digital time-domain simulation of the system in the PSS/E (Version 33) platform. Each generator circuitry is represented by a 4th-order rotor electrical dynamic model. The stator electrical circuit is represented in the network steady-state model. For each generator, the magnetic saturation effects of both axes are included in the model. The input mechanical power to each
1782
IEEE TRANSACTIONS ON POWER SYSTEMS, VOL. 31, NO. 3, MAY 2016
Fig. 2. Schematic diagram of the study system.
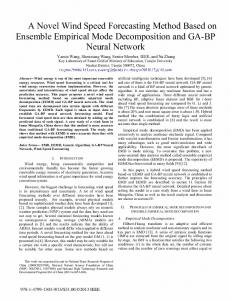
generator is assumed to remain unchanged and the governor system dynamics are not considered. Eight of the generators are equipped with DC excitation systems, and one is equipped with a static excitation system and a speed-deviation driven power system stabilizer (PSS). The remaining generators are assumed to be under constant excitation control. The transmission system is represented by the network nodal equations. The system data is available in [40]. The simulation time-step is 1.667 ms and each simulation case provides 20 s of dynamic response of the system subsequent to a disturbance [42]. The simulated response is sampled at the rate of 120 Hz in compliance with the IEEE standard for synchrophasor measurements [43]. A large number of case studies were conducted, however, only three sample case studies which exhibit distinct characteristics, are reported in this paper. The coherency is identified based on (11). Case I: Initially the system is under a steady-state condition and at s is subjected to a 5-cycle, self-cleared 3-phase to ground fault at bus 27. This disturbance results in creation of 7 areas as given in Table I. In this case, the system is divided into two large areas (Area 1 and Area 5) and the remaining areas are of comparable sizes. Fig. 3 shows the electrical boundaries of the areas. Fig. 4 shows the frequency deviation signals of the generator buses used to construct the vector subspace (7). The system dynamics during the first 10 seconds of the simulation period is paramount in identifying the coherent groups where the footprints of the system nonlinearities are evident. The dynamics are, in general, influenced by the generator models and the interactions among their controllers. For example, since Generator 9 is equipped with a fast acting static exciter and a PSS, it responds actively and differently to the faults as compared to the generators which are equipped with DC exciters or those under constant excitation. This even can result in the separation of Generator 9 into an area on its own,
Fig. 3. Areas corresponding to Case I.
subsequent to a disturbance. However, if the oscillatory mode of Generator 9 is not excited, it tends to merge with Generator 8 and Generator 13 and form one area (as will be further discussed in Case III). The reason is that these three generators simultaneously contribute to three of the poorly damped oscillatory modes of the systems as shown in Table II. Table II shows the low-frequency oscillatory modes of the system with damping ratios up to 5.5% and the main participating generators in each mode. Table II highlights the tendency of Generators 8, 9, and 13 to excite mode 5 and potentially form one area. This dynamic evolution of coherency cannot be observed if a model-based coherency identification approach is adopted. Case II: The system initial condition is the same as that of Case I. The same fault as that of Case I is imposed on bus 33
KHALIL AND IRAVANI: A DYNAMIC COHERENCY IDENTIFICATION METHOD BASED ON FREQUENCY DEVIATION SIGNALS
1783
TABLE I COHERENT GROUPS AND THE ASSOCIATED BUSES (CASE I)
TABLE II LEAST-DAMPED (DOMINANT MODES) AND PARTICIPATING GENERATORS (CASE I)
Fig. 5. Areas corresponding to Case II.
Fig. 4. Simulated frequency deviation signals of the generator buses for case I.
which results in the formation of 7 areas as given in Table III. Area 7 is a major one and contains 10 generators and 85% of the
system non- generator buses. The other areas are smaller. Area 2 is formed only by Generator 10. Generators 14, 15, and 16 form separate areas. Moreover, the fault at bus 33 results in the formation of Area 3 which is fully encapsulated by Area 7, as shown in Fig. 5. This reveals that the system is dominated by and practically behaves as a single area and not affected by the fault when compared with Case I (and Case III as will be discussed subsequently). This result, in case of the controlled-islanding, would have been remained unnoticed in the system analysis process if a model-based coherency identification method was used.
1784
IEEE TRANSACTIONS ON POWER SYSTEMS, VOL. 31, NO. 3, MAY 2016
TABLE III COHERENT GROUPS AND AREAS (CASE II)
TABLE V COHERENCY COEFFICIENTS OF THE SEPARATED NON-GENERATOR BUSES (CASE III)
TABLE VI CPU TIME TO IDENTIFY COHERENT ELECTRICAL AREAS
implemented controlled-islanding schemes, i.e., this set of buses can neither be appended to any of the areas they have electrical connections to, nor can form a separate area as they do not include any generators. This indicates that potentially there is a need for modifications to the current controlled-islanding algorithms to account for such scenarios. IV. DISCUSSIONS Fig. 6. Areas corresponding to Case III. TABLE IV COHERENT GROUPS AND AREAS (CASE III)
A. Computational Time Table VI shows the CPU time for the case studies based on the proposed DCD method. The CPU time is associated with DCD method implementation on MATLAB R2011a on an Intel Core2 Duo 2.66-GHz computer with 4 GB of memory. Since the method is not implemented on a dedicated hardware, the CPU time changed from one run to another. Therefore, the average of 10 runs per case is reported in Table VI. These results show that the proposed method is computationally efficient. The technical literature does not report the CPU time for other methods and thus no relative comparison is presented. B. Comparison With the Slow-Coherency Method
Case III: The system initial operating condition is the same as those of Case I and Case II; however the same fault is applied to bus 53. The fault results in formation of 8 areas, Table IV, which is the maximum number of areas observed in all the performed case studies. In this case, Generator 9 merges with Generators 8 and 13 into a single area, Fig. 6. This is in contrast to the results of Case I and Case II. In this case, a set of non-generator buses (buses 40, 47, and 48) are appended to an area which they are not directly connected to. Table V shows the CCs of these buses with respect to the COIFD vectors of areas 1–8. The reason for such a scenario is mainly the system configuration in which the fault at bus 53 separate buses 40, 47, and 48 from the rest of the system. This outcome can have ramifications for the currently
Applying the slow-coherency method to the test system, using the same initial conditions considered in the reported Case I to Case III, provides the coherent groups and areas as given in Table VII [44]. These groups and areas are fixed and remain unchanged based on the definition of the slow-coherency identification method. Therefore, the results of Table VII are not necessarily representative of all possible formations of coherent groups after a large-signal dynamic disturbance or a major change in the operational condition. Under large-signal disturbances, the definition of slow-coherency is not necessarily valid and this can be confirmed by comparing the results of Table I (DCD method) and those of Table VII (the classical slow-coherency method). This comparison shows that 1) number of areas, 2) coherent generators within each area, and 3) the associated non-generator buses in each area, can be drastically different for the two case studies. The main feature of the proposed DCD method is that it captures the impact of
KHALIL AND IRAVANI: A DYNAMIC COHERENCY IDENTIFICATION METHOD BASED ON FREQUENCY DEVIATION SIGNALS
TABLE VII COHERENT GROUPS AND AREAS (SLOW-COHERENCY METHOD [1], [44])
1785
TABLE IX COHERENT GROUPS AND AREAS (DCD METHOD)
TABLE VIII COHERENT GROUPS AND AREAS (METHOD OF [41])
as the ICA method but with the advantage of lower computation burden as described in the section above. Comparing the structures of the proposed DCD and the ICA methods indicates that the DCD method is computationally more efficient than the ICA method. The reason is that the DCD method is based on processing the signals in the time-domain with an iterative loop as explained in Section II. The maximum number of iteration in any case studied did not exceed 6 iterations. However, the ICA method analyzes the measured signals in the frequency-domain, based on discrete Fourier transform, in addition to an algorithm that utilizes an iterative technique to obtain the mixing matrix (A) and the ICA matrix (S) [41]. system changes and accordingly identifies coherent generators and areas. C. Comparison With Measurements-Based Methods Reference [40] applies a measurement-based method, based on the Independent Component Analysis approach, to the study system of Fig. 2 and the results are reported in Table VIII. Applying the ICA method to the same system also generates the same results as reported in Table VIII. Reference [40] assumes DC excitation systems for those generators which are not under constant excitation. The disturbance is due to a 10% increase in the mechanical input power of all generators for 80 ms. Table IX shows the results from the proposed DCD method when the operating conditions and the disturbance are the same as those of [41]. It should be noted that when Generator 9 in the system of choice is equipped with a DC exciter and the PSS is disabled, the DCD method, provides the same results as those of Table VIII. Comparison of Tables VIII and IX highlights the differences in the corresponding results. In Table IX, Generator 9 and buses 28 and 29 form a separate area, and Generator 11 and bus 32 also form an area. The reason for the differences between the results of the two tables is the presence of the static exciter and PSS at Generator 9. The above comparison reveals that the proposed DCD method is able to identify the same coherent groups and areas
D. Performance Under Noise The performance of the proposed DCD method is tested under the presence of white Gaussian noise with the signal-to-noise ratio (SNR) of (13) where is the root-mean-square value of the noise-free measured signal and is the root-mean-square value of the added noise. Noise-free DCD-based coherency identification results constitute the base case and the SNR value is initially selected at 50 db and decreased in steps of 5 db until the deviations from the base case is observed. For all the three studied cases, this occurs at SNR value less than 20 db and the least coherent generator is the first to separate from its coherent group due to the increased discrepancy in its frequency deviation vector and the COIFD vector of the remaining generators. For Case I, area 6 is divided and Gen15 and Gen16 form separate areas. In Case II, Gen 13 is the first generator to form a separate group and this is followed by Gen1 and Gen12 at lower value of SNR (15 db). In Case III, Gen9 separates from area 2 and forms a new area. To compare the proposed DCD method with the PCA and ICA methods, the same system and disturbance that have been reported in [41] are considered. The proposed DCD method is capable to identify the same coherent groups at noise levels higher than db. At this noise level, based on the
1786
IEEE TRANSACTIONS ON POWER SYSTEMS, VOL. 31, NO. 3, MAY 2016
DCD method, area 5 of Table VIII breaks down into 4 separate areas. Comparing the results to those of the PCA and ICA methods [41], indicates that the noise immunity of the proposed DCD method is valid for SNR values as low as 20 db while those of the PCA and ICA methods are limited to 50 db and 25 db, respectively. Since the slow coherency methods are not data-driven methods, noise sensitivity analysis does not apply. V. CONCLUSION This paper presents a new method for identification of the dynamic evolution of coherency in interconnected power systems. The proposed method is based on the bus frequency deviation in time-domain which makes it also a conceptually viable method for a real-time framework. The proposed method also includes the procedure for partitioning the system into electrical areas by identifying the associated non-generator buses with each group of coherent generators. The paper applies the method to a study system which is composed of 16 generators and 68 buses, i.e., an equivalent of the NPCC system, and compares the results with those of a slow-coherency algorithm and a measurement-based method. The study results show: • Depending on the location and type of generator controllers, e.g., static exciter and PSS, the system can exhibit different coherent groups of generators and areas. Such coherent groups and areas can be readily determined by the proposed method. • The proposed method is computationally efficient and requires lower computation burden as compared to other measurements-based methods. • The proposed method is immune to measurement noise up to SNR of 20 db which is higher than noise levels of the reported methods. REFERENCES [1] G. Rogers, Power Systems Oscillations. Norwell, MA, USA: Kluwer, 2000. [2] J. H. Chow, , J. H. Chow, Ed., “Introduction,” in Power System Coherency and Model Reduction. New York, NY, USA: Springer, 2013. [3] H. You, V. Vittal, and W. Xiaoming, “Slow coherency-based islanding,” IEEE Trans. Power Syst., vol. 19, no. 1, pp. 483–491, Feb. 2004. [4] B. Yang, V. Vittal, G. T. Heydt, and A. Sen, “A novel slow coherency based graph theoretic islanding strategy,” in Proc. IEEE Power Eng. Soc. General Meeting, 2007, Jun. 24–28, 2007, p. 1, 7. [5] L. Ding, F. M. Gonzalez-Longatt, P. Wall, and V. Terzija, “Two-step spectral clustering controlled islanding algorithm,” IEEE Trans. Power Syst., vol. 28, no. 1, pp. 75–84, Feb. 2013. [6] J. Li, C. Liu, and K. P. Schneider, “Controlled partitioning of a power network considering real and reactive power balance,” IEEE Trans. Smart Grid, vol. 1, no. 3, pp. 261–269, Dec. 2010. [7] B. Padhy, S. Srivastava, and N. Verma, “A coherency-based approach for signal selection for wide area stabilizing control in power systems,” IEEE Syst. J., vol. 7, no. 4, pp. 807–816, Dec. 2013. [8] F. Dorfler, M. R. Jovanovic, M. Chertkov, and F. Bullo, “Sparsity-promoting optimal wide-area control of power networks,” IEEE Trans. Power Syst., to be published. [9] N. Kishor, L. Haarla, J. Turunen, M. Larsson, and S. R. Mohanty, “Controller design with model identification approach in wide area power system,” IET Gener., Transm., Distrib., vol. 8, no. 8, p. 1430, 1443, Aug. 2014. [10] B. D. Spalding, H. Yee, and B. D. Goudie, “Coherency recognition for transient stability studies using singular points,” IEEE Trans. Power App. Syst., vol. PAS-96, no. 4, pp. 1368–1375, Jul. 1977.
[11] R. Podmore, “Identification of coherent generators for dynamic equivalents,” IEEE Trans. Power App. Syst., vol. PAS-97, no. 4, pp. 1344–1354, Jul. 1978. [12] B. Avramovic, P. V. Kokotovic, J. R. Winkelman, and J. H. Chow, “Area decomposition for electromechanical models of power systems,” Automatica, vol. 16, no. 6, pp. 637–648, Nov. 1980. [13] J. R. Winkelman, J. H. Chow, B. C. Bowler, B. Avramovic, and P. V. Kokotovic, “An analysis of interarea dynamics of multi-machine systems,” IEEE Trans. Power App. Syst., vol. PAS-100, no. 2, pp. 754–763, Feb. 1981. [14] H. Kim, G. Jang, and K. Song, “Dynamic reduction of the large-scale power systems using relation factor,” IEEE Trans. Power Syst., vol. 19, no. 3, pp. 1696–1699, Aug. 2004. [15] K. Mei, S. M. Rovnyak, and C. Ong, “Clustering-based dynamic event location using wide-area phasor measurements,” IEEE Trans. Power Syst., vol. 23, no. 2, pp. 673–679, May 2008. [16] J. H. Chow, G. Peponides, P. V. Kokotovic, B. Avramovic, and J. R. Winkelman, Time-Scale Modeling of Dynamic Networks With Applications to Power Systems. New York, NY, USA: Springer, 1982, pp. 33–58. [17] R. Podmore, “Coherency in power systems,” in Power System Coherency and Model Reduction, J. H. Chow, Ed. New York, NY, USA: Springer, 2013, p. 18. [18] E. De Tuglie, S. M. Iannone, and F. Torelli, “A coherency recognition based on structural decomposition procedure,” IEEE Trans. Power Syst., vol. 23, no. 2, pp. 555–563, May 2008. [19] J. H. Chow, “New algorithms for slow coherency aggregation of large power systems,” in Proc. 1995 IMA Volumes in Mathematics and Its Applications, vol. 64, pp. 95–115. [20] W. Xiaoming, V. Vittal, and G. T. Heydt, “Tracing generator coherency indices using the continuation method: A novel approach,” IEEE Trans. Power Syst., vol. 20, no. 3, p. 1510, 1518, Aug. 2005. [21] M. Jonsson, M. Begovic, and J. Daalder, “A new method suitable for real-time generator coherency determination,” IEEE Trans. Power Syst., vol. 19, no. 3, pp. 1473–1482, Aug. 2004. [22] K. L. Lo, Z. Z. Qi, and D. Xiao, “Identification of coherent generators by spectrum analysis,” Proc. Inst. Elect. Eng., Gener., Transm., Distrib., vol. 142, no. 4, pp. 367–371, Jul. 1995. [23] A. Vahidnia, G. Ledwich, E. Palmer, and A. Ghosh, “Generator coherency and area detection in large power systems,” IET Gener., Transm., Distrib., vol. 6, no. 9, p. 874, 883, Sep. 2012. [24] N. Senroy, “Generator coherency using the Hilbert-Huang transform,” IEEE Trans. Power Syst., vol. 23, no. 4, pp. 1701–1708, Nov. 2008. [25] D. Lauria and C. Pisani, “Real time generator coherency evaluation via Hilbert transform and signals morphological similarity,” in Proc. 2014 Int. Symp. Power Electronics, Electrical Drives, Automation and Motion (SPEEDAM), Jun. 18–20, 2014, pp. 78–83. [26] S. Avdakovic, E. Becirovic, A. Nuhanovic, and M. Kusljugic, “Generator coherency using the wavelet phase difference approach,” IEEE Trans. Power Syst., vol. 29, no. 1, pp. 271–278, Jan. 2014. [27] M. H. Haque and A. H. M. A. Rahim, “Identification of coherent generators using energy function,” Proc. Inst. Elect. Eng., Gener., Transm., Distrib. C, vol. 137, no. 4, pp. 255–260, Jul. 1990. [28] M. H. Haque, “Identification of coherent generators for power system dynamic equivalents using unstable equilibrium point,” Proc. Inst. Elect. Eng., Gener., Transm., Distrib. C, vol. 138, no. 6, pp. 546–552, Nov. 1991. [29] M. A.-E.-A. Abd-EI-Rehim, I. D. Helal, and M. A. H. Omar, “Multi-machine power system dynamic equivalents using artificial intelligence (ANN),” in Proc. 11th Int. Middle East Power Systems Conf., MEPCON 2006, Dec. 19–21, 2006, vol. 1, pp. 197–207. [30] A. Vahidnia, G. Ledwich, E. Palmer, and A. Ghosh, “Generator coherency and area detection in large power systems,” IET Gener., Transm., Distrib., vol. 6, no. 9, pp. 874–883, Sep. 2012. [31] T. N. Nababhushana, K. T. Veeramanju Shivanna, and Shivanna, “Coherency identification using growing self organizing feature maps [power system stability],” in Proc. 1998 Int. Conf. Energy Management and Power Delivery, EMPD'98, Mar. 3–5, 1998, vol. 1, pp. 113–116, vol. 1. [32] G. C. Pyo, J. W. Park, and S. I. Moon, “A new method for dynamic reduction of power system using PAM algorithm,” in Proc. 2010 IEEE Power and Energy Soc. General Meeting, Jul. 25–29, 2010, pp. 1–7. [33] M. A. Rios and O. Gomez, “Identification of coherent groups and PMU placement for inter-area monitoring based on graph theory,” in Proc. 2011 IEEE PES Conf. Innovative Smart Grid Technologies (ISGT Latin America), Oct. 19–21, 2011, pp. 1–7.
KHALIL AND IRAVANI: A DYNAMIC COHERENCY IDENTIFICATION METHOD BASED ON FREQUENCY DEVIATION SIGNALS
[34] M. Davodi, H.-R. Modares, E. Reihani, M. Davodi, and A. Sarikhani, “Coherency approach by hybrid PSO, K-means clustering method in power system,” in Proc. IEEE 2nd Int. Power and Energy Conf., 2008, PECon 2008, Dec. 1–3, 2008, pp. 1203–1207. [35] Y. Susuki and I. Mezic, “Nonlinear Koopman modes and coherency identification of coupled swing dynamics,” IEEE Trans. Power Syst., vol. 26, no. 4, p. 1894, 1904, Nov. 2011. [36] R. Agrawal and D. Thukaram, “Support vector clustering-based direct coherency identification of generators in a multi-machine power system,” IET Gener., Transm., Distrib., vol. 7, no. 12, p. 1357, 1366, Dec. 2013. [37] K. K. Anaparthi, B. Chaudhuri, N. F. Thornhill, and B. C. Pal, “Coherency identification in power systems through principal component analysis,” IEEE Trans. Power Syst., vol. 20, no. 3, pp. 1658–1660, Aug. 2005. [38] K. Tang and G. K. Venayagamoorthy, “Online coherency analysis of synchronous generators in a power system,” in Proc. 2014 IEEE PES Innovative Smart Grid Technologies Conf. (ISGT), Feb. 19–22, 2014, pp. 1–5. [39] R. Singh, M. Elizondo, and L. Shuai, “A review of dynamic generator reduction methods for transient stability studies,” in Proc. 2011 IEEE Power and Energy Soc. General Meeting, Jul. 24–29, 2011, pp. 1–8. [40] B. Pal and B. Chaudhuri, Robust Control in Power Systems. New York, NY, USA: Springer, 2005. [41] M. A. M. Ariff and B. C. Pal, “Coherency identification in interconnected power system—An independent component analysis approach,” IEEE Trans. Power Syst., vol. 28, no. 2, pp. 1747–1755, May 2013. [42] P. Kundur, J. Paserba, V. Ajjarapu, G. Andersson, A. Bose, C. Canizares, N. Hatziargyriou, D. Hill, A. Stankovic, C. Taylor, T. Van Cutsem, and V. Vittal, “Definition and classification of power system stability IEEE/CIGRE joint task force on stability terms and definitions,” IEEE Trans. Power Syst., vol. 19, no. 3, pp. 1387–1401, Aug. 2004.
1787
[43] IEEE Standard for Synchrophasor Measurements for Power Systems, IEEE Std. C37.118.1-2011 (Revision of IEEE Std. C37.118-2005), Dec. 28, 2011, pp. 1–61. [44] S. B. Yusof, G. J. Rogers, and R. T. H. Alden, “Slow coherency based network partitioning including load buses,” IEEE Trans. Power Syst., vol. 8, no. 3, pp. 1375–1382, Aug. 1993.
Ahmed M. Khalil (S'13) received the B.Eng. and M.Sc. degrees in electrical engineering from Cairo University, Cairo, Egypt. Currently, he is pursuing a Ph.D. degree at the University of Toronto, Toronto, ON, Canada. His research interests include large-scale integration of renewable energy resources, power systems dynamics, and control.
Reza Iravani (M'87–SM'00–F'03) received the B.Sc., M.Sc., and Ph.D. degrees, all in electrical engineering. Currently, he is a Professor with the University of Toronto, Toronto, ON, Canada. His research interests include power electronics, power system dynamics, and control.