CIT. Journal of Computing and Information Technology, Vol. 26, No. 2, June 2018, 131–140 doi: 10.20532/cit.2018.1004123
131
A Framework for Efficient Recognition and Classification of Acute Lymphoblastic Leukemia with a Novel Customized-KNN Classifier Duraiswamy Umamaheswari1 and Shanmugam Geetha2 1 2
Department of Computer Science, Vidyasagar College of Arts and Science, Udumalpet, Tamil Nadu, India Department of Computer Science, Government Arts College, Udumalpet, Tamil Nadu, India
Even in this modern era today, life's extent is still being challenged by many pathological diseases such as cancer. One such hazard is leukemia. Even a trivial setback in detecting leukemia lead to a severe outcome: the affected cells may eventually prove to be fatal. To combat this, we propose an algorithm to better segment the nucleus region of White Blood Cells (WBC) found in stained blood smear images with the intent of identifying Acute Lymphoblastic Leukemia (ALL). In our proposal, the image is made ready for segmentation in the preprocessing stage by changing its size, brightness, and contrast. In the segmentation stage, the nucleus region is segmented by mathematical operators and Otsu's thresholding. Then mathematical morphological operators are applied in post-processing stage, which makes the nucleus region convenient for feature extraction. Finally, the segmented regions are classified into ALL affected and regular cells by means of the proposed Customized K-Nearest Neighbor classifier algorithm. This work was experimented with over 80 images of the ALL-IDB2 dataset and attained an accuracy rate of 96.25%, 95% of sensitivity and 97% of specificity.
ACM CCS (2012) Classification: Computing methodologies → Machine learning → Machine learning approaches → Instance-based learning Computing methodologies → Computer graphics → Image manipulation → Image processing Applied computing → Life and medical sciences → Systems biology Keywords: acute lymphoblastic leukemia, KNN classifier, morphology, segmentation, WBC
1. Introduction The malignancy named leukemia is a type of blood cancer, which spoils the immune system of the human body through the abnormal
production of leukocytes. It is categorized into four subtypes: Acute Lymphoblastic Leukemia (ALL), Acute Myelogenic Leukemia (AML), Chronic Lymphoblastic Leukemia (CLL), and Chronic Myelogenic Leukemia (CML). Amongst these, the ALL is a type of childhood cancer [1], but it most frequently affects the elderly population. Timely detection of the disease increases the survival rate of leukemia patients. Although many research proposals have been accepted to accomplish this objective [2] to reduce the death rate, more accurate predictions are needed to early detect the life seizing disease leukemia. This framework has been developed to identify corrupted leukocytes and recognize ALL affected blood cells by segmenting and analyzing the nucleus of leukocytes in microscopic stained blood smear images. In the base work [9], the nucleus region of WBC is segmented using thresholding and morphological operators. Utilization of the threshold value will not accomplish good segmentation with images of varying pixel intensities. In hematology laboratories, the blood smear images are captured in different lightings and atmosphere, so they will be of various levels of brightness. To rectify these issues, we propose segmenting the nucleus region based on enhancing the pixel intensity and contrast, resulting in improved detection accuracy of leukocytes. This paper is organized as follows: Section 2 shows existing and related research works in the same field, Section 3 produces the methodology of the system proposed, Section 4 discusses the results of experiments made, Section 5 exhibits uniqueness of the system, and Section 6 concludes the paper.
132
2. Literature Review Leukemia is a disease of minimal initial symptoms, which makes early detection extremely difficult. But detection at early stage alone saves the life of patients. Many research works in the area of leukemia analysis are done with the major intention of substantiating the burden of hematologists. There are varieties of algorithms for segmenting and classifying blood components such as nucleus, with varying accuracy levels. In 2013, Minal D. Joshi et al. [3] also segmented the nucleus region of WBC by thresholding and morphology, and in their proposal, classification was done by the KNN classifier with 93% of accuracy. In 2015, Cecilia Di Ruberto et al. [4] segmented the nucleus of WBCs by means of a machine learning classifier, SVM. In that case, the pixels were segmented through learning by training method, for the sake of ALL identification. Jyoti Rawat et al. [5] reported a classification method using GLCM-texture features and shape features along with the SVM classifier, which shows better classification accuracy rate of 89.8% than was the one accomplished by applying them separately. Morteza Moradi Amin et al. [6] examined k-means clustering in partitioning the pixels of blood cell images into four distinct clusters, using the H and S components of the HSV color space. These clusters represent various constituent parts of blood images. But this does not yield the final segmentation result. In order to obtain the exact region of the nucleus, morphological operators are applied. Subrajeet Mohapatra et al. [7] illustrated that the appropriate combination of image processing and machine learning techniques like c-means clustering algorithm for segmentation, statistical features of nucleus region along with cytoplasm, and ensemble classifiers in classification result in more accuracy in discriminating the types of ALL. In 2016, C. T. Basima and Janu R. Panicker [8] did the segmentation by k-means clustering and the classification by SVM classifier. They achieved the accuracy rate of 94.56%. In 2017, Raju Bhukya et al., [9] segmented the nucleus of WBC by thresholding. Then the classification was done with the SVM classifier, which ensured the accuracy rate of 93.33%. This is considered as the base work for this proposal. Jyothi Rawat et al. [10] designed a
D. Umamaheswari and S. Geetha
methodology for segmenting the nucleus of WBC using Otsu's thresholding with morphological operators. In their work, they classified the types of ALL in three phases: classification of normal and cancerous cells, classification of L1 from other ALL types, classification of L2 and L3. Muhammad Sajjad et al. [11] designed a k-means clustering method of segmentation with ensemble multi-class SVM classifier which showed considerable improvement in accuracy rate. In 2018, Sachin Kumar et al. [12] demonstrated a method of segmentation by k-means clustering with the assistance of color, texture, geometrical and shape features of the nucleus. They used KNN and Naïve Bayes classifiers to achieve effective classification with the accuracy rate of 92.8%. Based on the intensity values, Zeinab Moshavash et al. [13] have separated the leukocytes from erythrocytes and the background of blood smear image. Then ensemble classifiers for classification is done by giving extracted text, shape and LBP features of segmented leukocytes. Here the authors have reported that the LBP features are better for ALL classification than using GLCM. This work has shown the accuracy of 89.91%.
3. Proposed Framework 3.1. Image Acquisition and Preprocessing Because of their size, images of the blood cells are seen through microscope only. The input of the proposed system are stained microscopic peripheral blood smear images. There are various freely available datasets of microscopic leukemia images. Amongst them, the standard ALL-IDB benchmark dataset is selected for this investigation. Processing the obtained raw image is impossible since it can be of any size. Therefore, for the requirement of unity in size, the image is transformed into the conventional size of 256 × 256 pixel matrix. In this application, the color information is not needed to extract the edges of WBCs. Thus, to avoid the complexity of visualization and for the amenity of processing, the 3D RGB image is changed into the grayscale image.
133
A Framework for Efficient Recognition and Classification of...
By specifying the smallest and largest stretching limits of intensity values, all the constituent pixels of the image are kept between 0 to 255. Here the intensity stretching process offers a more prominent show off to the blood cells from their background. Contrast is a vital factor [14] to improve the visual quality of an image. Therefore, the contrast of a blood smear image is improved using the equation (3) mentioned in the algorithm by means of histogram equalization. 3.2. Image Segmentation After the preprocessing phase, the intensity stretched and contrast-enhanced images are joined together. Since the digital images are articulated in terms of matrices of pixels, each element of the first image matrix is added to the matching element in the second image matrix. If the resultant matrix exceeds the range of fractional numbers, they are rounded off. This brightens all the blood components within the image except the nucleus of WBC. Now, each pixel of the brightened image matrix is subtracted by the corresponding pixel in the contrast stretched image to extract the boundaries of blood components. To take out the region of interest (ROI), the pixels of the brightened image are added to the corresponding pixels in the boundary extracted image. As a result, the nucleus region is separated. Subsequent to partitioning the nucleus region of WBC, the image is filtered using a two-dimensional order statistical minimum filter for removing unwanted noise components that may exist in the image. As a final step of segmentation, the intensity values of the pixels in the filtered gray image is changed to either 0 or 1 valued pixels, based on the Otsu's global thresholding. At this moment, the nucleus region contains 1 valued pixels that are black (in color), the remaining area filled up with 0 valued pixels that are white (in color). Then the image is complemented, to make nucleus and background regions white and appear black in colors correspondingly; this highlights the ROI. 3.3. Image Post-Processing The outcome of segmentation does not give a clear-cut region of the nucleus. Therefore, some post-processing tasks are carried out using
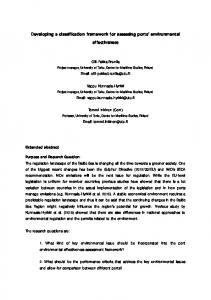
mathematical morphological operators. At first, the image is eroded, which discards the boundary pixels for disconnecting the nucleus region from other components. That shrinks the nucleus region a little and unobserved holes inside the region are enlarged. Erosion is done with the help of a structuring element of size 2. To locate the features of the nucleus, it must be a separate and whole component. This is accomplished by the morphological closing operation, which closes the holes at the boundaries of the nucleus region with the same kind of structuring element of size 2. Now, the holes inside the region are filled with morphological filling. Filling operation works by changing the connected pixels in the background of ROI to the pixels in the foreground, till the boundaries are reached. A blood smear image may contain more than one WBC-nucleus region. To extract the features of the nucleus for the analysis, the largest of all must be extracted. This is done by labeling and comparing the areas of nucleus regions. 3.4. Feature Extraction and Classification The characteristics of a particular image object are observed by extracting its features. Here, Gray Level Cooccurrence Matrix (GLCM) texture features, statistical and geometrical features of the nucleus are extracted and given as input to Customized K-Nearest Neighbor classifier (C-KNN) [15]. C-KNN classifier measures the distance between the features of ROI, using a customized distance metric, as shown in equation (11). This classifies the given blood cell image into benign or malignant. The process flow of the proposed system is shown in Figure 1. 3.5. Steps in the Proposed Framework 3.5.1. Phase 1
1. Obtain the microscopic blood smear image to be tested. 2. Resize the obtained true color RGB image into 256 × 256 image matrix. 3. Convert the multichannel RGB image into the grayscale image
132
2. Literature Review Leukemia is a disease of minimal initial symptoms, which makes early detection extremely difficult. But detection at early stage alone saves the life of patients. Many research works in the area of leukemia analysis are done with the major intention of substantiating the burden of hematologists. There are varieties of algorithms for segmenting and classifying blood components such as nucleus, with varying accuracy levels. In 2013, Minal D. Joshi et al. [3] also segmented the nucleus region of WBC by thresholding and morphology, and in their proposal, classification was done by the KNN classifier with 93% of accuracy. In 2015, Cecilia Di Ruberto et al. [4] segmented the nucleus of WBCs by means of a machine learning classifier, SVM. In that case, the pixels were segmented through learning by training method, for the sake of ALL identification. Jyoti Rawat et al. [5] reported a classification method using GLCM-texture features and shape features along with the SVM classifier, which shows better classification accuracy rate of 89.8% than was the one accomplished by applying them separately. Morteza Moradi Amin et al. [6] examined k-means clustering in partitioning the pixels of blood cell images into four distinct clusters, using the H and S components of the HSV color space. These clusters represent various constituent parts of blood images. But this does not yield the final segmentation result. In order to obtain the exact region of the nucleus, morphological operators are applied. Subrajeet Mohapatra et al. [7] illustrated that the appropriate combination of image processing and machine learning techniques like c-means clustering algorithm for segmentation, statistical features of nucleus region along with cytoplasm, and ensemble classifiers in classification result in more accuracy in discriminating the types of ALL. In 2016, C. T. Basima and Janu R. Panicker [8] did the segmentation by k-means clustering and the classification by SVM classifier. They achieved the accuracy rate of 94.56%. In 2017, Raju Bhukya et al., [9] segmented the nucleus of WBC by thresholding. Then the classification was done with the SVM classifier, which ensured the accuracy rate of 93.33%. This is considered as the base work for this proposal. Jyothi Rawat et al. [10] designed a
D. Umamaheswari and S. Geetha
methodology for segmenting the nucleus of WBC using Otsu's thresholding with morphological operators. In their work, they classified the types of ALL in three phases: classification of normal and cancerous cells, classification of L1 from other ALL types, classification of L2 and L3. Muhammad Sajjad et al. [11] designed a k-means clustering method of segmentation with ensemble multi-class SVM classifier which showed considerable improvement in accuracy rate. In 2018, Sachin Kumar et al. [12] demonstrated a method of segmentation by k-means clustering with the assistance of color, texture, geometrical and shape features of the nucleus. They used KNN and Naïve Bayes classifiers to achieve effective classification with the accuracy rate of 92.8%. Based on the intensity values, Zeinab Moshavash et al. [13] have separated the leukocytes from erythrocytes and the background of blood smear image. Then ensemble classifiers for classification is done by giving extracted text, shape and LBP features of segmented leukocytes. Here the authors have reported that the LBP features are better for ALL classification than using GLCM. This work has shown the accuracy of 89.91%.
3. Proposed Framework 3.1. Image Acquisition and Preprocessing Because of their size, images of the blood cells are seen through microscope only. The input of the proposed system are stained microscopic peripheral blood smear images. There are various freely available datasets of microscopic leukemia images. Amongst them, the standard ALL-IDB benchmark dataset is selected for this investigation. Processing the obtained raw image is impossible since it can be of any size. Therefore, for the requirement of unity in size, the image is transformed into the conventional size of 256 × 256 pixel matrix. In this application, the color information is not needed to extract the edges of WBCs. Thus, to avoid the complexity of visualization and for the amenity of processing, the 3D RGB image is changed into the grayscale image.
133
A Framework for Efficient Recognition and Classification of...
By specifying the smallest and largest stretching limits of intensity values, all the constituent pixels of the image are kept between 0 to 255. Here the intensity stretching process offers a more prominent show off to the blood cells from their background. Contrast is a vital factor [14] to improve the visual quality of an image. Therefore, the contrast of a blood smear image is improved using the equation (3) mentioned in the algorithm by means of histogram equalization. 3.2. Image Segmentation After the preprocessing phase, the intensity stretched and contrast-enhanced images are joined together. Since the digital images are articulated in terms of matrices of pixels, each element of the first image matrix is added to the matching element in the second image matrix. If the resultant matrix exceeds the range of fractional numbers, they are rounded off. This brightens all the blood components within the image except the nucleus of WBC. Now, each pixel of the brightened image matrix is subtracted by the corresponding pixel in the contrast stretched image to extract the boundaries of blood components. To take out the region of interest (ROI), the pixels of the brightened image are added to the corresponding pixels in the boundary extracted image. As a result, the nucleus region is separated. Subsequent to partitioning the nucleus region of WBC, the image is filtered using a two-dimensional order statistical minimum filter for removing unwanted noise components that may exist in the image. As a final step of segmentation, the intensity values of the pixels in the filtered gray image is changed to either 0 or 1 valued pixels, based on the Otsu's global thresholding. At this moment, the nucleus region contains 1 valued pixels that are black (in color), the remaining area filled up with 0 valued pixels that are white (in color). Then the image is complemented, to make nucleus and background regions white and appear black in colors correspondingly; this highlights the ROI. 3.3. Image Post-Processing The outcome of segmentation does not give a clear-cut region of the nucleus. Therefore, some post-processing tasks are carried out using
mathematical morphological operators. At first, the image is eroded, which discards the boundary pixels for disconnecting the nucleus region from other components. That shrinks the nucleus region a little and unobserved holes inside the region are enlarged. Erosion is done with the help of a structuring element of size 2. To locate the features of the nucleus, it must be a separate and whole component. This is accomplished by the morphological closing operation, which closes the holes at the boundaries of the nucleus region with the same kind of structuring element of size 2. Now, the holes inside the region are filled with morphological filling. Filling operation works by changing the connected pixels in the background of ROI to the pixels in the foreground, till the boundaries are reached. A blood smear image may contain more than one WBC-nucleus region. To extract the features of the nucleus for the analysis, the largest of all must be extracted. This is done by labeling and comparing the areas of nucleus regions. 3.4. Feature Extraction and Classification The characteristics of a particular image object are observed by extracting its features. Here, Gray Level Cooccurrence Matrix (GLCM) texture features, statistical and geometrical features of the nucleus are extracted and given as input to Customized K-Nearest Neighbor classifier (C-KNN) [15]. C-KNN classifier measures the distance between the features of ROI, using a customized distance metric, as shown in equation (11). This classifies the given blood cell image into benign or malignant. The process flow of the proposed system is shown in Figure 1. 3.5. Steps in the Proposed Framework 3.5.1. Phase 1
1. Obtain the microscopic blood smear image to be tested. 2. Resize the obtained true color RGB image into 256 × 256 image matrix. 3. Convert the multichannel RGB image into the grayscale image
134
D. Umamaheswari and S. Geetha
distance measure given below:
3.5.2. Phase 2
6. Brighten the image, except for the nucleus I1 = I(Intensity_Enhanced) + I(Contrast_Stretched) (4) 7. Extract the borders of all components. I2 = I1 + I(Contrast_Stretched)
(5)
8. Separate the nucleus region of WBC I3 = I1 + I2
(6)
9. Filter the image using 2-D order statistic minimum filtering I(Filtered_Image)[P(i)] = = Min{IX1, …, IXn}, 1 ≤ i ≤ n;
(7)
where X is the window. 10. Binarize the filtered image with the Otsu's global thresholding and complement to highlight ROI.
135
A Framework for Efficient Recognition and Classification of...
d=
( x + y )2 + ( x − y )2
(11)
Here, x, y represents the features.
4. Experimental Results and Discussion The proposed method has been experimented with microscopic thin blood smear images acquired from ALL-IDB2 open source benchmark dataset of 260 images of 2592 × 1944 pixels resolution [16]. The images have been captured by a Canon PowerShot G5 Camera attached to an optical laboratory microscope. Inside the database, 130 are malignant images of ALL category and 130 are benign images [17]. The dataset is divided into two separate parts, one is a training data set, and the other one is
a test data set. The system has learned through 180 images and tested on 80 images. To avoid confusion in the selection, the first 90 images from each malignant and benign category, respectively are chosen for training purpose and the remaining 40 images in each category are used for testing purpose. This gives the results shown in Figure 2, with both malignant and benign image samples. In leukemia research, mostly texture features of the nucleus region are utilized to define the malignancy. Texture features provide details about the intensity of difference between the pixels. The most important statistical texture extraction method is GLCM. Therefore we analyze the nucleus region based on its visible and invisible characters by means of texture and geometrical features [18]. Table 1 shows the values of 14 GLCM features extracted from the segmented nucleus regions. For illustration, one image is randomly chosen from each, benign and ma-
Table 1. Extracted features of the segmented nucleus region.
3.5.3. Phase 3
Benign
Malignant
0.005413
0.01647
0.9973
0.9918
The correlation of a pixel to its neighbors in the ROI.
0.9689
0.9529
Sum of squared elements in GLCM. Measure of randomness that characterizes the texture of ROI
0.8207
0.6334
0.4544
0.7686
The average value of all pixels in the nucleus region.
0.0954
0.2247
The value of dispersion of a pixel from the mean.
0.2938
0.4174
Smoothness of intensity values in the nucleus region. Shape of the probability distribution of a real-valued random pixel. Asymmetry of probability distribution of real-valued random pixels. Arithmetic mean position of all pixels inside the region.
0.9998
0.9999
8.5829
2.7405
2.7537
1.3193
122.13
133.37
Total number of pixels inside the region.
6255
14725
13. Perimeter
Number of nonzero pixels on the boundary of ROI.
285.92
843.97
14. Roundness
The circularity of ROI.
0.9665
0.2597
g
11. Erode boundary of the selected region and expose unseen holes inside ROI Figure 1. The process flow of the proposed system.
I(Eroded_Image) = I(Filtered_Image) Ө H = (Ī ⊕ H*)'
Feature
1. Contrast
12. Close the selected region by closing I(Closed_Image) = I(Eroded_Image) · H = (I ⊕ H) Ө H
4. Amplify the intensity of grayscale image using Linear Contrast Enhancement
where H is the structuring element.
I ( Intensity _ Enhanced ) = NewMax − NewMin + NewMin Max − Min (2) 5. Adjust the contrast of the image with histogram equalization. = ( I − Min ) ×
I(Contrast_Stretched)[P(i)] = ni / n, 0 ≤ i < L
(3)
Here ni is the total number of occurrences of pixel i in the image, n is the total number of pixels in the image, and L is the total number of gray levels in the image.
Description
(8)
here, H is the structuring element. I(Gray_Image) = 0.2989R + 0.5870G + 0.1140B (1)
g
2. Homogeneity
(9)
13. Fill the tiny holes within the region I(Holes_Filled) = =ROIK = (ROIK – 1 ⊕ H) ∩ I, for K =1,2, … (10) 14. Label the objects in the image to find the biggest blob.
3. Correlation 4. Energy 5. Entropy 6. Root Mean Square 7. Standard Deviation 8. Smoothness 9. Kurtosis 10. Skewness
3.5.4. Phase 4
15. Extract needed features of the nucleus 16. Classify the images using Customized K-Nearest Neighbor algorithm with the
11. Centroid 12. Area
The measure of intensity between a pixel and its neighbors in the nucleus region. Closeness of the distribution of pixels in the region.
136
D. Umamaheswari and S. Geetha
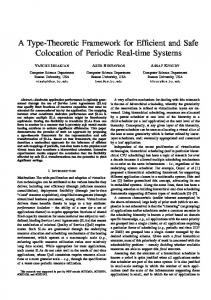
lignant category of the test dataset, and their features are shown. The same set of features are extracted from all the 260 images and then training and testing datasets are selected from them. These features are given as input to the C-KNN classifier for classifying cancerous and noncancerous images. (a) Original images
(f) All blood components removed except nucleus
The proposed work is evaluated repetitively on a large number of images. To reduce the computational time of GLCM, the number of gray levels of the image is reduced from 256 to 32 levels by dividing the resized image (12) with an appropriate value [19]. Image = (256 × 256 Image) / 8
(b) Resized images
(g) Otsu's thresholded and complemented
(c) Gray converted and intensity adjusted using LCE
(h) Nucleus eroded images
137
A Framework for Efficient Recognition and Classification of...
The receiver operator characteristics curve of the classifier and Area Under the Curve (AUC) are shown in Figure 3. In the plot, the X coordinate represents the false positive rate and Y coordinate represents the true positive rate. According to the value of AUC, the following judgments can be declared about the classifier performance: AUC ≥ 0.9 → Excellent AUC = 0.8 – 0.9 → Good AUC = 0.7 – 0.8 → Fair, and AUC = 0.6 – 0.7 → Poor.
(12)
By identifying the similarities and variations in the features of 80 test images, the C-KNN classifier has done the classification. Table 2 shows the confusion matrix based on True Positive, False Negative, True Negative, and False Positive values calculated as the results of the classification. Table 3 demonstrates the parameters assessed with the help of the confusion matrix. These parameters facilitate evaluation of the performance of the C-KNN classifier. Table 2. Confusion matrix of the C-KNN classifier. Condition Positive Test
Negative
Negative True Positive 38 Positive
False Positive 1
False Negative 2 True Negative 39
Figure 3. ROC of classification outcome of the binary C-KNN classifier.
Table 3. Performance evaluation from confusion matrix. (d) Contrast enhanced
(e). Brightened and boundary extracted.
(i) Nucleus regions closed and holes filled-in
(j). Biggest blob found.
Figure 2. Experimental results of proposed algorithm with benign and malignant images.
Parameters
Formulae
Result of Experiments in %
Accuracy
(TP + TN)/((TP + FN + TN + FP))
96.25
Error Rate
(FP + FN)/((TP + FN + TN + FP))
3.75
Sensitivity (TPR)
TP/(TP + FN)
95.00
Specificity (TNR) Rate of Positive Predictions Rate of Negative Predictions False Negative Rate (FNR) False Positive Rate (FPR)
TN/(TN + FP)
97.50
RPP = (TP + FP)/((TP + FN + TN + FP))
48.75
RNP = (FN + TN)/((TP + FN + TN + FP))
51.25
FNR = FN/(TP + FN)
5.00
FPR = FP /(TN + FP)
2.50
136
D. Umamaheswari and S. Geetha
lignant category of the test dataset, and their features are shown. The same set of features are extracted from all the 260 images and then training and testing datasets are selected from them. These features are given as input to the C-KNN classifier for classifying cancerous and noncancerous images. (a) Original images
(f) All blood components removed except nucleus
The proposed work is evaluated repetitively on a large number of images. To reduce the computational time of GLCM, the number of gray levels of the image is reduced from 256 to 32 levels by dividing the resized image (12) with an appropriate value [19]. Image = (256 × 256 Image) / 8
(b) Resized images
(g) Otsu's thresholded and complemented
(c) Gray converted and intensity adjusted using LCE
(h) Nucleus eroded images
137
A Framework for Efficient Recognition and Classification of...
The receiver operator characteristics curve of the classifier and Area Under the Curve (AUC) are shown in Figure 3. In the plot, the X coordinate represents the false positive rate and Y coordinate represents the true positive rate. According to the value of AUC, the following judgments can be declared about the classifier performance: AUC ≥ 0.9 → Excellent AUC = 0.8 – 0.9 → Good AUC = 0.7 – 0.8 → Fair, and AUC = 0.6 – 0.7 → Poor.
(12)
By identifying the similarities and variations in the features of 80 test images, the C-KNN classifier has done the classification. Table 2 shows the confusion matrix based on True Positive, False Negative, True Negative, and False Positive values calculated as the results of the classification. Table 3 demonstrates the parameters assessed with the help of the confusion matrix. These parameters facilitate evaluation of the performance of the C-KNN classifier. Table 2. Confusion matrix of the C-KNN classifier. Condition Positive Test
Negative
Negative True Positive 38 Positive
False Positive 1
False Negative 2 True Negative 39
Figure 3. ROC of classification outcome of the binary C-KNN classifier.
Table 3. Performance evaluation from confusion matrix. (d) Contrast enhanced
(e). Brightened and boundary extracted.
(i) Nucleus regions closed and holes filled-in
(j). Biggest blob found.
Figure 2. Experimental results of proposed algorithm with benign and malignant images.
Parameters
Formula
Result of Experiments in %
Accuracy
(TP + TN)/((TP + FN + TN + FP))
96.25
Error Rate
(FP + FN)/((TP + FN + TN + FP))
3.75
Sensitivity (TPR)
TP/(TP + FN)
95.00
Specificity (TNR) Rate of Positive Predictions Rate of Negative Predictions False Negative Rate (FNR) False Positive Rate (FPR)
TN/(TN + FP)
97.50
RPP = (TP + FP)/((TP + FN + TN + FP))
48.75
RNP = (FN + TN)/((TP + FN + TN + FP))
51.25
FNR = FN/(TP + FN)
5.00
FPR = FP /(TN + FP)
2.50
138
D. Umamaheswari and S. Geetha
The AUC value of the proposed C-KNN classifier is 0.9625. Hence, its performance can be stated as excellent.
5. The Significance of the Proposed Framework The KNN classifier is a supervised classification method. It determines the class by measuring the distance between the features of training samples and test samples. If the measured distance for a given test image is more similar to a malignant training sample, then the image is classified as malignant, otherwise it is classified as benign. Numerous research works have been implemented with KNN classifier by applying typical distance measures. Application of different distance metrics creates a greater impact on the classification accuracy [20]. The most commonly used distance measure is Euclidean, since the KNN classifier with Euclidean distance measure (13) performs better than all other standard metrics like Cityblock, Minkowsky, and Cosine.
∑i =1 ( xi − yi ) d= m
2
m
(13)
As an exploratory approach, the KNN classifier with a new customized distance measure shown in the equation (11) has been experimented in this proposal. It achieves upgraded performance by finding the distance between a
test data point and sample data points more accurately [21]. The proposed approach is compared with the performance of a number of other (existing) systems in which standard machine learning classifiers have been used for classification. Amongst these, the proposed C-KNN classifier provides the highest accuracy rate of 96.25% and also outperforms the base approach. Improved classification accuracy proves that the distance measure we proposed finds more accurate distance with ALL-IDB2 leukemia dataset than the typical distance measures used in existing systems using the same dataset. Hence, in our work, the customization of KNN is done by applying a novel distance measure. The proposed segmentation algorithm has also been experimented with the KNN classifier with Euclidean measure achieving an accuracy rate of 95.96%.
6. Conclusion Our approach detects the ALL with 96.25% accuracy rate which is better than in other existing approaches. Hence it will show more accurate predictions with peripheral blood smear images. For doing this, the system segments the nucleus region of WBCs, which are classified based on GLCM texture, statistical and geometrical features. As an entirely novel approach, the Customized K-Nearest Neighbor classifier classifies with 96.25% accuracy, 95% sensitivity and 97.50% specificity. This is 0.29% more
Table 4. The accuracy of the proposed framework compared to existing approaches. Author
Proposed year
Number of Test images used
Classifier
Accuracy
Minal D. Joshi et al., [3]
2013
108
KNN
93%
Jyoti Rawat et al.[5]
2015
260
SVM
89.8%
C. T. Basima, Janu R. Panicker [8]
2016
94
SVM
94.56%
Raju Bhukya et al., [9]
2017
80
SVM
93.33%
Sachin Kumar et al. [12]
2018
60
KNN
92.8%
Zeinab Moshavash et al. [13]
2018
108
KNN
94.76%
Proposed approach with KNN (applying Euclidean)
–
80
KNN-Euclidean
95.96%
Proposed work
–
80
C-KNN
96.25%
A Framework for Efficient Recognition and Classification of...
accurate than KNN with Euclidian measure and 2.92% more accurate than the base work. The AUC value achieved by this approach is 0.9625. To save people's lives, the proposed approach can be used in hemato-pathology laboratories, in order to assist hematologists in detecting leukemia more accurately. Since this research proposal is producing commendable results, it will act as an initiative for making modifications in the KNN algorithm with some other distance measures. In our future work, we are planning to achieve improvements using the ensemble of different classifiers combined with the proposed system to produce even more accurate results.
References [1] C.-H. Pui et al., "Mechanisms of Disease Acute Lymphoblastic Leukemia", The New England Journal of Medicine, vol. 350, pp. 1535–48, 2004. [2] S. Shafique and S. Tehsin, "Computer-Aided Diagnosis of Acute Lymphoblastic Leukaemia", Computational and Mathematical Methods in Medicine, vol. 2018, 2018. https://doi.org/10.1155/2018/6125289 [3] M. D. Joshi et al., "White Blood Cells Segmentation and Classification to Detect Acute Leukemia", International Journal of Emerging Trends & Technology in Computer Science, vol. 2, no. 3, 2013. [4] C. Di Ruberto et al., "A Multiple Classifier Learning by Sampling System from White Blood Cells segmentation", ResearchGate, Conference Paper, August 2015. https://doi.org/10.1007/978-3-319-23117-4_36 [5] J. Rawat et al., "Computer Aided Diagnostic System for Detection of Leukemia Using Microscopic Images", 4th International Conference on Eco-Friendly Computing and Communication Systems, Procedia Computer Science, vol. 70, pp. 748–756, 2015. https://doi.org/10.1016/j.procs.2015.10.113 [6] M. M. Amin et al., "Recognition of Acute Lymphoblastic Leukemia Cells in Microscopic Images Using K-Means Clustering and Support Vector Machine Classifier", Journal of Medical Signals and Sensors, vol. 5, no. 1, pp. 49–58, 2015. [7] S. Mohapatra et al., "Automated Morphometric Classification of Acute Lymphoblastic Leukaemia in Blood Microscopic Images Using an Ensemble of classifiers", Computer Methods in Biomechanics and Biomedical Engineering: Imaging and Visualization, vol. 4, no. 1, 2016. https://doi.org/10.1080/21681163.2014.897650
139
[8] C. T. Basima et al., "Enhance Leukocyte Classification for Leukemia Detection", International Conference on Information Science (ICIS), IEEE, 2016, pp. 65–71. [9] R. Bhukya et al., "Detection of Acute Lymphoblastic Leukemia using Microscopic Images of Blood", International Journal of Advanced and Applied Sciences, vol. 4, no. 8, pp. 74–78, 2017. https://doi.org/10.21833/ijaas.2017.08.011 [10] J. Rawat et al., "Classification of Acute Lymphoblastic Leukaemia Using Hybrid Hierarchical Classifiers", Multimedia Tools and Applications, Springer 2017, 76: 19057 https://doi.org/10.1007/s11042-017-4478-3 [11] M. Sajjad et al., "Leukocytes Classification and Segmentation in Microscopic Blood Smear: A Resource-Aware Healthcare Service in Smart Cities", IEEE ACCESS, 2017. https://doi/10.1109/ACCESS.2016.2636218 [12] S. Kumar et al., "Automatic Detection of Acute Leukemia using K-Mean Clustering Algorithm", Advances in Intelligence Systems and Computing, vol. 554, Springer, 2018. https://doi.org/10.1007/978-981-10-3773-3_64 [13] Z. Moshavash et al., "An Automatic and Robust Decision Support System for Accurate Acute Leukemia Diagnosis from Blood Microscopic Images", Journal of Digital Imaging, Springer, 2018. https://doi.org/10.1007/s10278-018-0074-y [14] C. Y. Wong et al., "Image Contrast Enhancement using Histogram Equalization with Maximum Intensity Coverage", Journal of Modern Optics, vol. 63, no. 16, 2016. https://doi.org/10.1080/09500340.2016.1163428 [15] F. Albregtsen, "Statistical Texture Measures Computed from Gray Level Cooccurrence Matrices", CiteSeerX, 2008. www.uio.no https://homes.di.unimi.it/scotti/all/ [16] R. Donida Labati et al., "ALL-IDB: The Acute Lymphoblastic Leukemia Image Database for Image Processing", 18th IEEE International Conference on Image Processing, 2011, pp. 2045–2048. http://doi.org/10.1109/ICIP.2011.6115881 [17] M. M. Trivedi, "Object Detection Based on Gray Level Cooccurrence", Computer Vision, Graphics, and Image Processing, vol. 28, pp. 199–219, 1984. http://dx.doi.org/10.1016/S0734-189X(84)80022-5 [18] D.-C. He et al., "Texture Feature Extraction", Pattern Recognition Letters, vol. 6, no. 4, pp. 269–273, 1987. https://doi.org/10.1016/0167-8655(87)90087-0 [19] L.-Y. Hu, "The Distance Function Effect on K-nearest Neighbor Classification for Medical
140
D. Umamaheswari and S. Geetha
Datasets", Springerplus, vol. 5, no. 1, pp. 1304, 2016. https://doi.org/10.1186/s40064-016-2941-7 [20] S. Arumugam and A. Thangapandi Isaac, "Modern Analysis", New Gamma Publishing House, Palayamkottai, India.
Contact addresses: Duraiswamy Umamaheswari Department of Computer Science Vidyasagar College of Arts and Science Udumalpet, Tamil Nadu India e-mail:
[email protected] Shanmugam Geetha Department of Computer Science Government Arts College Udumalpet, Tamil Nadu India e-mail:
[email protected]
Received: April 2018 Revised: July 2018 Accepted: July 2018
Duraiswamy Umamaheswari has completed her MSc, and MPhil, degrees in Computer Science. She presented three papers in international conferences and published four papers in international journals. She has qualified in State Level Eligibility Test (SLET). At present she is working as Assistant Professor in Vidyasagar College of Arts and Science, Udumalepet, Tamil Nadu. She has 12 years of teaching experience at various colleges. Currently she is pursuing the PhD (Part-Time) degree in Computer Science, at the Government Arts College, Udumalpet, Tamil Nadu, India. Her area of interest is image processing.
Shanmugam Geetha has completed her MSc, MPhil and PhD degrees in Computer Science. She has published more than ten papers in international journals of repute. Her area of specialization is soft computing. She has 20 years of experience in PSG College of Technology, Coimbatore, Tamil Nadu. Presently she is working as Assistant Professor at Government Arts College, Udumalpet, Tamil Nadu, India.