Dayton. OH 45469. ABSTRACT. -4 new clustering algorithm is proposed. This algo- ... new algorithm provides better results than the compet- ing methods on a ...
A NEW ALGORITHM FOR DETECTING THE OPTIMAL NUMBER OF SUBSTRUCTURES IN THE DATA Khaled S. Youriis
Martan P. DeSamio B Steven K. Rqqers
The University of Dayton Dayton. OH 45469
-Air Force Institute of Technology, AFITIENG lVright-Patterson -4FB. OH 45433-7765
ABSTRACT
-4new clustering algorithm is proposed. This algorithm uses a weighted Alahalanobis distance (TVMD) as a distance metric to perform partitional clustering This TVMD prevents the generation of unusually large or unusually small clusters. Properties of the new algorithm are presented by examining the clustering quality for codebooks designed with the proposed method and two common methods that use Euclidean distance. The new algorithm provides better results than the competing methods on a variety of data sets. Application of this algorithm to the problem of estimation the optimal number of subgroups present in the data set is discussed. 1. INTRODUCTION
Cluster analysis is one of the basic tools for identifying structure in data. Clustering usually implies partitioning of a collection of objects (tanks, images, cancerous areas in a mammogram) into c disjoint subsets. That is, to partition a set 3t of n samples X = ( 2 1 , x2,... z,} c Rdinto subsets RI,.., Rc. Each subset is to represent a cluster, with objects in the same cluster being somehow “more similar” than samples in different clusters. In other words. objects in a cluster should have common properties which distinguish them from the members of the other clusters. Each subset ‘?tt is represented by a codeword U , , where U , is the centroid of the samples in ‘?tt. A well known algorithm for the design of a locally optimal codebook with iterative codebook improvement is the generalized Lloyd algorithm (GL,4) [l].The two steps in each iteration of this algorithm are:
Step 1: Given a codebook C, = {v, ; i = 1,.. . ,IC } obtained from the rnth iteration, assign each data point to the closest codeword. Step 2: Obtain the codebook Cm+l by computing the centroid of each cluster based on the partitioning of Step 1.
503
The above algorithm is usually terminated when the codewords stop moving or the difference between their locations in consecutive iterations is belon a threshold. The closest codeword is typically found with a distance metric. A general form of the distance between vectors x and a codeword v , is D =
1 1 2-U J ;
= (z - U
J
P
where A is any positive definite d x d matrix. The Euclidean distance, D = llx - I/[, is a comnionly used distance metric in practice, where I is the identity niatrix. The choice of an optimality criterion is a ver portant issue in the design of a clustering algor Especially in higher dimensions, one cannot visually determine how good the resulting clusters are One approach is to check with a criterion function. The criteria, or performance indices, are often specified as a function of the memberships whose minima or maxima define “good” clustering. The algorithm then becomes a numerical procedure for finding memberships which optimize the objective function. The simplest and most widely use criterion function for clustering is the sum of squared error criterion. Bezdek [a] generalized a criterion function to account for the fuzzy membership values. The generalized mean squared error is defined by: 1 n G
J G M ~ E= -
C(.U~J V ~)’ I ~ I ~I (4 I~~ n‘
-
l j=1
where uLJis the membership of the i f h pattern to the j t h cluster, m is a weighting exponent strictly greater than one, and A is any positive definite matrix [a]. Choosing the Euclidean distance in clustering implies an isotropic feature space weighting 131. Thls isotropic assumption tends to form hyperspherical clusters. Hence, clustering using the Euclidean distance may split large or elongated clusters. It is not uncommon for data to fall naturally into hyperellipsoids in the feature space rather than in hyperspheres. CH36015-97/0000-0503$1.0001997 IEEE
clusters while maintaining the distinct shape of each cluster.
=In alternative distance metric that takes into consideration the distribution of the data is the SIahalanobis distance (SID)[l]. The AID between any input sample 2 and a codeword U , is computed by evaluating (1) where -4is the sample covariance matrix of the samples in R,. In our algorithm we propose the use of an individual covariance matrix -4, for each cluster and update -4, based on the partitioning after each iteration. The next section details the nen- approach.
After the normalization of the determinants. the
J G J J ~ distortion E has become monotonically decreasing as a function of clustering iterations. This means that now we can use the criterion function in Nahalanobis distance based algorithms to check for stopping criterion or to find the number of clusters IC as shall be discussed later.
Two ways to get an initial codebook are discussed here. The first method considers the whole data set a unique cluster and grows the codebook to the desired number of clusters, IC, by splitting. ln splitting, small perturbation vectors kc are added to every codeword. We made cL for the i f h cluster in the direction of the eigenvector corresponding to the maximum eigenvalue of -4,. This provides a systematic approach of distributing the codewords since each cluster center splits in a particular direction based on the cluster’s shape. The second approach to get an initial codebook is used when the desired codebook size is not an integer multiple of two. This method uses the Karhunen-LoBve transformation to place the initial codewords along the principal component ases of the data’s covariance matrix. For the first iteration, we use the global covariance matrix as .Izfor all the codewords. If the number of data points in any cluster is less than the dimensionality of the data, then -Az might be singular which prevents computing the inverse. Therefore, we add a matrix with small diagonal elements t o the covariance matrix to prevent the singularity.
2. WEIGHTED MAHALANOBIS DISTANCE (WMD) CLUSTERING
The idea behind the proposed method is to make each cluster attract those data points that enhance its own shape as implied by the covariance matrix of the samples Lvithin that cluster. In this algorithm, we modify the GL-4 described in the previous section such that in each iteration we assign a pattern 5 to the cluster that yields the minimum wezghted Slahalanobis distance. D , = 11-, * 112 - u l l l : , . Where IT’, is the cluster weight. In the second step, we update v L and -4,by computing the mean and the covariance matrix of the data points of each cluster based on the partitioning of the first step. The algorithm is terminated when the codewords stop moving. The introduction of the weight T I - is due t o the fact that the use of llahalanobis distance alone in clustering sometimes causes a large cluster t o attract members of neighboring clusters. This leads t o unusually large and unusually small clusters [4][5]. Looking a t the JGAISEcriterion function again and allowing -4,to be variable
it is clear that there is a need to restrict -4, somehow in order to obtain a nontrivial solution. Otherwise, the minimum of J G A ~ would ~ E be given by AF1=O, which corresponds to a huge cluster with infinite variation in all directions. One way to solve this problem is to force the determinant of all clusters to have a unity value. Therefore, we evaluate W, as
Another MD-based clustering algorithm was recently introduced by Mao and Jain[5]. They proposed a neural network architecture for hyperellipsoidal clustering (HEC). To solve the problem of unusually large or small clusters, they begin with Euclidean distance and gradually transform t o the Mahalanobis distance. In their solution they assume that these unusual clusters are generated primarily in the first few learning cycles.
3.
PERFORMANCE EVALUATION
In this section, we investigate the performance of the WMD algorithm on several data sets. Comparisons are made with the algorithms of Linde, BUZO,and Gray (LBG)[G] and the fuzzy c-means (FCM) as outlined in Bezdek[2], both of which use Euclidean distance. The performance of these algorithms on classification of the Iris flower is also studied and the important problem of estimating the optimal number of clusters is discussed.
(4) where lAzl is the determinant of A,. This choice of the constraint has the effect of normalizing the volume enclosed by the equi-Mahalanobis distance hyperellipsoid to a constant volume for all
504
3.1. Tutorial Experiments
+
-15
-15
-10
-5
+
0
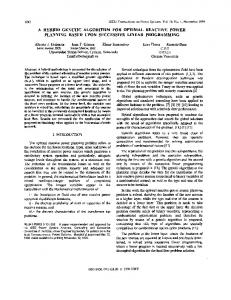
The WAID algorithm was used to cluster 2-dimensional data with three Gaussian distributed clusters. LBG divided the data into three classes as shown in Fig. l ( a ) after 20 iterations. FChI classified the data points as shown in l ( b ) in 33 iterations. The IVMD algorithm converged in 7 iterations to the clusters shown in l(c) with only 3 misclassified samples as compared to the actual distributions that generated the data. The large circles in l(a) and l ( b ) show the equi-Euclidean distance points from the cluster centers. The equi-\VhID ellipses are shown in l(c); note that they follon- the shape of the actual cluster. We can see that WMD outperforms both LBG and FCAI, and would similarly outperform any clustering technique that uses Euclidean distance. Furthermore, AIahalanobis distance degenerates to Euclidean distance for hyperspherical clusters as shown by the circular cluster in Fig. l(c).
++* 5
IO
15
Fealure 1
3.2. Detection of the number of clusters
Feature 1
Figure 1: The partitioning of two dimensional Gaussian data set into three classes using the clustering methods (a) LBG, (b) FCM, (c) WMD.
505
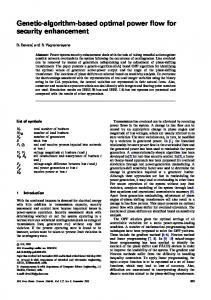
We also applied WMD t o the well-known Iris data set. This data set has four features representing three different species of the Iris flower, Setosa, Versicolor, and Virginica. Figure 3(a) shows the projection of the Iris data on the two main principal components. Note that the projection of the Iris data on the first two principal components should give us a good idea about the shape of the clusters since the third and fourth eigenvalues are very small so the variation along those eigenvectors are small. As can be seen in Table 1, after 6 iterations, LBG resulted in misclassification of 16 data points. FCM resulted in 15 patterns t o be misclassified after 12 iterations. On the other hand, WMD resulted in only five misclassification within the 150 patterns (an error of’3.3%), see Fig. 3(c). Three plants of Iris Versicolor have been classified as Iris Virginica, whereas only two plants of Iris Virginica has been attributed as Iris Versicolor. All Iris Setosa has been correctly classified. The WMD result is consistent with the results of HEC [5] but achieved with our much simpler design. The reason for this improved performance of the Mahalanobis distance-based clustering is that Iris classes are not well separated, and they do not occupy a hyperspherical shape in the feature space. These facts are easily demonstrated by Fig. 3(a). Comparing WMD with HEC, WMD eliminates the overhead of learning the network weights and does not require an upper limit on the number of iterations (100,000 was used in HEC) [5]. Furthermore, no ad hoc parameters are required for WMD. One important question in any clustering algorithm
4. CONCLUSION
Table 1: Results of clustering the Iris data into three clusters by the different clustering methods
1
I
.Algorithm LBG
FCM WNID
1
# of Errurs
I
16 15 5
Iterations 6 12 7
1
1
Uenaflous 0.58 1.53 0.81
JYMD is a simple algorithm useful with hyperellipsoidal data sets as demonstrated by synthetic and real examples. It achieves “natural” clustering with fewer iterations than the competing algorithms. Furthermore, by restricting the determinants of each cluster to unity, a monotonically decreasing criterion function is obtained which can be used to estimate the number of substructures in the data. Thus, ID provides an excellent choice for unsupervised clustering applications.
1
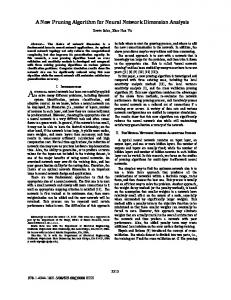
is how many underlying subgroups are present in the data set. Many algorithms start by making assumptions about the number of clusters, which is sometimes difficult due to lack of prior knowledge. Therefore, estimation of the optimal number of substructures in the data set is the crucial point here. In order t o estimate the optimum number of subgroups present in the data, the WMD algorithm uses the generalized mean squared error which is related t o the within-cluster scatter. This performance measures plotted as a function of clusters k show a clear “knee” in the curve, from which conclusions as to the optimum number of substructures of the data can be drawn. The J G ~ ~ I curve S E is shown in Fig. 2. The optimal number of the groups in the data set is given by the “knee” of J G M ~ curve E at k = 3 clusters. The results of minimum distance classification of the Iris patterns using the WMD algorithm for k=2,3,4,5, and 6, are depicted in Figures 3(b)-(f), respectively.
5 . REFERENCES
[l]-4llen Gersho and Robert XI. Gray, Vector Quantz-
zatzon and Szgnal Compresszon, Klun-er Academic Publishers, 1992. [2] J. C. Bezdek. “Self-organization and clustering algorithms.” tech. rep., Defence Technical Informa-
[3] R. 0. Duda and
tern Classzficatzon and Sons, 1973.
[4] Younis, Khaled S. Wezghted Mahalanobzs dzstance For Hyper-ellzpsozdal , Clusterzng. Master’s Thesis, The Air Force Institute of Technology, Dayton, OH, 1996. [5] J. Mao and A. K. Jain, *‘-A self-organizing network for hyperellipsoidal clustering,” IEEE Transactzons o n Neural Networks, vol. 7, pp. 16-29, Jan. 1996.
[6] Y. Linde, A. BUZO,and R. hX. Gray, ‘.‘In algorithm for vector quantizer design,” IEEE Trans. Com~ U T Z . vol. , COM-28, pp. 84-95, 1980.
BIOGRAPHIES
Figure 2: Resultant J G M ~ E for a minimum distance classification of the Iris samples using the WMD algorithm for k=2,3,4,5,and 6, respectively. 506
Captain Khaled Younis is with the Royal Jordanian Air Force. He received the BS degree in Electrical Engineering (Top Graduate) from Mu’tah University, Jordan, in 1990 and received the MS in Electrical Engineering (Distinguished Graduate) Institute of Technology, Ohio, in 1 working on his PhD degree in El at the University of Dayton with emphasis on pattern recognition, computer communication networks, and radar. His research interests are in automatic target detection for synthetic aperture radar images using neural networks, signal analysis. and fuzzy logic. He is a member of IEEE and the honor societies E t a Kappa Nu and Tau Beta Pi.
o_.ii
3-
+
+
0
r;
?
0
x
e
n
2-
c
5
I -
O m
a E I-
-g0 -
o
a'
.-.C a
.$ 0 -
E ._
z-Is
%f
0
X
2-
z-10
-
-2
O
P
x
(I)
x -3
-2 -
X
+
0
-
1;
O
0
3,: :
j
-3i
-2
-3
0
-1
1
2
3
First Principal Component
(a) 3-
3-
c 2-
c 2-
c
E
+
o
n
+
1-
-m g 0-
O m
O
.-C
r a'
.g 0 a'
2-1.
E-1-
:-
v)
0
+
-2
8 -2.
0
o
x -3
-31 -3
-2
-1
X
o
0
1
2
o
-
3
First Principal Component
0
0
CLASSI
cuss 3 cuss 4
E 2-
CLASS 5
c
0
CLASSI
X
CLASS2
+
CLASS3
.
. 0
CLASS4 CLASS5
+
.
CLASS6
0 0 '
-m
.$ 0 -
.-c
.-t
c z
-1
-
80
+
-2 -
-3
z-1-
":
0
Q, v)
c
++
v)
I
+
-2 -
X
x
-3 -3
-2
-1 0 1 2 First Principal Component
-3
3
-2
-1
0
1
2
First Principal Component
(e) Figure 3: Original and computed partitioning of Iris data using the WMD with volume constraint clustering method. (a) Original classes. (b)-(f): Resultant One-nearest neighbor classification using the codebook generated WMD with volume constraint method for 2,3,4,5, and 6 codewords, respectively.
o
-
(f)
507
3