A Parallel Coordinates Interface for Exploratory Volume Visualization Simeon Potts, Melanie Tory, Torsten Möller Graphics, Usability, and Visualization (GRUVI) lab School of Computing Science, Simon Fraser University
[email protected], {mktory, torsten}@cs.sfu.ca 1. Introduction Volume data exploration and analysis are important tasks in many vi s ua l iz a t io n d om a i ns , i nc l ud in g me d ic a l i m a gi ng a nd computational fluid flow simulations. However, these tasks can be quite challenging, because effective volume rendering interfaces have not been established. With traditional volume rendering interfaces, understanding the space of available parameters, keeping track of what you have done, and undoing operations to go back to previous states are particularly difficult operations. Parallel coordinates [Inselberg, 1990] is a graphing technique for multi-dimensional data points that is used for finding correlations and other interesting features in a set of observations. A parallel coordinates graph consists of one vertical axis per variable, with data points plotted as a series of line segments connecting the values of the individual components together. We apply the parallel coordinates layout to the parameter space used for volumetric rendering, where the variables include camera orientation, transfer functions for colour and opacity, zoom and translation of the view, a volumetric data file, and a rendering technique. Many other parameters are possible, and are only limited by what the chosen set of rendering techniques supports. Cutting plane position and orientation, light placement, and shading coefficients are a few additional examples. By organizing visualization parameters in a parallel coordinates layout, all parameters are explicitly represented to clearly illustrate the space of available options for volume rendering.
Fig. 1. Instances of the various parameters are placed as consecutive nodes on the axis designated for them. Nodes can be connected together to form a set of rendering parameters by dragging the mouse across the axes, or optionally by clicking individually on the nodes. The resultant image is placed in the history view (scrollable blue pane in Fig. 1) and visually connected to the parameters with a line (coloured polylines in Fig. 1). Particularly interesting images can be copied to a favourites view (scrollable green pane in Fig. 1). In the interface, additional windows are used for the parameter editors, for a trash browser, for larger high-resolution renderings, and for spreadsheet-like tables of images similar to [Jankun-Kelly and Ma, 2001]. These additional windows are illustrated in Figures 2 and 3.
1
3
4
2
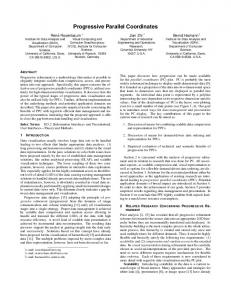
Figure 2: Some auxiliary windows used in our interface. 1. Colour and opacity transfer function editors. 2. Zoom and translation editors. The editor on the right has a checkbox selected to make it interactive, updating the image as the user drags the mouse to zoom and translate the view. 3. A trash browser window. 4. A larger rendering window that allows the user to save a PPM image.
Figure 1: Diagram of our parallel coordinates interface, illustrating how different rendering techniques might be compared.
2. The Parallel Coordinates Interface We have developed an application that uses parallel coordinates as an interface for volume rendering. Our interface is illustrated in
We included features that we believe make parallel coordinates a powerful tool for visualization. The axes can be re-arranged into any order, and nodes on the axes can be moved by the user into any desired position. Axes are equipped with scroll bars to handle large numbers of nodes and a trash container to manage discarded nodes. The history view allows a user to go back to any previous set of parameters, which they can continue exploration from. In the parallel coordinates view, a user can drag the polyline from one node to another on the same axis to create a parameter set identical to the original one except for one parameter value, enabling them to see and compare the effect of the change on the rendered image. In the same way, a particular set of parameters can easily be applied to an entire set of data files, or a set of parameters can be rendered by several different renderers. Additionally, we have
included a version of the spreadsheet interface described by Jankun-Kelly and Ma in [Jankun-Kelly, 2001], implementing the same basic features (however, we did not include a scripting language or session management). This tabular layout tool is an extension to our interface and is illustrated in Fig. 3. Finally, the set-up of nodes and the history can be saved and re-created in a later session. In this way, the interface can be used as a teaching tool, where an expert user can construct an ideal set of parameters for a particular application and / or record an efficient exploration of a data set for others to examine and learn from.
changing parameters. The tabular layout feature was considered a useful addition for image comparisons. We would like to extend our interface to include a broader parameter space made possible through rendering tools such as VTK [Schroeder, 1998], or through renderers that can render timevarying or multi-modal data (data that includes multiple time steps or overlapping measurements).
4. Acknowledgements Funding for this project was provided by NSERC and the British Columbia Advanced Systems Institute (BC ASI). Renderings were produced by vuVolume, a rendering suite developed in the Graphics, Usability and Visualization (GrUVi) lab at Simon Fraser University. We would like to thank T.J. Jankun-Kelly and KwanLiu Ma for providing us with source code for their Spreadsheet interface, which provided the basis of our original discussions.
References
2
3
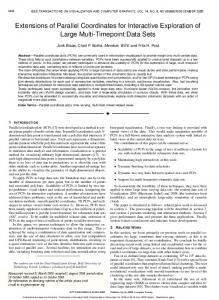
1 Figure 3: Diagram of a table. 1. Checkboxes determine an axis to be used for the rows and for the columns of the table, and a new table is created with a button press. 2. The table after clicking a render button, displaying all the possible combinations of colour and opacity transfer functions from the row and column axes. 3. The user added a thumbnail of the table and the image from the first row, second column of the table to the history.
3. Results and Implications to Visualization The parallel coordinates layout facilitates operations that could otherwise be quite difficult. Understanding the space of possible parameters requires only a simple glance at the parallel axes. Similarly, users can glance at a polyline to easily understand the set of parameters that produced a particular image. Keeping track of what combinations have been tried and going back to previous states is possible by scrolling through the history bar. Finally, effects of parameters (e.g., different transfer functions, rendering techniques, or data sets) can be compared side-by-side in the history bar, favorites bar, or within a table. The parallel coordinates interface we have described here can be applied to scientific visualization tasks across many domains. We envision a broad impact of this tool on research that relies on the visualization of large or complex data sets. A user evaluation comparing the parallel coordinates interface to a spreadsheet-style interface and to a more traditional interface for volume rendering was carried out. (For a detailed discussion of the parallel coordinates interface and user study results, see [Potts et al., 2003]). Results of the evaluation suggest that the parallel coordinates interface offered the best understanding of the parameter space available to volume rendering of the three interfaces, and was generally the easiest interface to use for
INSELBERG, A., DIMSDALE, B. 1990. Parallel coordinates: A tool for visualizing multidimensional geometry. Proc. IEEE Visualization, 361378 JANKUN-KELLY, T.J., M A, K. 2001. Visualization exploration and encapsulation via a spreadsheet-like Interface. IEEE Transactions on Visualization and Computer Graphics, 7, 3, 275-287. POTTS, S., TORY, M., M ÖLLER, T. 2003. A Parallel Coordinates Interface for Exploratory Volume Visualization. Technical Report, School of Computing Science, Simon Fraser University, (SFU-CMPT-08/03TR2003-05), August 2003. SCHROEDER W., MARTIN K., LORENSEN W. 1998. The Visualization Toolkit, 2nd ed. Prentice Hall PTR: New Jersey.