This chapter has reviewed the numerical studies of the performance two green features used in buildings. For the performance of windcatcher, the air flow rate ...
8 Application of Computational Fluid Dynamics to the Study of Designed Green Features for Sustainable Buildings Cheuk Ming Mak
Department of Building Services Engineering, The Hong Kong Polytechnic University Hong Kong, China 1. Introduction Continuing urbanisation has implications on preservation of our common resources and has caused global and mirco-environmental pollution. It affects our public health and causes damage to the prospects of future generations. Although the timely provision of resources and environmental mitigation measures could resolve some of the issues, others may require fundamental reconsiderations of the implications on long-term sustainability. The understanding of the benefits of sustainability development in urbanisation and its implementation in the practice of building design is of importance for the long-term sustainability of a city. Natural ventilation is increasingly being used in modern urbanised residential buildings to minimise the consumption of non-renewable energy and the reliance on active means for environmental control. Increased consciousness of the environmental problems has aroused people’s interest of sustainable urbanisation, especially the application of green features in buildings. Green features are architectural features used to mitigate migration of various airborne pollutants and to moderate the transport of heat, air and transmission of daylight from outside to indoor environment in an advantageous way [Mak et al., 2005a]. Green features such as a windcatcher [Li & Mak, 2007], wing walls [Mak et al., 2005a; Mak et al., 2007], skygardens [Niu et al., 2005] and balconies have made use of natural ventilation in residential buildings for increasing ventilation rate. However, the ventilation performance of these green features is not fully understood. In recent years, Computational Fluid Dynamics (CFD) has been widely used to study building airflow and the indoor environment, as well as the wind environment. An overview of applications in ventilation [Chen, 2009] has indicated that the CFD models were a most popular tool used to predict ventilation performance of buildings. CFD can be used to perform combined simulation of the wind environment around the buildings and the airflow inside the buildings [Awbi, 1989; Chen & Srebric, 2000; Chow, 1996; Jones & Whittle, 1992; Niu & Kooi, 1992] and modelling of different green features to study their ventilation performance since it can provide detailed airflow velocity distribution and thermal conditions. For most applications of ventilation and turbulence flow, the results have been approved to be useful and reasonably accurate. CFD has therefore become a reliable tool for flow analysis in buildings. It is believed that natural ventilation in buildings can be Source: Computational Fluid Dynamics, Book edited by: Hyoung Woo OH, ISBN 978-953-7619-59-6, pp. 420, January 2010, INTECH, Croatia, downloaded from SCIYO.COM
174
Computational Fluid Dynamics
enhanced through the incorporation of appropriate green features in sustainable development such that there is a potential saving in non-renewable energy consumption in buildings. A commercial CFD package FLUENT has been applied to various research works and found to be useful [Bojic et al., 2001; Mak et al., 2005b; Mak & Oldham, 1998a; Mak & Oldham, 1998b; Mak & Yik Francis, 2002; Niu et al., 2005]. FLUENT has been adopted by the author and his research partners [Li & Mak, 2007, ; Li et al., 2006; Mak et al., 2007] to study the performance of two designed green features including windcathcer and wing walls used for sustainable buildings. This chapter will introduce the numerical simulation of these two green features. The CFD numerical technique used including geometry, numerical grids, boundary conditions and turbulence models will be discussed. The ventilation performance of these green features in buildings will be discussed. Other CFD applications in building services engineering such as prediction of flow-generated noise using CFD will also be briefly introduced.
2. Study of green features for sustainable buildings using CFD 2.1 Windcatcher 2.1.1 Description of the windcatcher The windcatcher system is one of the green features for providing good natural ventilation. In the modern design of windcatchers, the principles of wind effect and passive stack effect are considered in the design of the stack that is divided into two halves or four quadrants/segments with the division running the full length of the stack [Awbi & Elmualim, 2002]. The windcatcher systems were employed in buildings in the Middle East for more than three thousands years. They have different names in different parts of region [Bahadori, 1994; Elmualim et al., 2001; McCarthy, 1999]. Although more and more windcatcher systems have been applied into recent commercial buildings and residential buildings such as the Queen’s Buildings at Demonfort University and the BRE office of the future [Hurdle, 2001; McCarthy, 1999; Swainson, 1997], their performance has not been fully evaluated under different climates. The experimental studies of windcatcher systems for all different cases are obviously costly and impossible. The assessment of the performance of windcatcher systems using CFD is very important for both design and improvement of the systems. Three-dimensional models of a windcatcher system have therefore been built and their performance under different wind speeds and flow directions has been studied and compared [Li & Mak, 2007]. The buildings with only one window opening usually have poor ventilation because it is difficult for wind to change its direction to enter to the interiors of the buildings, especially when the window opening is small. The windcatcher is designed for solving this problem (as shown in Figure 1 (a) and (b)). It can change the direction of wind and channel the fresh air into rooms (as shown in Figure 2). Generally, the windcatchers are installed on the roof of a building in order to increase the outdoor-indoor pressure gradient and velocity gradient, and to provide more fresh air into rooms. In order to induce more air into the interiors when the wind direction varies, the stack of the windcatcher is usually divided into two halves or four segments. A numerical modelling of the windcatcher will be discussed in the following section.
Application of Computational Fluid Dynamics to the Study of Designed Green Features for Sustainable Buildings
(a)
175
(b)
Fig. 1. Comparison of different ventilated rooms (a) Rooms without windcatcher (b) Rooms with windcatcher
Fig. 2. The structure and principle of the windcatcher system 2.1.2 Numerical simulation of the windcatcher 2.1.2.1 Geometry It can be seen in Figure 3 that a three dimensional square windcatcher model of dimension 500mm x 500mm and length of 1.0m connected to a room has been created when the wind speed varies in the range of 0.5-6m/s. The overall numerical domain size is 3.6×3.6×2m (as shown in Figure 3). In order to show the influence of the wind direction, three additional models with the incident angle α varying from 0˚ to 45˚ with an interval of 15˚ shown in Figure 4 (a), (b), (c) and (d) have been created. At the wind direction of 0˚, the performances of the windcatcher under different wind speeds v of 0.5, 1, 2, 3, 4, 5 and 6m/s were investigated. Moreover, the flow rate of air entering the room through the windcatcher under different wind directions and different wind speeds is investigated.
176
Computational Fluid Dynamics
Fig. 3. The 3D model of windcatcher
Fig. 4. Plan of the models under different wind direction 2.1.2.2 Numerical grids, turbulence model and boundary conditions The accuracy of CFD simulation is affected by numerical schemes, turbulence model, and boundary conditions used etc. [Marakami, 2002]. It is important to set reasonable boundary and initial parameters. Since the air flow velocity in and around the windcatcher is much lower than sound velocity, the flow can be considered as incompressible and the density of air is assumed to be constant. The wind speed was specified at the inlet and wind friction along the wall is calculated using the standard wall function. S1 shown in Figure 3 was assumed to be the natural wind source and was set to be the wind velocity inlet. The turbulence intensity and the viscosity ratio of this inlet are set to be 3 and 10 respectively. S6 was assumed to be the
Application of Computational Fluid Dynamics to the Study of Designed Green Features for Sustainable Buildings
177
outlet of wind and was set to be the pressure outlet. S2, S3, S4 and S5 are the connection of the square windcatcher to the room. In the cases shown as Figure 4 (a), (b) and (c), S2 was set to be pressure outlet and others pressure inlet while in case shown as Figure (d), S2 and S3 are both set to be pressure outlet and the other two pressure inlet. The boundary conditions are based on the experiments of Awbi and Elmualim [Awbi & Elmualim, 2002]. The standard (twoequation) k-ε turbulence model was adopted. Although this turbulence model inevitably introduces some errors [Murakami, 1997], it has been chosen because the overall trend of airflow parameters such as pressure and air velocity can be reasonably predicted [Bojic et al., 2001; Mak & Oldham, 1998a; Mak & Oldham, 1998b; Murakami, 1997; Niu & Zhu, 2004]. The total number of grids in all simulation models is all around 50,000 and the maximum and minimum grid volume is about 2.7×10⁻⁴m3 and 3.2×10⁻⁷m3 respectively. Unstructured grid was used for all simulation models (as shown in Figure 5).
Fig. 5. Grid information of the model (cross-section) 2.1.3 Results and analysis 2.1.3.1 Verification of the simulation result The numerical results are compared with the published experiment results of Awbi and Elmualim [Awbi & Elmualim, 2002]. Figure 6(a), (b), (c) and (d) show that the airflow rate Q
3
Q (m /s)
0.20 0.18 0.16
simulation experiment
0.14 0.12 0.10 0.08 0.06 0.04 0.02 0.00 0
(a)
1
2
3
v (m/s)
4
5
6
178
Computational Fluid Dynamics 0.30
simulation experiment
0.25
3
Q (m /s)
0.20 0.15 0.10 0.05 0.00 0
1
2
3
4
5
6
3
4
5
6
3
4
5
6
v (m/s)
(b) 0.18 0.16
simulation experiment
3
Q (m /s)
0.14 0.12 0.10 0.08 0.06 0.04 0.02 0.00 0
1
2
v (m/s)
(c) 0.30
simulation experiment
3
Q (m /s)
0.25 0.20 0.15 0.10 0.05 0.00 0
1
2
v (m/s)
(d) Fig. 6. Comparison of simulation and experiment results (a) α = 0º (b) α =15º (c) α = 30º (d) α = 45º v=external wind speed
Application of Computational Fluid Dynamics to the Study of Designed Green Features for Sustainable Buildings
179
entering into the test room though S2 at the wind incidence angle of 0º, 15º, 30º and 45º respectively. It can be seen that the simulation results have a good agreement with the experimental results and similar trend have been obtained for the other cases. The percentage of error between the simulation results and the experiments is in the range of 5% and 30%. 2.1.3.2 Function of the windcatcher quadrants The windcatcher has been divided into four quadrants in order to induce wind from all directions and one or two quadrants will be the air inlet of the test room while others being the outlet. To figure out the specific function of each quadrant is essential for the calculation of indoor air flow rate and the control of windcatcher system. Since it is impossible to conduct experiment to obtain velocity and pressure at every point by velocity or pressure sensors on each quadrant. CFD tool is adopted here. The velocity distribution on the cross-section of four quadrants at the wind incidence angle of 0º, 15º, 30º and 45º is shown in Figure 7. It demonstrates that when the incidence angle α = 0º and 15º, only the windward side S2 acts as the air supply quadrant of the test room, but when α = 30º and 45º, both S2 and S5 take the responsibility of inducing wind into room as well as exhausting the indoor air out. A few of short circling flow has been observed and its influence will be studied in future work. The flow of S5 is therefore taken into consideration when calculating the indoor flow rate of 30º and 45º.
(a)
180
(b)
(c)
Computational Fluid Dynamics
Application of Computational Fluid Dynamics to the Study of Designed Green Features for Sustainable Buildings
181
(d) Fig. 7. Velocity distribution on the cross-section of four quadrants (a) α = 0º (b) α =15º (c) α = 30º (d) α = 45º 2.1.3.3 Performance of the windcatcher under different wind speed The calculated air flow rate of supply air inlet under different wind incidence angle α of 0º, 15º, 30º and 45º was found to increase with the external wind speed (as shown in Figure 8). At an angle of 0˚ the ventilation rates are generally lower than for the other three cases and at the angle of 45˚ the ventilation rate increases more quickly than other cases with the external wind speed. At α = 0º, a volumetric airflow of 0.093m3/s was achieved through the main supply quadrant for an average wind velocity of 3m/s and a maximum value of 0.30 a=0° a=30°
0.25
a=15° a=45°
3
Q (m /s)
0.20 0.15 0.10 0.05 0.00 0
1
2
3 v (m/s)
4
5
Fig. 8. The variation of ventilation rate with v external wind speed
6
182
Computational Fluid Dynamics
Fig. 9. Positions of x1 7.00
v=1m/s v=4m/s
6.00
v=3m/s v=6m/s
vs (m/s)
5.00 4.00 3.00 2.00 1.00 0.00 0.05
0.1
0.15
x1(m)
0.2
0.25
0.3
(a) 6.00 v=1m/s
5.00
v=3m/s
v=4m/s
v=6m/s
0.25
0.3 z1(m)
0.35
vs (m/s)
4.00 3.00 2.00 1.00 0.00 0.15
0.2
0.4
0.45
(b) Fig. 10. The variation of air velocity when α=0˚ (a) along with x1 (b) along with z1 vs=velocity of air supply into room, v=external wind speed 0.185m3/s for the external wind speed of 6m/s. At α = 45º, the maximum volumetric airflow rate reaches 0.282m3/s when there are two air supply quadrants. Since the volume
Application of Computational Fluid Dynamics to the Study of Designed Green Features for Sustainable Buildings
183
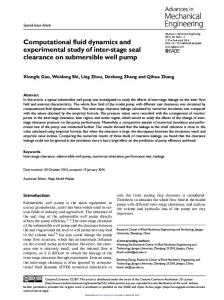
of the test room is 15.25m3, the maximum indoor air exchange rate (ACH) is about 70 and thus can keep indoor air at a healthy level in most cases. Figure 10 (a) and (b) show the variation of wind speed along with x1 and z1 respectively when the wind incidence angle is 0˚. x1 and z1 are both in the center of the supply air inlet (as show in Figure 9). It can be seen from the figures that when the wind incidence angle is 0˚, the maximum wind speed induced into text room is close to the external wind velocity. It demonstrates that it is an effective way to induce natural fresh air into room by using a windcatcher system. 2.1.3.4 Performance of the windcatcher under different wind direction It seems that the volumetric airflow rate increases with the external wind incidence angle (shown as Figure 8), but different result has been obtained by investigating three additional models under the wind incidence angle of 10º, 25º and 40º. The variation of ventilation rate with the wind direction when the external wind velocity v=3m/s is shown in Figure 11 and it demonstrates that airflow rate increases with the incidence angle only in the range of 10º~40º and when α is smaller than 10º or larger than 40º, the trend becomes opposite. Similar results have been observed in other cases. The installation angle of windcatcher should therefore be adjusted in order to operate better in different regions. 0.15 0.14
3
Q (m /s)
0.13 0.12 0.11 0.10 0.09 0.08 0.07 0
5
10
15
20
α (º)
25
30
35
40
45
Fig. 11. The variation of ventilation rate with the wind direction 2.1.3.5 Uniformity of supply air inlet The variance of airflow velocity into text room is used here to compare the uniformity of supply air inlet. It is defined as: D (vs ) = E{[vs − E (vs )]2 }
(1)
where E(vs) is the mathematical expectation of the supply air velocity vs and the value of vs is obtained from random points at the line x1 and z1, see Figure 9. When D(vs) increases, the uniformity of supply air becomes worse. The results at wind velocities from 0.5 to 6m/s and wind angle of 0º and the results at wind angles from 0º to 45º and wind angle of 3m/s are shown in Figure 12(a) and (b) respectively. From these figures, it can be seen that the uniformity of supply air inlet decreases with the
184
Computational Fluid Dynamics
D(vs)
external wind velocity and increases with incidence angle. Therefore, in the application of the windcatcher system, diffusers should be installed at the inlet entering the text room in order to keep the occupants comfortable. 10.0 9.0 8.0 7.0 6.0 5.0 4.0 3.0 2.0 1.0 0.0 0
1
2
3
4
a(º)
30
v (m/s)
5
6
(a) 0.565 0.560 0.555
D(vs)
0.550 0.545 0.540 0.535 0.530 0.525 0.520 0.515 0
15
45
(b) Fig. 12. The variance of air flow velocity of the air entering into the text room against external wind speeds and wind directions 2.2 Wing walls 2.2.1 Description of the wing walls There is a growing consciousness of the environmental performance of buildings. The use of green features in building design not only improves the environmental quality, but also reduces the consumption of non-renewable energy used in active control of indoor environment. Larger window openings in the walls of a building may provide better natural ventilation. However, it also increases the penetration of direct solar radiation into indoor environment. The use of wing wall as shown in Figure 13 is an alternative to create effective natural ventilation. Figure 13 shows the provision of wing wall in a building façade vertically between two openings. Natural ventilation is considered to be an effective passive cooling strategy in building design. In 1962 and 1968, Givoni [Givoni, 1962; Givoni, 1968] conducted experiments on room models with and without wing walls in a wind tunnel so as to study its effect on natural ventilation. He found that single-sided ventilation incorporated
Application of Computational Fluid Dynamics to the Study of Designed Green Features for Sustainable Buildings
185
with wing walls could greatly improve the internal air circulation compared with that without wing walls. Maximizing the utilization of natural ventilation therefore not only minimize the reliance on active means for environmental control, but also reduces the consumption of non-renewable energy.
Fig. 13. Physical configuration of wing walls 2.2.2 Experiments of Givoni The experiments of Givoni [Givoni, 1962; Givoni, 1968] were conducted to study air flow through room models with and without wing walls in a wind tunnel. Figure 14 and Figure 15 show the plan and side elevation of the open-throat type wind tunnel respectively. It consists of an intake section, a working section, a distribution control section, a transit section, a fan and an exit. It can be seen in Figure 14 and Figure 15 that the intake opening has a cross section of 1.8 x 1.1m(H) and contracts to a cross section of 1.5 x 0.8m(H), over a length of 0.9m. The working section is 2.22x1.2m(H). The distribution control section contracts in cross section from 1.5x0.8m(H) to 0.8x0.6m(H) and contains five vertical louvers whose angle can be adjusted so as to regulate flow distribution. The transit sections are used for connecting the rectangular and circular section. The room model of dimension of 0.65x0.65x0.5m(H) with a centered window opening shown in Figure 14 and Figure 15 with dashed lines was located at the center of the wind tunnel. The window opening with dimension of 1/3 of that of the wall was created at the center of the wall of the room model facing the air flow.
Fig. 14. Plan elevation of the wind tunnel experiments
186
Computational Fluid Dynamics
Fig. 15. Side elevation of the wind tunnel experiments The wind tunnel was then tested with different uniform air (wind) flow velocities ranging from 1.27m/s to 3.35m/s. Different wind directions were tested with the angle of air flow incidence ranging from 0o (opening facing the air flow) to 135o with 22.5o increment. The average internal velocity based on five measurement points inside the room model was expressed in percentage based the inlet uniform air flow velocity (wind speed). 2.2.3 Numerical simulation of the wing walls 2.2.3.1 Geometry There are three major parts in the FLUENT CFD code. They are: i) pre-processor, ii) solver and iii) post-processor. The pre-processor GAMBIT was applied to create 3-dimensional physical room models that are based on the experiments of Givoni. Figure 16 shows the geometry of the 3-dimensional computational domain where the room model of 0.65m x 0.65m x height 0.5m is located inside the computational domain. There are two lateral openings in the room model (Case 1). The wind angle is 0° when the lateral openings on the wall are facing the wind and their normal is in parallel to the wind as shown in Figure 16.
Fig. 16. Physical model for computer simulation
Application of Computational Fluid Dynamics to the Study of Designed Green Features for Sustainable Buildings
187
2.2.3.2 Numerical grids, discretization scheme, turbulence model and boundary conditions The FLUENT CFD package is used here in modeling the natural ventilation by solving the conservation equations for mass, momentum and energy using the finite volume method. A simple standard (two-equation) k-ε turbulence model was used though it was inevitable to introduce some errors [Murakami, 1997]. The number of uniform structured grids for the 3dimensional simulation is around 60000 – 68000 while the number of grids for the 2dimensional simulation is around 12700. The first-order upwind discretization scheme was used. All CFD results have been checked against energy conservation. Figure 17 shows the grids of the simulated model. Figure 18 shows the model configurations for all cases at different wind angles. Table 1 and Figure 18 show the different inlet uniform wind speeds and wind angles for all cases respectively.
Fig. 17. Grids of the simulation model
Fig. 18. Different wind angles Different inlet mean wind speeds (m/s) 1.27 1.68 1.83 2.0 2.95 3.35 Table 1. Different inlet mean wind speeds
188
Computational Fluid Dynamics
The descriptions of all three cases for the 2-dimensional and 3-dimesional CFD simulation and the wind tunnel experiments of Givoni are shown in Figure 19 and as follows: Case 1: Two lateral openings, with total 1/3 width of wall, no vertical projections (wing wall) Case 2: Two lateral openings, with total 1/3 width of wall and vertical projections (wing wall) of depth equal to the opening width Case 3: Two lateral openings, with total 1/3 width of wall and vertical projections (wing wall) of depth double the opening width
Different wind angles (0°, 22.5°, 45°, 67.5° and 135° for all three cases)
Fig. 19. Model configuration at different wind directions Figure 20 shows the physical configuration of the room model for the three cases.
(a) Case 1: Two lateral openings, with 1/3width of wall, no vertical projections
Application of Computational Fluid Dynamics to the Study of Designed Green Features for Sustainable Buildings
189
(b) Case 2: Two lateral openings, with 1/3 width of wall and vertical projections (wing walls) of depth equal to the opening width
(c) Case 3: Two lateral openings, with 1/3 width of wall and vertical projections (wing walls) of depth double the opening width Fig. 20. Physical configuration of the room model for three cases 2.2.4 Analysis of results 2.2.4.1 Effect of input turbulence on the CFD results It is known the approaching turbulence levels would impact the curvature of separation on a bluff body and as a result affect the mean pressure data derived [Melbourne, 1979]. However, there is no information provided regarding the input turbulence levels used in the
190
Computational Fluid Dynamics
experiments of Givoni [Givoni, 1962; Givoni, 1968]. As the wind tunnel experiments of Givoni were conducted at low-turbulence, different low input turbulence parameters including turbulence intensity and turbulence viscosity ratio were used in the threedimensional simulation models shown in Table 2. It was found in Figure 21 that the variation in the incoming turbulence did not have much effect on CFD result, i.e. the mean indoor air speed relative to the uniform wind speed. In the CFD results, the mean indoor air speed could be based on all grid point values inside the room at a particular uniform wind speed while that in the experiments of Givoni [Givoni, 1962; Givoni, 1968] was only based on five selected measurement points inside the room. Set
Turbulence Intensity/%
Turbulence Viscosity ratio
A
10
10
B
10
1
C
1
1
D
1
0.1
E
1
0.01
F
1
0.001
G
0.1
0.001
Table 2. Different input turbulence parameters
% of indoor air speed to wind speed
18
Givoni A B C D E F
16 14 12 10 8 6 4 2 0 0
20
40
60
80
100
120
140
160
Wind angle (o)
Fig. 21. Effect of different turbulence input parameters on CFD results 2.2.4.2 Effect of wing wall It can be seen in Figure 22 and Figure 23 that the wing wall increases the air circulation in and out of the two lateral openings of the room model. Figure 24 and Figure 25 show that the wing wall increases the pressure difference between the two lateral openings. Figures 26-29 show the CFD results for the models and the experimental results of Givoni. Givoni
Application of Computational Fluid Dynamics to the Study of Designed Green Features for Sustainable Buildings
191
[Givoni, 1962; Givoni, 1968] found that the percentage of mean indoor air speed to uniform wind speed remained almost constant as the uniform wind speed varied from 1.27ms-1 to 3.35 ms-1. This percentage and the air change per hour in the CFD results were obtained by taking average all values at different wind speeds listed in Table 1. It can be seen in Figure 26 that the percentage of mean indoor air speed inside the room to the uniform wind speed is increased by the incorporation of wing wall on the wall facing the wind. Significant improvement of natural ventilation is obtained in the cases with wing wall (i.e. case 2 and 3) in both experimental results and CFD results. The increase in the mean indoor velocity in two cases with wing wall can be reached up to few times compared with those without wing wall. However, it can be seen in Figure 26 that there is no significant improvement of natural ventilation for a longer wing wall (Case 3) is used.
Fig. 22. Plan view of velocity vector diagram for the room model without wing wall at wind angle of 45o and wind speed of 1.25m/s
Fig. 23. Plan view of velocity vector diagram for the room model with wing wall at wind angle of 45o and wind speed of 1.25m/s
192
Computational Fluid Dynamics
Fig. 24. Plan view of pressure contour of the room model without wing wall at wind angle of 45o and wind speed of 1.25m/s
Fig. 25. Plan view of pressure contour of the room model with wing wall at wind angle of 45o and wind speed of 1.25m/s
Application of Computational Fluid Dynamics to the Study of Designed Green Features for Sustainable Buildings
193
% of indoor air speed to wind speed
25 Case 1 20
Case 2 Case 3
15 10 5 0 0
20
40
60
80
Wind angle (o)
100
120
140
160
Fig. 26. Percentage of mean indoor air speed to wind speed against wind angle ranging 0° and 135° (CFD results for three cases)
Air change per hour
500 450
Case 1
400
Case 2
350
Case 3
300 250 200 150 100 50 0 0
20
40
60
80 100 o Wind angle ( )
120
140
160
Fig. 27. Ventilation rate (in m3/s) against wind angle ranging 0° and 135° (CFD results for three cases) 2.2.4.3 Performance of wing wall under different wind directions In order to compare the CFD results with the experiments of Givoni, the percentage of mean indoor air speed to uniform wind speed was used in Figures 26, 28-30. Air change per hour was also used in Figure 27 since it is a common indicator of ventilation. It can be seen in Figure 26 and Figure 27 that there are large variations of the percentage of mean indoor air speed to wind speed and the air change per hour in case 2 and case 3 under different wind directions (i.e. wing angle ranging 0° and 135°). Highest values of the percentage of mean indoor air speed to wind speed and the ventilation rate occur at around 45°. That means although wing wall can increase the air change per hour and the mean indoor air velocity that would promote natural ventilation, its performance is greatly affected by the wind directions. Figures 26-30 all show that the wing wall has its best performance at wind angle of around 45o.
194
Computational Fluid Dynamics
2.2.4.4 Comparison of CFD results and the experiments of Givoni Figures 28-30 show the comparisons between CFD results and wind tunnel experiments of Givoni [Givoni, 1962; Givoni, 1968] for cases 1-3. There is no wing wall in Case 1. Case 3 has a longer wing wall than Case 2. It can be seen in the figures that the CFD results generally have similar trend to the experimental results of Givoni. The deviations may be due to the limitations of the CFD code in terms of algorithm used for the computer iterations, grid topologies, physical parameters used and turbulence models, and the measurement methods used in the experiments. Givoni [Givoni, 1962; Givoni, 1968] found that the internal velocity distribution inside the room was quite constant at the wind angle of 45° and wind speed of 1.25m/s to 3.3m/s and the mean indoor air speed was obtained by averaging speeds measured at only 5 measurement points. However, there are larger variations of internal velocity distribution in the simulation and the mean indoor air speed in the CFD results was obtained by averaging speeds at all grid points inside the rooms.
% of indoor air speed to wind speed
18 16
CFD simulation Givoni
14 12 10 8 6 4 2 0 0
20
40
60
80 100 o Wind angle( )
120
140
160
Fig. 28. Percentage of mean indoor air speed to wind speed against wind angle ranging 0° and 135° (Case 1-comparison between CFD results and the experiments of Givoni)
% of indoor air speed to wind speed
40 35
CFD simulation Givoni
30 25 20 15 10 5 0 0
20
40
60
80
100
120
140
160
o
Wind angle ( )
Fig. 29. Percentage of mean indoor air speed to wind speed against wind angle ranging 0° and 135° (Case 2-comparison between CFD results and the experiments of Givoni)
% of indoor air speed to wind speed
Application of Computational Fluid Dynamics to the Study of Designed Green Features for Sustainable Buildings
195
40 CFD simulation Givoni
35 30 25 20 15 10 5 0 0
20
40
60
80 100 Wind angle (o)
120
140
160
Fig. 30. Percentage of mean indoor air speed to wind speed against wind angle ranging 0° and 135° (Case 3-comparison between CFD results and the experiments of Givoni)
3. Other CFD applications in building services engineering (BSE) CFD has been applied successfully to various research works in BSE [Chow, 1996] including fire engineering, smoke movement, sprinkler and hot air interaction, combustion, heating, ventilation and air-conditioning design, air-conditioned gymnasium and air-conditioned office. CFD has also been attempted to modify the predictive method of Mak et al. [Mak, 2002; Mak, 2005; Mak et al., 2009; Mak & Yang, 2000; Mak & Yang, 2002] to produce a turbulence-based predictive for flow-generated noise produced by an in-duct element in a ventilation system [Mak & Au, 2009; Mak & Oldham, 1998a; Mak & Oldham, 1998b].
4. Conclusions This chapter has reviewed the numerical studies of the performance two green features used in buildings. For the performance of windcatcher, the air flow rate increases with wind speed and wind direction when incidence angle varies from 10º to 40º and slightly decreases when incidence angle is smaller than 10º or lager than 40º. In all cases studied, the velocity of the supply air entering into the text room is close to the external wind speed and therefore the windcatcher system is found to be an efficient way of improving indoor ventilation. For the performance of wing walls, wing wall can promote natural ventilation by increasing the air change per hour and the mean indoor air speed relative to wind speed at various wind speeds and wind directions. The best performance is at the wind angle of around 45°. The numerical studies agree generally with the experiments of Givoni and show that wing wall can perform very well in single-sided ventilation for this type of room configurations. In summary, the numerical studies have shown that the windcatcher and the wing walls can increase the performance of natural ventilation in buildings. CFD is therefore a useful tool in studying the performance of green features used in buildings.
196
Computational Fluid Dynamics
5. Acknowledgements The writing of this chapter was fully supported by a grant from the Fcaulty of Constuction and Land Use of the Hong Kong Polytechnic University (Sustainable Urbanization Research Fund, Project No. 1-ZV4S).
6. References Awbi, H.B. (1989). Application of computational fluid dynamics in room ventilation. Building and Environment, Vol. 24, No. 1, pp. 73-84 Awbi, H.B. & Elmualim, A.A. (2002). Full scale model windcatcher performance evaluation using a wind tunnel, Proceedings of the World Renewable Energy Congress VII, 2002 Bahadori, M.N. (1994). Viability of wind towers in achieving summer comfort in the hot arid regions of the Middle-East. Renewable Energy, Vol. 5, pp. 879-892 Bojic, M.; Lee, M. & Yik, F. (2001). Influence of a depth of a recessed space to flow due to airconditioner heat rejection. Energy and Buildings, Vol. 34, No.1, pp. 33-43 Chen, Q. (2009). Ventilation performance prediction for buildings: A method overview and recent applications. Building and Environment, Vol. 44, pp. 848-858 Chen, Q. & Srebric, J. (2000). Application of CFD tools for indoor and outdoor environment designs. International Journal on Architectural Science, Vol. 1, pp. 14-29 Chow, W.K. (1996). Application of computational fluid dynamics in building services engineering. Building and Environment, Vol. 31, pp. 425-36 Elmualim, A.A.; Awib, H.B.; Teekaram, A.J. & Brown, R.G. (2001). Evaluating the Performance of a Windcatcher System Using Wind Tunnel Testing, Proceedings of 22nd Annual AIVC Conference, Vol. 1, pp. 29.1-29.12, Bath, UK, 11-14 September 2001, Air Infilteration and Ventilation Centre, INIVEEIG, Belguim Givoni, B. (1962). Basic study of Ventilation problems in housing in hot countries. Research Report to the Ford Foundation, Building Research Station, Israel Institute of Technology, Technion, Haifa, Israel Givoni, B. (1968). Ventilation problems in hot countries. Research Report to the Ford Foundation, Building Research Station, Israel Institute of Technology, Technion, Haifa, Israel Hurdle, A. (2001). Is natural ventilation the new wind of change?. Building Services and Environmental Engineers, Vol. 24, No. 7, pp. 26-7 Jones, P.J. & Whittle, G.E. (1992). Computational fluid dynamics for building air flow prediction-current status and capabilities. Building and Environment, Vol. 27, No. 3, pp. 321-38 Li, L. & Mak, C.M. (2007). The assessment of the performance of a windcatcher system using computational fluid dynamics. Building and environment, Vol. 42, pp. 1135-41 Li, L.; Mak, C.M & You, S.J. (2006). A numerical study of the performance of a windcatcher system. Proceedings of Sichuan-Hong Kong Joint Symposium, pp. 34-43, Chengdu, Sichuan, China Mak, C.M. (2002). Development of a prediction method for flow-generated noise produced by duct elements in ventilation systems. Applied Acoustics, Vol. 63, pp. 81-93
Application of Computational Fluid Dynamics to the Study of Designed Green Features for Sustainable Buildings
197
Mak, C.M. (2005). A prediction method for aerodynamic sound produced by multiple elements in air ducts. Journal of Sound and Vibration, Vol. 287, pp. 395-403 Mak, C.M. & Au W.M. (2009). A turbulence-based prediction technique for flow-generated noise produced by in-duct elements in a ventilation system. Applied Acoustics, Vol. 70, pp. 11-20 Mak, C.M.; Cheng, C. & Niu, J.L. (2005a). The application of computational fluid dynamics to the assessment of green features in buildings: Part 1: Wing walls. Architectural Science Review, Vol. 48, No. 1, pp. 121-34 Mak, C.M.; Cheng, C. & Niu, J.L. (2005b). The application of computational fluid dynamics to the assessment of green features in buildings: Part 1: Wing walls. Architectural Science Review, Vol. 48, No. 1, pp. 1-14 Mak, C.M.; Niu, J.L.; Lee, C.T. & Chan, K.F. (2007). A numerical simulation of wing walls using computational fluid dynamics. Energy and Buildings, Vol. 39, pp. 995-1002 Mak, C.M. & Oldham, D.J. (1998a). The application of computational fluid dynamics to the prediction of flow-generated noise in low speed flow ducts. Part 1: Fluctuating drag forces on a flow spoiler. Journal of Building Acoustics, Vol. 5, No. 2, pp. 123-41 Mak, C.M. & Oldham D.J. (1998b). The application of computational fluid dynamics to the prediction of flow-generated noise in low speed flow ducts. Part 2: Turbulencebased prediction technique. Journal of Building Acoustics, Vol. 5, No. 3, pp. 199-213 Mak, C.M.; Wu, J.; Ye, C. & Yang, J. (2009). Flow noise from spoilers in ducts. Journal of the Acoustical Society of America, Vol. 125, No. 6, pp. 3756-65 Mak, C.M. & Yang J. (2000). A prediction method for aerodynamic sound produced by closely spaced elements in air ducts. Journal of Sound and Vibration, Vol. 229, No. 3, pp. 743-53 Mak, C.M. & Yang J. (2002). Flow-generated noise radiated by the interaction of two strip spoilers in low speed flow ducts. Acta Acustica united with Acustica, Vol. 88, pp. 86168 Mak, C.M. & Yik Francis, W.H. (2002). A study of natural ventilation in a kitchen using computational fluid dynamics (CFD). Architectural Science Review, Vol. 45, pp. 1-8 McCarthy, B. (1999). Wind Towers: Details in building, Academy Edition, John Wiley & Sons, West Sussex, UK Melbourne, W.H. (1979). Turbulence effects on maximum surface pressures; a mechanism and possibility of reduction. Proceedings of the Fifth International Conference on Wind Engineering, pp. 541-51, Fort Collins, USA, July 1979, edited by Cermak, J.E. Murakami, S. (1997). Current status and future trends in computational wind engineering. Journal of Wind Engineering and Industrial Aerodynamics, Vol. 67-68, pp. 3-34 Murakami, S. (2002). Setting the scene: CFD and symposium overview. Wind and Structures, Vol. 5, No. 2-4, pp. 83-8 Niu, J.L. & Kooi, J.V.D. (1992). Two-dimension simulation of the air flow and thermal comfort in a room with open-window and indoor cooling systems. Energy and Buildings, Vol. 18, No. 1, pp. 65-75 Niu, J.L.; Yuen, Y.M. & Mak, C.M. (2005). The application of Computational Fluid Dynamics to the assessment of green features in buildings: Part 2: Communal sky gardens. Architectural Science Review, Vol. 48, pp. 337-44
198
Computational Fluid Dynamics
Niu, J.L. & Zhu, Z.J. (2004). Numerical study of wind flow around a CAARC Standard tall building in an atmospheric boundary layer. ASME Journal of Fluid Engineering, Jan 2004 Swainson, M.J. (1997). Evaluation of the potential of Solar Chimneys to Drive Natural Ventilation in Non-Domestic Buildings, Ph.D. Dissertation, Cranfield University, UK