Therefore, one edge detection tech- nique is to measure the gradient ... IEEE SIGNAL PROCESSING MAGAZINE [64] JANUARY 2005. 1053-5888/05/$20.00© ...
190
A. Koschan and M. Abidi, "Detection and Classification of Edges in Color Images," Signal Processing Magazine, Special Issue on Color Image Processing, Vol. 22, No. 1, pp. 64-73, 2005
FLOWER PHOTO © 1991 21ST CENTURY MEDIA, CAMERA AND BACKGROUND PHOTO: © DIGITAL VISION LTD.
[Andreas Koschan and Mongi Abidi]
Detection and Classification of Edges in Color Images [A review of vector-valued techniques]
I
n this article, we present a review of techniques for the detection and classification of edges in color images. Edge detection is one of the most important tasks in image processing and scene analysis systems. It denotes the procedure of detecting meaningful discontinuities (edges) of the image function (see Figure 1 for an example of edge detection in color and gray-level image). The accuracy in detecting these discontinuities (edge detection) and the efficiency in implementing these operations are important criteria for using an algorithm in the area of computer vision. Inaccuracies in edge detection directly influence the results of a subsequent feature-based image processing technique, such as region segmentation, stereo analysis, data coding, image retrieval, data hiding, watermarking, or recognition and tracking of objects in image sequences. Edges in gray-level images can be thought of as pixel locations of abrupt gray-level change. A change in the image function can be described by a gradient that points in the direction of the largest growth of the image function. Therefore, one edge detection technique is to measure the gradient vector magnitude at pixel locations. This method works best when the gray-level transition is quite abrupt, like a step function. As the transition region gets wider, it is more advantageous to apply second-order derivatives like the Laplacian. The potential edge pixel locations can then be described by zero-crossings in the results. While edge detection in gray-level images is a well-established area, edge detection in color images has not received the same attention. The fundamental difference between color images and gray-level images is that, in a color image, a color vector (which generally consists of three components) is assigned to a pixel, while a scalar gray-level is assigned to a pixel of a
IEEE SIGNAL PROCESSING MAGAZINE [64] JANUARY 2005
1053-5888/05/$20.00©2005IEEE
gray-level image. Thus, in color image processing, vector-valued image functions are treated instead of scalar image functions (as in gray-level image processing). The techniques used for this can be subdivided on the basis of their principle procedures into two classes: ■ monochromatic-based techniques treat information from the individual color channels or color vector components first separately and then combine together the individual results gained. ■ vector-valued techniques treat the color information as color vectors in a vector space provided with a vector norm. Up to now, most of the color edge detection methods are monochromatic-based techniques, which produce, in general, better than when traditional gray-value techniques are applied. In this overview, we focus mainly on vector-valued techniques because it is easy to understand how to apply common edge detection schemes to every color component. Opposed to this, vector-valued techniques are new and different. While in gray-level images a discontinuity in the gray-level function is indicated as an edge, the term “color edge” has not been clearly defined for color images. Several different definitions have been proposed for color edges. A very old definition [19] states that an edge exists precisely in the color image if the intensity image contains an edge. This definition ignores, however, possible discontinuities in the hue or saturation values. If, for example, two equally light objects of various colors are arranged in juxtaposition in a color image, then the edges determining the object geometry cannot be determined with this technique. Figure 2(a) shows a synthetic image consisting of three different color squares of similar intensity in a grid pattern. While a color version of the Canny operator is able to detect the borders between the squares [see Figure 2(b)], the original grayscale version is not able to detect any edges [see Figure 2(c)]. A second definition for a color edge states that an edge exists in the color image if at least one of the color components contains an edge. However, merging the edge detection results from
(a)
(b)
the color components may cause some problems due to localization inaccuracies of edges in the individual color channels. A third monochromatic-based definition for color edges is based on the calculation of the sum of absolute values of the gradients for the three color components. A color edge exists if the sum of the absolute values of the gradients exceeds a threshold value. The results of the color edge detection by the two previously named definitions depend heavily on the used color spaces. All previously referenced definitions ignore the relationship between the vector components. Since a color image represents a vector-valued function, a discontinuity of chromatic information can and should also be defined in a vector-valued way. The second part of the article addresses the topic of edge classification. While edges are often classified into step edges and ramp edges, we address the topic of physical edge classification based on their origin into shadow edges, reflectance edges, orientation edges, occlusion edges, and specular edges. The rest of this article is organized as follows. First, we discuss various vector-valued techniques for detecting discontinuities in color images. Then operators are presented based on vector order statistics, followed by presentation by example a couple of results of color edge detection. We then discuss different approaches to a physical classification of edges by their origin, and finally the article is concluded. VECTOR-VALUED TECHNIQUES In some early publications on color edge detection, vector-valued techniques were suggested that replaced gray-level differences of adjacent pixels in some way by vector differences [17], [24]. Huntsberger and Descalzi [11] used fuzzy membership values, while Pietikainen and Harwood [17] used histograms of vector differences. Yang and Tsai [30] and Tao and Huang [25] used vector projections, but the first projected colors into grayscale, while the latter projected vector differences onto segments connecting color clusters. However, these simple difference operators do not represent the state of the art in edge detection in either graylevel image processing or in color image processing.
(c)
(d)
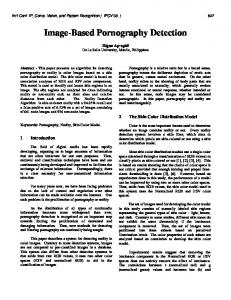
[FIG1] Results of edge detection applied to the color image Lena. (a) Original color image. (b) Gray-level representation. (c) Results for a color variant of the Canny operator. (d) Results of the gray-level algorithm of the Canny operator. (Used with permission from John Owens, Stanford University.)
IEEE SIGNAL PROCESSING MAGAZINE [65] JANUARY 2005
COLOR VARIANTS OF THE CANNY OPERATOR Novak and Shafer suggest an extension of the “Canny operator” [3] for color edge detection. Kanade introduced this approach in [12]. The philosophy of the Canny operator consists of first determining the first partial derivatives of the smoothed image function according to x and y, and then, on the basis of these values, finding the magnitude and direction of the “best” edge. A three-band color image is represented by a function that maps a point in the image plane to a three-dimensional (3-D) vector in the color space. In the red, green, blue (RGB) space, the pixel value is the vector C = (R, G, B ). We have C as a function of (x, y) in the image and can describe the variation of the image function at any point by the equation �C = J�(x, y). The Jacobian matrix is indicated by J, which contains the first partial derivatives for each component of the color vector. In the RGB space, J is
where C x and C y are the partial derivatives of the color components, for example, in the RGB space C x = (Rx, G x, Bx).
(4)
The magnitude m of an edge is indicated by
m2 = �C x�2 cos2 (θ) + 2 · C x · C y · sin(θ) cos(θ) + �C y�2 sin2 (θ).
(5)
Finally, after the direction and the magnitude are determined for each edge, nonmaximum suppression is used, based on a threshold value in order to eliminate broad edges. Several different color versions of the Canny operator were tested at Carnegie Mellon University. Here, each operator is sub Rx R y divided into three individual processing steps that are defined � � J = G x G y = C x, C y . (1) below. Then, after k, k = 1, . . . , 3, processing steps for the indiBx By vidual components of the color vectors have been implemented, these results can be combined with a combination operator. The following processing steps are implemented next for the The indices x and y designate the respective partial derivatives attained scalar values. By this combination, the vector-valued of the functions, e.g., technique is transferred into a monochromatic-based technique. ∂R ∂R For the definition of the “combination operators,” different Rx = and Ry = . (2) mathematical norms can be used as a basis, e.g., the L1 -norm ∂x ∂y (sum of the absolute values), the L2 -norm (Euclidian norm), or the L∞ -norm (maximum of the absolute values). A color edge The direction in the image along which the largest change and/or the largest discontinuity in the chromatic image funcoperator can now be described by the k processing steps that were implemented for the individual color channels and the tion occurs is represented by the eigenvector of J T J corresponindex of the norm used for the combination. The Canny operading to the largest eigenvalue. This technique can likewise be tor can be subdivided into three processing steps. used for multichannel images and/or image sequences. The I) determine the partial derivatives direction θ of a color edge defined in such a way is determined II) calculate edge direction and edge magnitude in an individual image with any norm by III) implement the nonmaximum suppression. In accordance with the convention specified previously, the I/2 2 · Cx · Cy tan(2θ) = , (3) Canny operator consists of determining the partial derivatives �C x�2 − �C y�2 for each component of the color vectors (processing step I), combining the results using the Euclidean norm L2 , and executing the remaining processing steps for the combined values. We note that 0/1 and 0/2 color operators consist of determining an intensity image of the color vectors and subsequently executing the standard Canny operator. Kanade [12] summarizes the results obtained for a selected series of color test images as follows: (b) (a) (c) ■ The color edges describe object geometry in the scene better than [FIG2] (a) Original color image consisting of three different color squares of similar intensity in a the intensity edges, although over grid pattern. (b) Results for a color variant of the Canny operator. (c) Results of the gray-level algorithm of the Canny operator. (Used with permission from John Owens, Stanford University.) 90% of the edges are identical.
IEEE SIGNAL PROCESSING MAGAZINE [66] JANUARY 2005
■ II/∞
proved to be the best multilevel operator, i.e., computation of the edge magnitude and direction separately for each color channel and subsequent selection of the edge with the strongest magnitude. ■ A similar, but not as good, result can be obtained with the I/∞ operator. This is faster than the II/∞ operator, since the combination of the color channels takes place earlier. ■ The II/∞ operator produced almost exactly the same edges as the theoretical operator based on the Jacobian analysis described previously. Until now, there have been no investigations on what extent the choice of the smoothing operator and/or the choice of a suitable standard deviation for the Gaussian smoothing influences the detected results. CUMANI OPERATOR For edge detection in color or multispectral images, Cumani suggests the extension of procedures based on the second partial derivatives of the image functions [4]. A three-channel color image C is regarded as a two-dimensional (2-D) vector field C(x, y) = (C1 (x, y), C2 (x, y), C3 (x, y))
(6)
with the three components C1 (x, y), C2 (x, y), and C3 (x, y). In the RGB space, these vector components correspond to the components R(x, y), G(x, y), and B(x, y) for the RGB color channels (or the long, middle, and short wave spectral transmission, respectively). The notation Ci (x, y) is given at this point, on the one hand, for a compact representation. On the other hand, it should be made clear that this technique is applicable, in general, for n-channel color images. In this connection, it is always assumed that a Euclidian metric exists for the n-dimensional vector space. Therefore, this technique cannot be easily used for edge detection in the HSI, CIELUV, or CIELAB space. The squared local contrast S(p; n) at p = (x, y) is defined [4] as a quadratic norm of the directional derivatives of the image function C toward the unit vector n = (n1 , n2 ) by S(p; n) = K · n21 + 2 · Fn1 n2 + H · n22 .
(7)
3 � ∂ Ci i=1
H=
3 � i=1
∂x
·
∂ Ci , ∂x
F=
3 � ∂ Ci i=1
∂ Ci ∂ Ci · . ∂y ∂y
∂x
·
∂ Ci , ∂y
(8)
�
K F
�
(K + H)2 +F2 4
and
n± = (cos(θ± ), sin(θ± )),
F H
(10)
with θ− = θ+ + (π/2) and
θ+ =
π 4, π − 4,
if (K − H) = 0 and F > 0, if (K − H) = 0 and F < 0,
undefined, � � 2F 1 tan−1 , 2 K−H
if K = F = H = 0, and otherwise.
In the one-channel case, λ± corresponds to the gradient, and n± and θ± give the direction of the strongest and the weakest magnitude. The two latter terms thus correspond to the gradient direction. Since only the direction of the steepest magnitude is of importance for the extraction of edge points, λ− , n− , and θ− are not further addressed. The squared local contrast of the vector-valued image function C, dependent on location and direction, is defined by S(p; n+ ). The maximum squared local contrast λ+ was clearly defined as a maximum of S(p; n+ ) over the possible directions n+ , while the direction of the maximum magnitude is clearly determined only up to the orientation. Edge points, i.e., discontinuities of the image function that are characterized by a particularly high contrast, are sought. The maxima of λ+ are calculated by deriving the function λ+ (p), which is represented as a function of the location. Subsequently, the zeros of the derivative, which represent the maxima, are to be determined. In order to find the zeros of λ+ (p) defined in (10), the derivatives of this function can also be formed in direction n+ (11)
Therefore, the derivative of λ+ is defined by DS(p; n) with
and
The eigenvalues of the matrix A=
K+H λ± = ± 2
∇λ+ · n+ = ∇ S(p; n+ ) · n+ .
The abbreviations are defined as K=
coincide with the extreme values of S(p; n) and are obtained if n is the corresponding eigenvector. The extreme values λ± and the corresponding eigenvectors are given by
� (9)
DS(p; n) := ∇λ+ · n+ = Kx n31 + (Ky + 2Fx)n21 n2 + (Hx + 2Fy)n1 n22 + Hy n32 ,
(12)
where the indices x and y denote the corresponding derivatives to x and y, respectively, and the index + in the components of n+ are omitted for simplification. In the one-channel case, λ± corresponds to the absolute value of the gradient.
IEEE SIGNAL PROCESSING MAGAZINE [67] JANUARY 2005
DS(p; n+ ), as the derivative of λ± to n+ , corresponds in the OPERATORS BASED ON VECTOR ORDER STATISTICS Following the use of morphological operators for edge detection one-channel case to the derivative of the absolute value of the in gray-level images [9], Trahanias and Venetsanopoulos suggest gradient in the gradient direction. vector-valued ranking operators for edge detection in color Altogether DS(p; n+ ) is a form that is based on the second images [27], [28]. The scheme of the detection and combination directional derivatives of the image function. The edge of local minima and maxima of the image function, as it is used points, which were defined as the maximum points of the for a morphological edge extraction in gray-level images, cannot first derivative of the image function, are represented in DS(p; n+ ) by zeros (or zero-crossings in the digital grid). For be extended directly to vector-valued color images. No exact equivalent of the scalar “min-max” operator exists for vector-valthe detection of these zero-crossings (with regard to, for ued variables. In [28], the application of vector order statistics is example, a four- or eight-neighborhood), neighboring functherefore suggested for this. tion values with different signs must be sought. The sign of DS(p; n+ ) is, until now, not uniquely defined. The definition Ordering of vector-valued data cannot be uniquely defined. Therefore, a set of techniques for the arrangement of an orderof n+ of the eigenvector of a matrix results in the fact that it ing scheme for vector-valued data was introduced, which generis not certain whether n+ or (−n+ ) is the sought-after vecally can be classified into tor. Since n+ cubically rises in DS(p; n+ ), DS(p; n+ ) is directly marginal- (M), reduced- (R), EDGE DETECTION IS ONE OF THE MOST conditional- (C), and partialdependent on the sign of n+ . (P) ordering [28]. Trahanias and For the solution of this probIMPORTANT TASKS IN IMAGE PROCESSING Venetsanopoulos propose the lem, Cumani [4] recommends AND SCENE ANALYSIS SYSTEMS. use of reduced ordering for an investigation into the subcolor edge detection because pixel domain using a bilinear this scheme contains a natural definition of a vector median for interpolation. Alshatti and Lambert [1] propose a modificathe first sample in the arranged vector sequence, and vector outtion of Cumani’s technique. Since λ+ is an eigenvalue of the liers occupy the upper ranks in this vector sequence. matrix A, the associated eigenvector n+ can be directly deterFurthermore, the other ordering schemes appear less suitable mined. Thereby the complex approximation in the subpixel for color image processing. M-ordering corresponds to a compodomain, as suggested by Cumani, is avoided. nent-wise monochromatic-based processing, and P-ordering The computationally costly calculations of the partial implies the construction of a convex hull, which is difficult in 3derivatives of K, F, and H to x and y can be accomplished D. C-ordering represents, simply, an ordering according to a more efficiently if these derivatives are determined directly, specific selected component, and thus does not use the informawithout first calculating and storing K, F, and H [14]. tion content from the other signal components. However, it must still be specified how the partial derivatives x = (x1 , x2 , . . . , xp) T represents a p-dimensional (multiof the image functions are to be determined. Alshatti and Lambert [1] and Cumani [4] applied several 3 × 3 convolution variate) term provided with several characteristic variables, masks for this. From [15] it is well known that the use of conwhere the xl , l = 1, 2, . . . , p, are random variables, and x i , i = 1, 2, . . . , n is an observation of x. Each x i represents a volution masks of a fixed size of 3 × 3 pixels is not suitable for p-dimensional vector. In R-ordering, each multivariate obserthe complex problem of determining discontinuities in image functions. Therefore, for the determination of the partial vation is reduced as a function of a distance criterion to a derivatives, masks that are based on the 2-D Gaussian funcscalar value di . If the sum of the distances of the vector x i to tion and their partial derivatives are suggested here. These each vector from the set x1 , x2 , . . . , xn is selected as a distance masks are called “Gaussian masks” and can be parameterized metric, then di is represented by by the standard deviation σ . The size of the Gaussian masks n � can be specified by those function values that are, e.g., larger �x i − xk� , di = (13) than 0.1% of the maximum function value of the Gaussian k=1 function for a standard deviation σ . Thus, the choice of a standard deviation of, e.g., σ = 0.5 corresponds to a mask of where �·� represents a suitable vector norm. An arrangement of size 3 × 3 pixels. Large Gaussian masks can be effectively the di s in ascending order, d1 ≤ d2 ≤ · · · ≤ dn , associates the approximated by cascaded block filters with very high efficiensame ordering to the multivariate x i s, x1 ≤ x2 ≤ · · · ≤ xn . In cy (a few operations per pixel). this arranged sequence, x1 is the vector median of the data samNote that the Cumani operator can be parameterized over ples. It is defined as that vector contained in the given set whose the standard deviation σ if Gaussian masks are included in the distance to all other vectors is a minimum. calculations of the partial derivatives. Therefore, an application A color image is now regarded as a vector field, represented of this operator is also possible in different resolutions [14]. by a discrete vector-valued function C : Z 2 → Z m , where m = 3 for three-channel color images. F indicates a window The use of Gaussian masks is, however, not entirely necessary here for the scalability of the operator. Other functions, such over the image function that contains n pixels (color vectors). as Gabor functions, can be used as well. If R-ordering is specified for all color vectors lying within the
IEEE SIGNAL PROCESSING MAGAZINE [68] JANUARY 2005
window, then x i indicates the ith vector in this ordering. A simple color edge operator [vector rank operator (VR)] is defined [28] by VR = �xn − x1 � .
(14)
Edges in color images can be determined by indicating a threshold value for VR. VR would be very sensitive, however, in relation to impulse noise, since the vectors lying in the upper order of rank can correspond with the noisy data. In order to eliminate this disadvantage, Trahanias and Venetsanopoulos [28] consider dispersion measures. A general class of vector dispersion edge detectors (VDEDs) can be defined by using a linear combination of the arranged vectors � � � �� � �� n n n �� � �� � � �� � � � � � � VDED = OSO � α i1 x i � , � α i2 x i � , . . . , � α ikx i � , � � � � � � i=1
i=1
i=1
(15) where OSO indicates an operator based on ordering statistics. In principle, edge operators can be derived from the previous equation by a suitable choice of an OSO and a set of coefficients α ij. In order to limit this difficult task, some requirements for an edge operator are observed in [28]. First, the edge operator should not be sensitive to impulse and Gaussian noise, and second, the edge operator should supply a reliable answer for ramp edges. Since the vectors afflicted by impulse noises appear in the higher ranks in the set of ordered vectors, the detector can be made insensitive to this kind of noise. Instead of a single difference, as in (14), k sets are determined by differences, and a minimization is implemented. �� �� min � xn− j+1 − x1 � , j
The value for the parameter l in the previous equation cannot be formally determined. Trahanias and Venetsanopoulos [28] argue that a duality exists between l and k, in that l describes the number of pixels that are on the larger side of an edge, if F is centered on an edge pixel. The choice of the parameters k and l in the equation is, however, subjective and heuristic. Note that color vectors can also be ordered applying principal component analysis to aid color edge detection. RESULTS OBTAINED USING COLOR EDGE OPERATORS Various techniques for edge detection in color images were presented previously. The following will cover how significant the differences are in the results when differing techniques for edge detection are applied. A discussion of several criteria for the evaluation of edge operators (in gray-level images) can be found in [21]. The topic of edge detection in color images is, however, not covered there. The results of an investigation [12] of different color variants of the Canny operator have already been described. Here, resulting images for the vector-valued variants of the Canny operator are presented. The results for a selected color test image obtained with the Cumani operator, including Gaussian masks, are compared directly to these results. In addition, a result image with a monochromatic technique is visualized. For a monochromatic-based technique, the classic Mexican hat operator (LoG operator) was selected as an example. The Mexican hat operator is defined by the negative Laplacian derivative of a 2-D Gaussian distribution −∇ 2 GAUSS(x, y) [15]. It holds that � � x2 + y2 − 2σ 2 x2 + y2 . −∇ GAUSS(x, y) = exp − 2πσ 6 2σ 2 2
(18) j = 1, 2, . . . , k; k < n.
(16)
Impulses (up to k − 1) caused by isolated noisy pixels are not detected by the implementation of minimization. The choice of a suitable value for k in the previous equation depends on n, the size of the observed work window F. However, no general formula for the definition of k can be indicated. In [28], it is proposed to interpret k as the number of the pixels belonging to the smaller side of the edge, if F is centered on an edge pixel. In order to make the operator insensitive to Gaussian noise, Trahanias and Venetsanopoulos replace the vector median x1 by a so-called vector-valued “α-trimmed” mean value (vector � α-trimmed mean, VαTM, li=1 (x i / l )). The resulting edge operator based on minimum vector dispersion (MVD), is defined as �� l � � xi � MVD = min � xn− j+1 − � l j i=1
�� � � � , �
j = 1, 2, . . . , k; l < n.
(17)
The operator can be parameterized with the standard deviation σ . The size of the convolution masks was fixed by those function values that are greater than 0.1% of the maximum function value of the Gaussian function for a standard deviation σ . The convolution mask designed for a selected σ is applied to all three spectral transmissions of the color image. A pixel in a color image is declared as part of a color edge if a zero-crossing was detected in at least one of the resulting images achieved in this manner. In Figure 3, some results of color edge detection for a selected color image “block” are represented. The results can be interpreted as follows. Many pixels in the image background are determined as edge points by applying the monochromatic-based color variant of the Mexican hat operator [see Figure 3(d)]. In addition, many gaps develop at the same time in the detected edges. The results of the Mexican hat operator can be improved by defining a larger standard deviation. In Figure 3, the result for the standard deviation σ = 1.0 was selected in order to show such a comparison to the Cumani operator, which was parameterized over the same value for the standard deviation.
IEEE SIGNAL PROCESSING MAGAZINE [69] JANUARY 2005
Better results are achieved with the Cumani operator [see Figure 3(c) and (e)]. Here, the quality of the results is continually improved if Gaussian masks with a greater standard deviation are used instead of a 3 × 3 convolution mask with σ = 0.5. A
(a)
(b)
(c)
(d)
(e)
(f)
(g)
(h)
[FIG3] (a) Color image “block” and (b) its gray-level representation. (c) Edge detection results for the Cumani operator with σ = 0.5, (d) the Mexican hat operator with σ = 1.0, and (e) the Cumani operator with σ = 1.0. (f) Results for the graylevel image of “block” for the Cumani operator with σ = 1.0, (g) the color Canny operator, and (h) the gray-value Canny operator. [Parts (g) and (h) used with permission from John Owens, Stanford University.]
comparison of the results, which the Cumani operator supplies for the color image “block” [see Figure 3(e)] and for the corresponding gray-level image [see Figure 3(f)], is interesting. It is to be noted that several edges that had not been determined in the gray-level image were detected in the color image. Further investigations have shown that edge detection in color images is more robust in relation to noise than appropriate edge detection in the associated gray-level image. This applies especially to low contrasted images. From the results obtained with the Canny operator, it can also be recognized that some edges could be detected in the color image [see Figure 3(g)] that were not determined in the gray-level image [see Figure 3(h)]. This statement applies likewise to the color image Lena, for which a gray-level representation and the results obtained with the Canny operator were indicated in Figure 1. With a comparison of the results for the Cumani operator indicated in Figure 3, and the Canny operator for the color image “block,” one recognizes that more edges were detected with the Cumani operator than with the Canny operator. This statement cannot be generalized, however, and applies only to the results represented in Figure 3. The inclusion of the results that can be obtained with vector-valued ranking operators, as they were described previously, remains the subject of future work. It can be said that the results that are determined in color images are at least as good as or better than the results that are determined in gray-level images. Apart from a qualitative evaluation of the results of color edge detection, a quantitative evaluation is also of interest. As a function of the processed image, about 90% of all detected edges are identical in the color image and intensity image [12]. Also of concern during the detection of edges in color images is the detection of the remaining 10% of the edges. It depends on the respective application whether the expenditure is justified for the detection of this additional 10%. In an edge-based stereo analysis, only those edges can be assigned that were also detected in both images. A missing edge that was not detected can lead to a complete misinterpretation within shape reconstruction. Furthermore, the nondetection of an edge also has a deciding influence on the result of an edge-based segmentation process. In the following, it is not our concern to decide whether the additional edges are needed or not. Rather, vector-valued techniques were introduced that make it possible to at least partly detect the remaining edges. In the following, it is shown that color information can be used, under certain conditions, for classifying edges. CLASSIFICATION OF EDGES In addition to quantitative and qualitative advantages of color edge detection, color information allows for physical classification of the edges. The main goal of the following is to give a general overview on various edge classification techniques and to familiarize the reader with the dichromatic reflections model that is commonly applied in physics-based color image processing. Edges in images can have completely different causes due to the geometrical and photometric conditions within a scene.
IEEE SIGNAL PROCESSING MAGAZINE [70] JANUARY 2005
Different types of edges are outlined in Figure 4. Edges can be distinguished into the following five classes: Orientation Edge ■ object edges, or orientation edges, arise from a discontinuity of the vector normal of a continuous surface Shadow Occlusion Edge Edge ■ reflectance edges arise from a discontinuity of the reflectance of object surfaces, for example, by a change of surface material Specular Edge ■ illumination edges, or shadow edges, arise from a discontinuity of the intensity of the incident lighting ■ specular edges, or highlight edges, arise from a special orientation between the light source, the object surface, and the observer and are due to material properties ■ occlusion edges are boundaries between an object and the Reflectance Edge background as seen by the observer. Occlusion edges do not represent a physical discontinuity in the scene. They exist due to a special viewing position. [FIG4] Different types of edges in a representation of a scene. In many areas of digital image processing, a classification of edges is necessary and/or advantageous. For example, only orientation edges, reflectance edges, and illumination edges should be matched in stereo vision. Specular edges and Incident Light Interface Reflection occlusion edges should not be matched Surface because their occurrence in the image Normal depends on the viewing position of both camBody Reflection n n eras, and they do not represent the identical physical locus in the scene. Illumination Interface edges should not be matched if motion analysis is applied. The classification of edges by Medium their physical origin is difficult or even imposColorants sible in gray-level images. Color image processing can provide a solution to this problem at least in part. [FIG5] Reflection on an inhomogeneous dielectric material.
DICHROMATIC REFLECTION MODEL If it is known, for example, that the objects in the scene consist of inhomogeneous dielectric materials, then a physics-based classification of the color edges is possible. The dichromatic reflection model (DRM) describes the reflection on inhomogeneous, dielectric materials, such as plastic or paint [23]. The surface area construction of these materials consists of an interface and an optically neutral medium in which color pigments are found. The construction of such a material is illustrated in Figure 5. The interface separates the surface area from the medium surrounding it, which is generally air. A portion of the radiation that appears on the surface area does not penetrate into the material, but rather is reflected on the interface. This reflection is called Fresnel reflection (interface reflection or surface reflection) and has approximately the same spectral distribution as the light of the illumination source. The light that is not reflected onto the interface penetrates into the material. There it is scattered onto the color particles, partially absorbed, partially passed on, and finally, a portion of the penetrated light is reflected through the interface into the surrounding medium. This final process is indicated as “body reflection.” When the division of the color pigments is homogeneous
and the pigments demonstrate the same optical behavior, it can be assumed that the light penetrating into the material does not show any particular direction when exiting the surface area. The light energy L that falls on a sensor depends on the wavelength λ, the surface normal n, the lighting direction s, and the viewer direction v. L is the sum of the radiance of the interface reflection Ls and the body reflection Lb . The interface reflection describes the specular reflection component, while the diffuse reflection component is described by the body reflection. The dichromatic model is formulated mathematically by L(λ, n, s, v) = Ls(λ, n, s, v) + Lb (λ, n, s, v) = ms(n, s, v) · cs(λ) + mb (n, s, v) · cb (λ). (19) A DRM assumes that the geometric components ms and mb can be separated from the spectral components cs and cb · cs is denoted as “interface reflection color” and cb as “body reflection color.” Since ms and mb can principally be any scaling factors, vectors c s and cb form a plane in the RGB color space, the socalled dichromatic plane. If the object has many differing surface
IEEE SIGNAL PROCESSING MAGAZINE [71] JANUARY 2005
[TABLE 1] CLASSIFICATION OF COLOR EDGES BASED ON THE SENSITIVITY OF THE DIFFERENT COLOR EDGE MODELS WITH RESPECT TO THE IMAGING CONDITIONS. – DENOTES INVARIANT AND + DENOTES SENSITIVITY OF THE COLOR EDGE MODEL TO THE IMAGING CONDITION [8].
∇ CRGB ∇ Cc1 c2 ∇ C01 02
ORIENTATION EDGE
SHADOW EDGE
HIGHLIGHT EDGE
MATERIAL EDGE
+ − +
+ − +
+ + −
+ + +
area orientations, then the color vectors in the dichromatic plane are assigned to T- and L-shaped clusters. Figure 6 shows the dichromatic plane of a bent, one-color, hybrid-reflecting object. If the object consists of many hybrid-reflecting materials, then a special cluster develops for each material. The color spaces represented in the figure are likewise called “color histograms” although the entry in this color histogram is only binary. It is only noted whether a color appears in the scene or not. Several vector-valued techniques for edge classification in color images are based on the DRM. They can be summarized as follows: ■ Reflectance edges and/or material changes can be partly recognized by a rejection scheme using spectral crosspoints [20]. At least two spectral samples (e.g., the values in the red and green color channels) are needed for the application of this technology. The limits of this classification technique are discussed in [7]. ■ Shadow edges, or illumination edges, can be classified by active shadow recognition [6] or by analyzing the structure of the shadows in chromatic images [7]. A retinex technique has also been applied to color images to detect shadow edges and to remove shadows [5]. It has to be noted that the retinex algorithm also provides some dynamic range compression, which yields to a change of the colors in the image. Furthermore, several recent approaches have been published on shadow detection in gray-level images (see, for example, [10] and [18]).
■ Specular
edges, or highlight edges, can be classified on the basis of methods for highlight detection [2], [13], [22], [26], [29]. These methods separate the specular and the diffuse reflection component applying the DRM. Highlight analysis techniques can be subdivided into global and local techniques. While global techniques have to consider the entire image for finding color clusters [13], [22], [26], local techniques perform local analysis on pixels [22]. However, the latter technique requires that more than one image of an object is available to be analyzed. ■ Orientation edges and occlusion edges can be classified by using gradient estimation techniques. These two latter classes of edges can be determined without evaluation of color information. The techniques mentioned previously do not offer a complete solution to the problem of physical edge classification. However, they may be applied when no complete classification must be accomplished, but it has to be decided in individual cases whether an edge is, for example, caused by a highlight or not. One disadvantage of the procedures specified previously, using the DRM, is that certain knowledge of the material properties of the objects in the scene must be present. A goal for the future is to achieve an edge classification solely on the basis of the vector signals in the color space and without further knowledge about the objects. Techniques in this direction are presented in [16]. PHOTOMETRIC INVARIANT GRADIENTS While the techniques previously discussed were mainly designed to detect one specific class of edges, Gevers and Stokman [8] proposed a technique for an automatic classification of color edges into the three classes 1) shadow-geometry (orientation and occlusion), 2) highlight, and 3) material transitions using photometric invariant gradients. Although their technique can be applied to hyperspectral data, we focus here on the case of a three-channel color image. In addition to the RGB space, Gevers and Stokman investigate normalized colors c1 c2 defined by c1 (R, G, B) = arctan
� � � � R G , c2 (R, G, B) = arctan B B (23)
Blue
and the 2-D opponent color space defined by
Dichromatic Plane
o1 (R, G, B) = cs
cb Green Red [FIG6] Dichromatic plane of a bent, one-color, hybrid-reflecting object.
(R − G) , 2
o2 (R, G, B) =
B (R + G) − . 2 4 (24)
The gradients in the three considered color spaces are denoted by ∇ CRGB , ∇ Cc1 c2 , and ∇ Co1 o2 . From several investigations, one may conclude that ∇ CRGB measures the presence of 1) shadowgeometry, 2) highlight, and 3) material edges. Further, ∇ Cc1 c2 measures the presence of 2) highlight and 3) material edges, while ∇ Co1 o2 measures the presence of 1) shadow-geometry and 3) material edges. As a result, a taxonomy of color edges can be specified (see Table 1). By applying automatic threshold setting
IEEE SIGNAL PROCESSING MAGAZINE [72] JANUARY 2005
to the three gradients [8], an automatic physics-based edge classification into the three classes 1) shadow-geometry, 2) highlight, and 3) material edges can be obtained. This classification is very computationally costly and, so far, no extensive investigations exist on false-positive and false-negative classification results. Note that although this taxonomy allows identifying highlight, material, and shadow-geometry edges, it is not capable of distinguishing between orientation, occlusion, and shadow edges. Here, additional classification techniques need to be applied. CONCLUSION We presented a review of vector-valued techniques for the detection and classification of edges in color images. Color edge operators are able to detect more edges than gray-level edge operators. Thus, additional features can be obtained in color images that may not be detected in gray-level images. However, it depends on the application (and the class of images) whether these color edge features are required. In addition to quantitative and qualitative advantages of color edge detection, color information allows for a classification of the edges. Such classification is not possible without the evaluation of color information, and it can aid many image processing tasks which follow.
[2] R. Bajcsy, S.W. Lee, and A. Leonardis, “Detection of diffuse and specular interface reflections and inter-reflections by color image segmentation,” Int. J. Comput. Vis., vol. 17, no. 3, pp. 241–272, 1996. [3] J. Canny, “A computational approach to edge detection,” IEEE Trans. Pattern Anal. Machine Intell., vol. 8, no. 6, pp. 679–698, 1986. [4] A. Cumani, “Edge detection in multispectral images,” Comput. Vis. Graph. Image Process.: Graphical Models Image Processing, vol. 53, no. 1, pp. 40–51, 1991. [5] G. Finlayson, S. Hordley, and M. Drew, “Removing shadows from images using Retinex,” in Proc. Color Imaging Conf., 2002, pp. 73–79. [6] G. Funka-Lea and R. Bajcsy, “Active color image analysis for recognizing shadows,” in Proc. 13th Int. Joint Conf. Artificial Intell., vol. 2, 1993, pp. 1573–1578. [7] R. Gershon, A.D. Jepson, and J.K. Tsotsos, “Ambient illumination and the determination of material changes,” in Physics-Based Vision Principles and Practice: Color, G.E. Healey, S.A. Shafer, and L.B. Wolff, Eds. Boston, MA: Jones & Bartlett, 1992, pp. 101–108. [8] T. Gevers and H. Stokman, “Classifying color edges in video into shadow-geometry, highlight, or material edges,” IEEE Trans. Multimedia, vol. 5, no. 2, pp. 237–243, 2003. [9] R.M. Haralick, S.R. Sternberg, and X. Zhuang, “Image analysis using mathematical morphology,” IEEE Trans. Pattern Anal. Machine Intell., vol. 9, no. 4, pp. 532–550, 1987. [10] J.-W. Hsieh, W.-F. Hu, C.-J. Chang, and Y.-S. Chen, “Shadow elimination for effective moving object detection by Gaussian shadow modeling,” Image Vis. Comput., vol. 21, no. 6, pp. 505–516, 2003. [11] T.L. Huntsberger and M.F. Descalzi, “Color edge detection,” Pattern Recognit. Lett., vol. 3, no. 3, pp. 205–209, 1985. [12] T. Kanade, “Image understanding research at CMU,” in Proc. Image Understanding Workshop, vol. II, 1987, pp. 32–40. [13] G.J. Klinker, S.A. Shafer, and T. Kanade, “A physical approach to color image understanding,” Int. J. Comput. Vis., vol. 4, no. 1, pp. 7–38, 1990. [14] A. Koschan, “A comparative study on color edge detection,” in Proc. 2nd Asian Conf. Comput. Vis., vol. III, 1995, pp. 574–578.
ACKNOWLEDGMENTS This work is supported by the University Research Program in Robotics under grant DOE-DE-FG02-86NE37968, by the DOD/RDECOM/NAC/ARC Program R01-1344-18, and by FAA/NSSA Program R01-1344-48/49. AUTHORS Andreas Koschan received his M.S. degree in computer science and his Ph.D. degree in computer engineering from the Technical University Berlin, Germany, in 1985 and 1991, respectively. He is currently a research associate professor with the Department of Electrical and Computer Engineering, University of Tennessee, Knoxville. His work has primarily focused on color image processing and 3-D computer vision, including stereo vision and laser range finding techniques. He is a coauthor of two textbooks on 3-D image processing and a Member of IEEE. Mongi Abidi is a W. Fulton Professor with the Department of Electrical and Computer Engineering, the University of Tennessee, Knoxville, which he joined in 1986. He received his M.S. and Ph.D. degrees in electrical engineering in 1985 and 1987, both from the University of Tennessee, Knoxville. His interests include image processing, multisensor processing, 3D imaging, and robotics. He has published more than 120 papers in these areas and coedited a textbook. He is a Member of the IEEE, the IEEE Computer Society, the Pattern Recognition Society, and the SPIE. REFERENCES
[1] W. Alshatti and P. Lambert, “Using eigenvectors of a vector field for deriving a second directional derivative operator for color images,” in Proc. 5th Int. Conf. Computer Analysis Images and Patterns, D. Chetverikov, W.G. Kropatsch, eds., 1993, pp. 149–156.
[15] D. Marr and E. Hildreth, “Theory of edge detection,” Proc. Royal Soc. London, vol. B207, pp. 187–217, 1980. [16] B.A. Maxwell and S.A. Shafer, “Physics-based segmentation of complex objects using multiple hypotheses of image formation,” Comput. Vis. Image Understanding, vol. 65, no. 2, pp. 269–295, 1997. [17] M. Pietikäinen and D. Harwood, “Edge information in color images based on histograms of differences,” in Proc. Int. Conf. Pattern Recognit., Paris, France, 1986, pp. 594–596. [18] A. Prati, R. Cucchiara, I. Mikic, and M.M. Trivedi, “Analysis and detection of shadows in video streams: A comparative evaluation,” in Proc. Int. Conf. Computer Vion and Pattern Recognition, vol. II, 2001, pp. 571–576. [19] G.S. Robinson, “Color edge detection,” in Proc. SPIE Symp. Advances Image Transmission Techniques, vol. 87, 1976, pp. 126–133. [20] J.M. Rubin and W.A. Richards, “Color vision and image intensities: When are changes material?,” Biol. Cybern., vol. 45, no. 3, pp. 215–226, 1982. [21] M. Salotti, F. Bellet, and C. Garbay, “Evaluation of edge detectors: Critics and proposal,” in Proc. Workshop Performance Characteristics Vision Algorithms, H.I. Christensen, W. Förstner, C.B. Madson, eds., 1996 [Online]. Available: http://www.vision.auc.dk/~hic/perf-proc.html. [22] K. Schlüns and A. Koschan, “Global and local highlight analysis in color images,” in Proc. 1st Int. Conf. Color Graphics Image Processing, 2000, pp. 300–304. [23] S.A. Shafer, “Using color to separate reflection components,” COLOR Res. Applicat., vol. 10, pp. 210–218, 1985. [24] J.C. Solinsky, “The use of color in machine edge detection,” in Proc. VISION’85, pp. 4-34–4-52, 1985. [25] H. Tao and T. Huang, “Color image edge detection using cluster analysis,” in Proc Int’l Conf. Image Processing, Washington, D.C., 1997, vol. I, pp. 834–837. [26] F. Tong and B.V. Funt, “Specularity removal for shape from shading,” in Proc. Vision Interface Conf., pp. 98–103, 1988. [27] P.W. Trahanias and A.N. Venetsanopoulos, “Color edge detectors based on multivariate ordering,” Proc. SPIE Visual Communications Image Processing, vol. 1818, 1992, pp. 1396–1407. [28] P.W. Trahanias and A.N. Venetsanopoulos, “Color edge detection using vector order statistics,” IEEE Trans. Image Processing, vol. 2, no. 2, pp. 259–264, 1993. [29] W.H. Tsang and P.W.M. Tsang, “Suppression of false edge detection due to specular reflection in color images,” Pattern Recognit. Lett., vol. 18, no. 2, pp. 165–171, 1997. [30] C.K. Yang and W.H. Tsai, “Reduction of color space dimensionality by moment-preserving thresholding and its application for edge-detection in color images,” Pattern Recognit. Lett., vol. 17, no. 5, pp. 481–490, 1996. [SP]
IEEE SIGNAL PROCESSING MAGAZINE [73] JANUARY 2005