International Journal of Drug Development & Research | October-December 2011 | Vol. 3 | Issue 4 | ISSN 0975-9344 | Available online http://www.ijddr.in Covered in Official Product of Elsevier, The Netherlands ©2010 IJDDR Development and validation of first order derivative UV-Spectrophotometric method for determination of Sitagliptin in bulk and in Formulation Jain Pritam*, Chaudhari Amar, Desai Bhargav, Patel Shani, Patel Santsaran, Shimpi Hiren
FULL Length Research Paper Covered in Index Copernicus with IC Value 4.68 for 2010
Abstract
Key words:
Objective: A simple, rapid, accurate and economical First
Sitagliptin; First order derivative UV, quantitative
order UV-derivative spectrophotometric method has been
determination, methanol.
developed for estimation of sitagliptin from bulk and pharmaceutical formulation.
How to Cite this Paper:
Materials and methods: The λmax of sitagliptin in methanol and water was found to be 267 nm. The same spectrum was
Jain
Pritam*,
amplitude of the trough at 275 nm. The drug follows
Shimpi Hiren “Development and validation of first
linearity in the concentration range 10-60 µg/ml with
order derivative UV-Spectrophotometric method for
correlation coefficient value 0.998.
determination
proposed
method
was
applied
to
pharmaceutical formulation and % amount of drug estimated 99.19 % was found in good agreement with the
of
Patel
Desai
Bhargav,
The
Shani,
Amol,
derivatised in to first order derivative; showed maximum
Results:
Patel
Chaudhari
Sitagliptin
in
Santsaran,
bulk
and
in
Formulation”, Int. J. Drug Dev. & Res., Oct-Dec 2011, 3(4): 194-199
label claim. The accuracy of the method was checked by recovery experiment performed at three different levels i.e.,
Copyright © 2010 IJDDR, Jain Pritam et al.
80%, 100% and 120 %. The % recovery was found to be in
This is an open access paper distributed under the
the range 98.54%– 99.98%. The low values of % R.S.D. are
copyright agreement with Serials Publication, which
indicative of the accuracy and reproducibility of the method. The precision of the method was studied as an
permits
unrestricted
use,
distribution,
and
intra-day, inter-day variations and repeatability. The %
reproduction in any medium, provided the original
R.S.D. value less than 2 indicate that the method is precise.
work is properly cited.
Ruggedness of the proposed method was studied with the help of two analysts.
Article History:------------------------
Conclusion: The above method was a rapid and cost-
Date of Submission: 15-10-2011
effective quality-control tool for routine analysis of sitagliptin in bulk and in pharmaceutical dosage form.
Date of Acceptance: 08-12-2011 Conflict of Interest: NIL Source of Support: NONE Introduction:
*Corresponding author, Mailing address: Jain Pritam Department of Pharmaceutical Chemistry, R. C. Patel Institute of Pharmaceutical Education and Research, Shirpur Dist Dhule MS, India 425405 E mail :
[email protected]
Sitagliptin
chemically
is
(3R)
(trifluoromethyl)-6,8-dihydro-5h-
-3-amino-1-[3[1,2,4]
triazolo
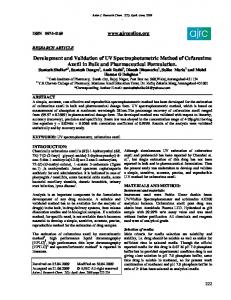
[3,4-c] pyrazin-7-yl]-4-(2,4,5-trifluorophenyl) butan1-one (Fig. 1), an oral anti-diabetic agent that blocks Dipeptidyl peptidase-4 (DPP-4) activity. Sitagliptin
Int. J. Drug Dev. & Res., Oct-Dec 2011, 3 (4): 194-199 Covered in Scopus & Embase, Elsevier
194
Jain Pritam et al: Development and validation of first order derivative UV-Spectrophotometric method for determination of Sitagliptin in bulk and in Formulation
increased incretin levels (GLP-1 and GIP) which
scanned in UV range (200 nm – 400 nm). In zero
inhibit glucagon release, in turn decreases blood
order
glucose, but more significantly increases insulin
maximum at 267 nm. The same spectrum was
secretion [1-3].
derivatized into first order using UV- probe software
Literature
survey
reveals
that
only
LC‐MS[4‐7]
methods were reported for the determination of
FULL Length Research Paper Covered in Index Copernicus with IC Value 4.68 for 2010
sitagliptin in plasma and urine of humans, rats and dogs
whereas
reported[8,
9].
two
colorimetric
methods
were
So far, no assay procedure has been
reported for the determination of this drug in its pharmaceutical formulations. Among the various methods available for the determination of drugs, spectrophotometry continues to be very popular, because of their simplicity, specificity and low cost.
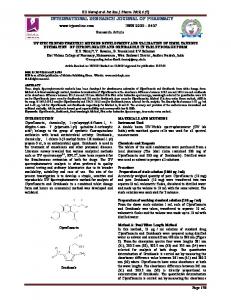
spectrum
Sitagliptin
showed
absorbance
of the UV-spectrophotometer. The amplitude of the trough was found at 275 nm (Fig. 2). Validation of the method: The method was validated in terms of linearity, accuracy, precision, and ruggedness. Linearity study: Different aliquots of Sitagliptin in range 1-6 ml were transferred into series of 10 ml volumetric flasks and the volume was made up to the mark with distilled water to get concentrations 10, 20, 30, 40, 50 and 60
This study presents new spectrophotometric method
µg/ml, respectively. The solutions were scanned on
for the determination of sitagliptin phosphate in bulk
spectrophotometer in the UV range 200 - 400 nm.
and pharmaceutical formulations. Accordingly, the
The spectrum was derivatized into first order using
objective of this study was to develop and validate the
UV-probe
first order derivative method for the estimation of
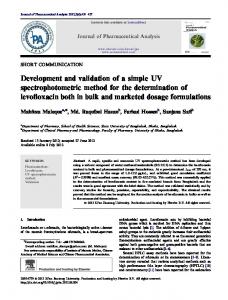
amplitude of the trough was recorded at 275 nm. The
sitagliptin in bulk and pharmaceutical formulation as
calibration plot was constructed as concentration vs.
per ICH guidelines[10].
amplitude (Fig. 3).
software
of
the
spectrophotometer,
Accuracy: Experimental:
To the preanalysed sample solutions, a known
Materials:
amount of standard stock solution was added at
Sitagliptin was a gift sample from Indoco Pharma,
different levels i.e. 80%, 100% and 120 %. The
Mumbai. All chemicals and reagents used were of
solutions were reanalyzed by proposed method.
analytical grade and purchased from Qualigens Fine
Precision:
Chemicals, Mumbai, India.
Precision of the method was studied as intra-day and
Preparation of standard stock solution:
inter-day
Accurately weighed 10 mg of Sitagliptin was
determined by analyzing the 20, 30 and 40 µg/ml of
transferred to 100 ml volumetric flask, dissolved in
Sitagliptin solutions for three times in the same day.
20 ml distilled water by shaking manually for 10 min.
Inter-day precision was determined by analyzing the
The volume was adjusted with the same up to the
20, 30 and 40 µg/ml of sitagliptin solutions daily for
mark to give final strength i.e. 100 µg/ml.
three days over the period of week.
Selection
of
wavelength
for
analysis
of
variations.
Intra-day
precision
was
Sensitivity:
Sitagliptin:
The sensitivity of measurements of Sitagliptin by the
Appropriate volume 1 ml of standard stock solution
use of the proposed method was estimated in terms
of Sitagliptin was transferred into 10 ml volumetric
of the Limit of Quanfication (LOQ) and Limit of
flask, diluted to mark with distilled water to give
Detection (LOD). The LOQ and LOD were calculated
concentration of 10 µg/ml. The resulting solution was
using equation LOD = 3.3 x N/B and LOQ = 10 x N/B, where, ‘N’ is standard deviation of the peak
195
Int. J. Drug Dev. & Res., Oct-Dec 2011, 3 (4): 194-199 Covered in Scopus & Embase, Elsevier
Jain Pritam et al: Development and validation of first order derivative UV-Spectrophotometric method for determination of Sitagliptin in bulk and in Formulation
FULL Length Research Paper Covered in Index Copernicus with IC Value 4.68 for 2010
areas of the drugs (n = 3), taken as a measure of
Method Validation:
noise, and ‘B’ is the slope of the corresponding
The proposed method was validated as per ICH
calibration curve.
guidelines. The solutions of the drugs were prepared
Repeatability:
as per the earlier adopted procedure given in the
Repeatability was determined by analyzing 30 µg/ml
experiment.
concentration of Sitagliptin solution for six times.
Linearity studies:
Ruggedness:
The linear regression data for the calibration curves
Ruggedness of the proposed method is determined
showed
for 30 µg/ml concentration of Sitagliptin by analysis
concentration range 10-60 µg/ml for Sitagliptin.
of aliquots from homogenous slot by two analysts
Linear regression equation was found to be Y =
using
0.0039 X + 0.0089 (r2 = 0.998). The result is
same
operational
and
environmental
good
linear
relationship
over
the
conditions.
expressed in Table 1.
Determination of Sitagliptin in bulk:
Accuracy:
Accurately weighed 10 mg of Sitagliptin was
The solutions were reanalyzed by proposed method;
transferred into 100 ml volumetric flask containing
results of recovery studies are reported in Table 2
20 ml distilled water and volume was made up to the
which showed that the % amount found was between
mark using same. Appropriate volume 0.6 ml of this
98.54% to 99.98% with %R.S.D. >2.
solution was transferred to 10 ml volumetric flask
Precision:
and volume was adjusted to mark using distilled
The
water. The resulting solution was scanned on
expressed in terms of % relative standard deviation
spectrophotometer in the UV range 200 - 400 nm
(% RSD). These result shows reproducibility of the
and
assay. The % R.S.D. values found to be less than 2, so
amplitude
of
corresponding
trough
was
precision
developed
determination of both the drugs in formulation
method
for
precise
for
was
were calculated from linear regression equations. proposed
method
method
that
of
this
the
measured at 275 nm. The concentrations of the drug Application
indicate
of
the
(Table 3).
pharmaceutical formulation:
Sensitivity:
For analysis of commercial formulation 5 ml of
The linearity equation was found to be Y = 0.0045 X
sitagliptin eye drop solution was taken in 100 ml
+ 0.0041. The LOQ and LOD for Sitagliptin were
volumetric flask and the volume was made up to the
found to be 2.38 µg and 7.24 µg, respectively.
mark
Repeatability:
with
distilled
water
to
give
100µg/ml
concentration. From this 0.6 ml was taken and
Repeatability was determined by analyzing 30 µg/ml
transferred to 10 ml volumetric flask and volume was
concentration of Sitagliptin solution for six times and
made upto the mark with distilled water to give 6
the % amount found was between 98% to 102% with
µg/ml
% R.S.D. less than 2 (Table 4).
concentration.
It
was
scanned
on
spectrophotometer in the UV range 200 - 400 nm.
Ruggedness:
The spectrum was derivatised into first order
Peak area was measured for same concentration
derivative and amplitude of the trough was recorded
solutions, six times. The results are in the acceptable
at 275 nm. The concentrations of the drug were
range for both the drugs. The results are given in
calculated from linear regression equation.
Table 5. The result showed that the % R.S.D. was less than 2%
Results and Discussion:
Determination of Sitagliptin in bulk:
Int. J. Drug Dev. & Res., Oct-Dec 2011, 3 (4): 194-199 Covered in Scopus & Embase, Elsevier
196
Jain Pritam et al: Development and validation of first order derivative UV-Spectrophotometric method for determination of Sitagliptin in bulk and in Formulation
The concentrations of the drug were calculated from linear regression equations. The % amount found was between 99.17% to 100.43% (Table 6). Application
of
proposed
method
for
Table 2: Recovery studies Preanalyzed sample solution (µg/ml)
Amount of drug added (µg/ml) (n=3) 0
pharmaceutical formulation: The spectrum was derivatised into first order
30
FULL Length Research Paper Covered in Index Copernicus with IC Value 4.68 for 2010
derivative and amplitude of the trough was recorded at 262 nm. The concentrations of the drug were calculated from linear regression equation. The %
% Recovery
% R.S.D.
29.91
98.54
1.38
24
53.97
99.98
1.40
30
59.92
98.68
1.44
36
65.94
99.54
1.33
*average of three estimates
amount found was between 97.36% to 101.31% (Table 7).
Amount recovered* (µg/ml) (n=3)
Table 3: Precision studies
reproducible and sensitive. The first order UV
Intra-day Inter-day precision* Precision* Concentration (n=3) (n=3) Component (µg/ml) Conc. % Conc. % found R.S.D. found R.S.D. 20 19.95 1.47 19.99 1.43 30 29.95 0.54 29.92 0.61 Sitagliptin 40 39.99 1.24 39.94 1.13
derivative
*average of three estimates
Conclusion: This first order UV spectrophotometric derivative technique
is
quite
method
simple, has
accurate,
been
precise,
developed
for
quantification of sitagliptin in tablet formulation. The validation procedure confirms that this is an
Table 4: Repeatability studies
appropriate method for their quantification in the plant material and formulation. It is also used in
Component
Amount taken (µg/ml) (n=6)
Amount found* (%)
%R.S.D.
Sitagliptin
30
99.63 ± 0.38
0.64
routine quality control of the raw materials as well as formulations containing this entire compound.
*average of six estimations
Acknowledgement: The authors are thankful to the Principal and
Table 5: Ruggedness studies
management, R.C. Patel Institute of Pharmaceutical Education and Research, Shirpur (M.S.), India for
Component
Amount taken (µg/ml) (n=3)
Sitagliptin
30
providing the required facilities to carry out this research work Table 1: Linearity study of Sitagliptin Sr. no.
Concentration µg/ml
Absorbance* Mean ± S.D. (n=6)
% R.S.D.
1
10
0.049 ± 0.001
1.21
2
20
0.086 ± 0.002
3
30
0.135 ± 0.004
197
Analyst II ±S.D. 98.90 ± 0.95
*average of six estimations Table 6: Analysis of Sitagliptin in bulk
1.63
Amount found (µg) 29.94737
Amount found (%) 99.12
1.66
29.97368
99.56
29.97368
99.56
29.71053
99.17
29.97368
99.56
4
40
0.166 ± 0.006
1.83
5
50
0.211 ± 0.004
1.15
6
60
0.243 ± 0.006
1.37
* average of five estimations
Amount Found (%) * Analyst I ±S.D. 99.04 ± 1.3
Concentration (µg/ml)
30
30.02632
100.43
Mean ± S.D.
29.93 ± 0.102
98.90 ± 1.71
% R.S.D.
1.73
1.73
Int. J. Drug Dev. & Res., Oct-Dec 2011, 3 (4): 194-199 Covered in Scopus & Embase, Elsevier
Jain Pritam et al: Development and validation of first order derivative UV-Spectrophotometric method for determination of Sitagliptin in bulk and in Formulation Table 7: Analysis of formulation Amount found (µg) 29.89474
Amount found (%) 98.24
29.97368
99.56
29.84211
97.36
29.97368
99.56
29.94737
99.12
30.07895
101.31
Mean ± S.D.
29.95 ± 0.08
99.19 ± 1.34
% R.S.D.
1.35
1.35
Conc. (µg/ml)
30
FULL Length Research Paper Covered in Index Copernicus with IC Value 4.68 for 2010
Figure 3: Calibration curve of Sitagliptin at 275 nm References: 1)
Herman G, Stevens C, Van Dyck K, Bergman A, Yi B, De Smet M, et al. Pharmacokinetics and pharmacodynamics of sitagliptin, an inhibitor of dipeptidyl peptidase IV, in healthy subjects: results from
two
randomized,
double‐blind,
placebo‐controlled studies with single oral doses.
Figure 1: Chemical structure of sitagliptin
Clin Pharmacol Ther 2005; 78: 675‐688. 2)
U.S. Food and Drug Administration. FDA Approves New Treatment for Diabetes. 2006.
3)
Herman G, Bergman A, Liu F, Stevens C, Wang A, Zeng
W,
et
pharmacodynamic
al.
Pharmacokinetics
effects
of
the
oral
and DPP‐4
inhibitor sitagliptin in middle‐aged obese subjects. J Clin Pharmacol 2006; 46: 876‐886. 4)
Stella Vincent H, James Reed R, Bergman AJ, Elmore CS, et al. Metabolism and excretion of dipeptidase 4 inhibitor (14C) sitagliptin in humans. Drug Metab Dispos 2007; 35: 533‐538.
5)
Zeng W, Musson DG, Fisher AL, Chen L, Schwartz MS, Woolf EJ. Determination of sitagliptin in human urine and hemodialysate using turbulent flow
online
extraction
and
tendem
mass
spectrophotometry. J Pharm Biomed Anal 2008; 46: 534‐542. 6)
Figure 2: First Order Derivative Spectrum of Sitagliptin at 275 nm
Nirogi R, Kandikere V, Mudigonda K, Komarneni P, Aleti R. Sensitive liquid chromatography tandem mass spectrometry method for the quantification of sitagliptin, a DPP‐4 inhibitor, in human plasma
Int. J. Drug Dev. & Res., Oct-Dec 2011, 3 (4): 194-199 Covered in Scopus & Embase, Elsevier
198
Jain Pritam et al: Development and validation of first order derivative UV-Spectrophotometric method for determination of Sitagliptin in bulk and in Formulation
using liquid‐ liquid extraction. Biomed Chromatogr 2008; 22: 214‐222. 7)
Beconi MG, Reed JR, Yohannes Teffera, Yuan‐Qing Xia, Kochansky CJ, Liu D Q, et al. Disposition of the Dipeptidyl Peptidase 4 Inhibitor Sitagliptin in Rats
FULL Length Research Paper Covered in Index Copernicus with IC Value 4.68 for 2010
and Dogs. Drug Metab Dispos 2007; 35: 525‐532. 8)
Balasekran C, Rani P. Development and validation of
spectrophotometric
method
for
the
determination of dpp-4 inhibitor, sitagliptin, in its pharmaceutical dosage forms. Int J Pharm Pharm Sci 2010; 2(4): 1-138-142. 9)
El-Bagary
RI,
Elkady
Spectroflourometric
and
EF,
Ayoub
BM.
spectrophotometric
methods for the determination of sitagliptin in binary mixture with metformin and ternary mixture with metformin and sitagliptin alkaline degradation product. Int J Biomed Sci 2011; 7(1): 62-67. 10) ICH
harmonized
Tripartite
Guideline,
Recommended for Adoption at Step 4 of the ICH Process on 6 November 1996.
199
Int. J. Drug Dev. & Res., Oct-Dec 2011, 3 (4): 194-199 Covered in Scopus & Embase, Elsevier