Dec 22, 1997 - (Received 15 August 1997). The dynamics of a magnetic particle system consisting of ultrafine Fe-C particles of monodisperse nature has been ...
VOLUME 79, NUMBER 25
PHYSICAL REVIEW LETTERS
22 DECEMBER 1997
Dynamics of an Interacting Particle System: Evidence of Critical Slowing Down C. Djurberg, P. Svedlindh, and P. Nordblad Department of Materials Science, Uppsala University, Box 534, S-751 21 Uppsala, Sweden
M. F. Hansen, F. Bødker, and S. Mørup Department of Physics, Building 307, Technical University of Denmark, DK-2800 Lyngby, Denmark (Received 15 August 1997) The dynamics of a magnetic particle system consisting of ultrafine Fe-C particles of monodisperse nature has been investigated in a large time window, 1029 104 s, using Mössbauer spectroscopy, ac susceptibility, and zero field cooled magnetic relaxation measurements. By studying two samples from the same dilution series, with concentrations of 5 and 6 3 1023 vol %, respectively, it has been found that dipole-dipole interaction increases the characteristic relaxation time of the particle system at all temperatures investigated. The results for the most concentrated particle assembly are indicative of collective magnetic dynamics and critical slowing down at a finite temperature, Tg ø 40 K. Close to and below the transition temperature, an aging phenomenon is observed, another manifestation of collective magnetic dynamics. [S0031-9007(97)04826-6] PACS numbers: 75.50.Tt, 75.50.Lk, 75.50.Mm
The dynamics of magnetic nanoparticle systems is currently a subject of considerable interest. In a noninteracting particle assembly the superparamagnetic relaxation time essentially follows the predictions of the Néel-Brown theory [1,2], implying relaxation times from picoseconds to geological time scales depending on the magnetic anisotropy, the particle volume, temperature, and applied magnetic field. Different approximate expressions for the relaxation time of noninteracting-particle systems [2,3] have been derived. Several experimental studies support the validity of the theoretical models [4–6]. In particle assemblies with significant dipole-dipole interaction the magnetic relaxation is known to be affected by the interaction. Ac susceptibility and dc magnetization measurements indicate an increase in the characteristic relaxation time with increasing interaction strength [7– 10], while Mössbauer results in some cases indicate the opposite behavior [11,12]. Different and conflicting models have been proposed to explain the experimental results [7,11,13,14]. In most cases, these models address the question of what happens to the energy barrier of the individual particle magnetic moment as the interaction strength increases and less attention is given to the more complex problem of having collective dynamics contributing to the observed magnetic relaxation. If collective particle behavior is an essential ingredient in an interacting particle assembly, it may be possible that a phase transition to a super spin-glass phase occurs at a finite temperature, since such a system exhibits both random and frustrated magnetic interactions. In this Letter, Mössbauer, ac susceptibility, and zero field cooled (ZFC) magnetic relaxation measurements have been performed to study the dynamics of a nanoparticle system of nearly monodisperse nature. By studying two samples with different concentrations of magnetic particles, both taken from the same batch of ferrofluid,
the effects of dipole-dipole interaction on the magnetic dynamics have been scrutinized. For the first time, it is found that the dynamics of a concentrated nanoparticle sample displays critical slowing down at a finite temperature, reminiscent of the critical behavior observed in spin-glass materials [15]. Close to and below the critical temperature, the magnetic relaxation displays an aging phenomenon, giving further support for a low temperature super spin-glass phase in the concentrated particle system. The experiments were performed on two samples consisting of nanosized particles of amorphous Fe12x Cx with x ø 0.22. The particle system was prepared as a ferrofluid by thermal decomposition of FesCOd5 in decalin using oleic acid as a surfactant. The details of the preparation technique are described in Ref. [16]. After preparation, the ferrofluid was up-concentrated and different concentrations were prepared by dilution of the concentrated product. The nominal concentrations of the samples used in this study were e 5 and e 6 3 1023 vol %, respectively. The concentrated sample was studied by transmission electron microscopy (TEM). These studies [17] showed a close to spherical particle shape and that there is no significant tendency of particle agglomeration. The volume weighted particle size distribution as seen in TEM fitted well to a log-normal distribution with a remarkably narrow width of sV 0.22 and a median volume of Vm 5.3 3 10226 m3 (dm ø 4.7 nm) [17]. All measurements were performed at low temperatures with the carrier liquid frozen, implying that the particles were fixed randomly in the sample. Since the frozen carrier liquid provides an insulating matrix for the magnetic particles and since the particles are coated with a surfactant layer preventing the particles from agglomerating, the interparticle magnetic interaction is of dipole-dipole type. Assuming a homogeneous dispersion, the mean
5154
© 1997 The American Physical Society
0031-9007y97y79(25)y5154(4)$10.00
VOLUME 79, NUMBER 25
PHYSICAL REVIEW LETTERS
interaction energy between two neighboring particles can be estimated from Ed2d ykB sm0 y4pkB dMs2 Vm e, where Ms is the saturation magnetization of the Fe12x Cx particles. Using the low temperature value of the saturation magnetization, Ms ø 1.5 3 106 Aym, this expression gives Ed2d ykB 44 K and Ed2d ykB 0.05 K for the concentrated and dilute samples, respectively. A specially designed SQUID magnetometer [18] was used for the ac susceptibility and the magnetic relaxation measurements. The magnitude of the ac fields were hac 5 mOe and hac 0.1 Oe for the concentrated and dilute samples, respectively. The covered ac frequency ranges were 17 mHz # vy2p # 51 kHz for the concentrated sample and 17 mHz # vy2p # 5.1 kHz for the dilute sample. The dynamics of the particle assemblies was also studied by ZFC magnetic relaxation measurements. In the ZFC experiments the sample was cooled in zero field from a high temperature where the sample showed a superparamagnetic behavior. When reaching the measurement temperature, T, the sample was equilibrated a wait time tw before a weak magnetic field was applied and the magnetization, MsT , td, recorded in the time window 3 3 1021 , t , 104 s after the field application. The fields used were h 1 Oe and h 10 Oe for the concentrated and dilute samples, respectively. The Mössbauer data were collected using a 57Co source in a Rh matrix. The ac susceptibility measurements cover observation times (1yv) ranging from 3 3 1026 to 10 s. By use of ZFC relaxation measurements it is possible to extend the experimentally accessible observation time window to longer time scales. The results from ac susceptibility and ZFC relaxation measurements are related by [19] MsT , tdyh xsT , td ø x 0 sT, vd
22 DECEMBER 1997
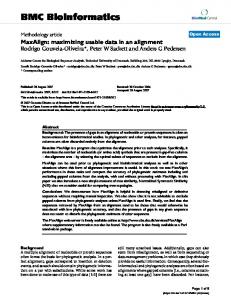
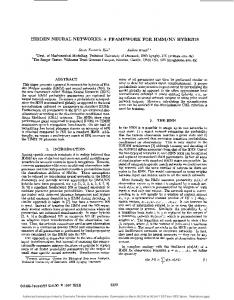
FIG. 1. (a) x 0 sT , vd (solid lines) and xsT , td (symbols) vs temperature for the 5 vol % sample. The different curves correspond to different observation times t 1yv (top to bottom): 10 4, 3 3 103 , 10 3, 3 3 102 , 10 2, 30, 10, 3, 1, 3 3 1021 , 1021 , 3 3 1022 , 1022 , 3 3 1023 , 1023 , 3 3 1024 , 1024 , 3 3 1025 , and 1025 s. (b) x 00 svd vs temperature for the 5 and 6 3 1023 vol % samples. The results of the noninteracting sample has been multiplied by the ratio between the concentrations of the two samples. The different curves correspond to different observation times 10, 1, 1021 , 1022 , 1023 , 1024 , and 1025 s for the 5 vol % sample, and 10, 1, 1021 , 1022 , 1023 , and 1024 s for the 6 3 1023 vol % sample.
(1)
with t 1yv. In Fig. 1(a), xsT, td and x 0 sT , vd are plotted for the concentrated sample. The low temperature behavior of the equilibrium susceptibility, xeq sT d, is drawn, extrapolating the high temperature behavior of the xsT d curves which in the temperature region 48 to 100 K obey a Curie-Weiss law, x 0.62ysT 1 11.40d femuyOeg. The out-of-phase component of the ac susceptibility, x 00 sT , vd, is shown in Fig. 1(b). The corresponding results for the dilute sample has, for comparison, been included in this figure. In accordance with observations made on other systems [7–10], the characteristic frequency dependence of the ac susceptibility is shifted toward higher temperatures for the interacting sample. It is obvious from this figure that at temperatures near the peaks of x 00 sTd for the concentrated sample the corresponding out-of-phase components of the dilute sample remain virtually zero, indicating that the characteristic relaxation times, t, of the dilute sample at these temperatures are much shorter than the time scale of the ac susceptibility experiment, t ø 1yv. Such a clear separation between the characteristic relaxation times of a concentrated and a dilute sample, taken from the same
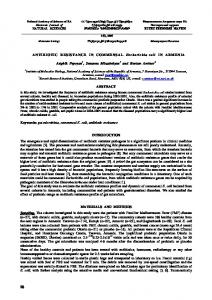
batch of magnetic nanoparticles, has not been reported previously. A method, which aims at studying the temperature dependence of the longest relaxation time of the magnetic system, focuses on small departures of the xsT, td curves from the equilibrium susceptibility curve. The relaxation time t equals t and the corresponding temperature is found from the ratio xsT , tdyxeq , which should be set to a fixed value close to 1 [20]. In Fig. 2, the relaxation time, as defined from the condition xsT , tdyxeq 0.98, is plotted versus temperature for the concentrated sample. The corresponding results of the Mössbauer experiments are also plotted. The latter results were obtained by measuring the count rate at zero velocity as a function of temperature. In this way one can estimate a temperature at which essentially all particles have a relaxation time faster than about 5 3 10210 s [21]. This time scale corresponds to the onset of a broadening of the superparamagnetic component. The relaxation times for the dilute sample have been included for comparison. The dashed line corresponds to the result of fitting a Vogel-Fulcher law to the temperature dependence of the relaxation time of the 5155
VOLUME 79, NUMBER 25
PHYSICAL REVIEW LETTERS
FIG. 2. Relaxation time vs temperature for the 5 vol % (filled symbols) and 6 3 1023 vol % (open symbols) samples. The dashed line was obtained by fitting a Vogel-Fulcher law to the results of the dilute sample. The inset shows the critical slowing down analysis made for the concentrated sample using relaxation time data corresponding to the temperature interval 45 –65 K.
dilute sample, t 1.4 3 10211 3 expf420ysT 2 10.2dg s. Fitting an Arrhenius law to the same experimental data yields too small a value for the microscopic relaxation time t0 , which indicates that even this sample displays some interparticle interactions. This suggests that the dilute sample is not completely homogeneous and that there exists small agglomerates of particles in this sample. To investigate if the dynamics of the concentrated sample shows critical slowing down, one can make use of the dynamic scaling hypothesis, which states that the characteristic relaxation time close to the transition temperature is related to the particle-particle correlation length, j, according to t ~ j z . Since the correlation length diverges at the transition temperature, the relaxation time is expected to obey the temperature dependence [22] t tp sTyTg 2 1d2zn ,
T . Tg ,
(2)
where Tg is the transition temperature, tp is related to the relaxation time of the individual particle magnetic moments, and zn is a critical exponent. The result of the analysis, using data corresponding to the temperature range 45–65 K, is shown in the inset of Fig. 2. The value of zn 11 6 3 is in good agreement with values derived for spin-glass materials [15]. The value of tp 1026 s may seem too large when compared to values derived for spin glasses. However, in spin glasses tp is determined by the spin flip time of the atomic magnetic moments (ø 10213 s), while tp in a magnetic particle system is determined by the flip time of the noninteracting particle magnetic moments, which essentially should follow a temperature dependence as that shown in Fig. 2 for the relaxation time of the dilute sample. Consulting this figure, it is seen that the value extracted for tp from the critical scaling analysis is in accordance with the relaxation times of the dilute system in the temperature region used for the scaling analysis. The success of fitting a VogelFulcher law to the temperature dependence of the relaxa5156
22 DECEMBER 1997
tion time of the dilute sample indicates some influence of interparticle interaction even for this sample. This effect, however, should not, in the temperature range used for the scaling analysis, significantly change the relaxation times of the dilute sample from that of a perfectly noninteracting sample. Neglecting the temperature dependence of tp in the dynamic scaling analysis probably yields slightly too large a value for the exponent zn. The error introduced by this is, however, smaller than the margins of error given above for extracted value of the critical exponent. Also, it is worth noting that using the maxima in the x 0 sT, vd curves to determine the temperatures corresponding to different observation times 1yv, yield, within the experimental uncertainty, the same values of zn and tp as those given above. The temperature dependence of the characteristic relaxation time of a spin glass can also be obtained from the frequency dependence of x 00 ysvx 0 d. It can be shown that the following relation holds [22,23] x 00 yvx 0 ~ t 12byzn ~ sT yTg 2 1d2zn1b , vt ! 0 ,
(3)
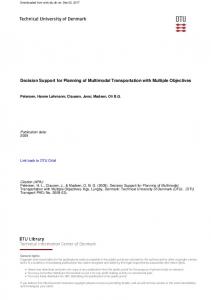
where b is the order parameter critical exponent, which for spin-glass materials typically takes a value in the range 0.6–0.8 [20]. In the zero frequency limit, the left-hand side of Eq. (3), for each temperature, attains a frequency independent value related to the characteristic relaxation time of the magnetic system. Figure 3 shows x 00 ysvx 0 d vs vy2p for the concentrated sample. In the low frequency limit and at a given temperature it can be seen that x 00 ysvx 0 d approaches a frequency independent value. Fitting the values thus extracted to the power-law divergence in Eq. (3) gives, using Tg 40 K, zn 2 b 10.4. Assuming the critical exponent b for the interacting particle system to take a value close to that of archetypal spin glasses, this result is in good agreement with the result of the previous scaling analysis. The ZFC relaxation rate, S 1yh 3 ≠My≠ lnstd, for the concentrated sample is displayed in Fig. 4 for the
FIG. 3. x 00 yvx 0 vs vy2p at different temperatures for the 5 vol % sample.
VOLUME 79, NUMBER 25
PHYSICAL REVIEW LETTERS
22 DECEMBER 1997
This work was supported by the Swedish Science Research Council (NFR) and by the Danish Council for Technical Research and the Danish Council for Natural Science.
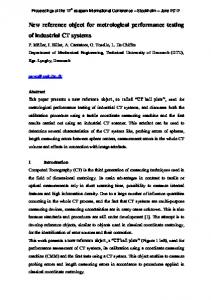
FIG. 4. Relaxation rate S vs time at the temperatures 30, 40, and 50 K for the 5 vol % sample. The wait time tw at constant temperature before applying the probe field was 10 2 s (open symbols) and 10 4 s (filled symbols).
temperatures 30, 40, and 50 K. At each temperature, the time dependence of the ZFC magnetization has been recorded using two different wait times, tw 102 s and tw 104 s. At and below the extracted transition temperature, a wait time dependence of the relaxation rate is observed. At T 50 K, the wait time dependence cannot be resolved in the experimental time window. This behavior is similar to the behavior observed in spin-glass materials [20], where at temperatures below the spin-glass temperature, the ZFC relaxation displays a clear wait time dependence, while at temperatures higher than this temperature the wait time dependence vanishes in the experimental wait time and observation time windows. The effect of the wait time on the magnetic relaxation seen in Fig. 4 is of the same magnitude as that observed for an interacting maghemite sample in Ref. [9]. It is worth pointing out, however, that the wait time dependence of the magnetic relaxation is weaker in the magnetic particle systems as compared to that of an archetypal spin glass [20]. It has been shown that in this nearly monodisperse system of magnetic nanoparticles we are able to clearly separate the relaxation of the particles in the dilute sample, primarily governed by the anisotropy energy barrier, from effects induced by magnetic interparticle interactions. In a range of temperatures and time scales we have observed that the magnetic relaxation in the concentrated sample is governed by collective particle dynamics. The collective behavior has been evidenced by (i) critical slowing down of the dynamics at a finite temperature Tg ø 40 K and (ii) the appearance of magnetic aging at low temperatures, thus giving evidence of a low temperature super spin-glass phase.
[1] L. Néel, Ann. Geophys. 5, 99 (1949). [2] W. F. Brown, Jr., Phys. Rev. 130, 1677 (1963). [3] W. T. Coffey, D. S. F. Crothers, J. L. Dormann, L. J. Geoghegan, Yu. P. Kalmykov, J. T. Waldron, and A. W. Wickstead, Phys. Rev. B 52, 15 951 (1995). [4] A. Labarta, O. Iglesias, Ll. Balcells, and F. Badia, Phys. Rev. B 48, 10 240 (1993). [5] H. D. Williams, K. O’Grady, M. El Hilo, and R. W. Chantrell, J. Magn. Magn. Mater. 122, 129 (1993). [6] T. Jonsson, J. Mattsson, P. Nordblad, and P. Svedlindh, J. Magn. Magn. Mater. 168, 269 (1997). [7] J. L. Dormann, L. Bessais, and D. Fiorani, J. Phys. C 21, 2015 (1988). [8] W. Luo, S. R. Nagel, T. F. Rosenbaum, and R. E. Rosensweig, Phys. Rev. Lett. 67, 2721 (1991). [9] T. Jonsson, J. Mattsson, C. Djurberg, F. A. Khan, P. Nordblad, and P. Svedlindh, Phys. Rev. Lett. 75, 4138 (1995). [10] J. Zhang, C. Boyd, and W. Luo, Phys. Rev. Lett. 77, 390 (1996). [11] S. Mørup and E. Tronc, Phys. Rev. Lett. 72, 3278 (1994). [12] J. Z. Jiang, S. Mørup, T. Jonsson, and P. Svedlindh, Proc. ICAME-95, edited by I. Ortalli, (SIF, Bologna, 1996), p. 529. [13] J. L. Dormann et al., Phys. Rev. B 53, 14 291 (1996). [14] S. Mørup, Europhys. Lett. 28, 671 (1994). [15] K. Gunnarsson, P. Svedlindh, P. Nordblad, L. Lundgren, H. Aruga, and A. Ito, Phys. Rev. Lett. 61, 754 (1988). [16] J. van Wonterghem, S. Mørup, S. W. Charles, and S. Wells, J. Colloid Interface Sci. 121, 558 (1988). [17] M. F. Hansen, F. Bødker, S. Mørup, C. Djurberg, and P. Svedlindh, J. Magn. Magn. Mater. (to be published). [18] J. Magnusson, C. Djurberg, P. Granberg, and P. Nordblad, Rev. Sci. Instrum. 68, 3761 (1997). [19] L. Lundgren, P. Svedlindh, and O. Beckman, Phys. Rev. B 26, 3990 (1982). [20] P. Nordblad and P. Svedlindh, in Spin Glasses and Random Fields, edited by P. A. Young (World Scientific, Singapore, 1997). [21] S. Linderoth, Ll. Balcells, A. Labarta, J. Tejada, P. V. Hendriksen, and S. A. Sethi, J. Magn. Magn. Mater. 124, 269 (1993). [22] A. T. Ogielski, Phys. Rev. B 32, 7384 (1985). [23] B. Leclercq and C. Rigaux, Phys. Rev. B 48, 13 573 (1993).
5157