In many cases objects can be differentiated with distinctive inten- sity ranges, a method ..... voxel resolution in contrast to digital-differential-analyzer techniques ...
High Quality Rendering of Attributed Volume Data Ulf Tiede
Thomas Schiemann
Karl Heinz H¨ohne
Institute of Mathematics and Computer Science in Medicine � University Hospital Eppendorf, Hamburg
Abstract For high quality rendering of objects segmented from tomographic volume data the precise location of the boundaries of adjacent objects in subvoxel resolution is required. We describe a new method that determines the membership of a given sample point to an object by reclassifying the sample point using interpolation of the original intensity values and searching for the best fitting object in the neighbourhood. Using a ray-casting approach we then compute the surface location between successive sample points along the viewingray by interpolation or bisection. The accurate calculation of the object boundary enables a much more precise computation of the gray-level-gradient yielding the surface normal. Our new approach significantly improves the quality of reconstructed and shaded surfaces and reduces aliasing artifacts for animations and magnified views. We illustrate the results on different cases including the Visible-Human-Data, where we achieve nearly photo-realistic images. CR Categories: I.3.3 [Computer Graphics]: Picture/Image Generation—Display algorithms; I.3.7 [Computer Graphics]: Three-Dimensional Graphics and Realism—Color, shading, shadowing and texture Keywords: partial-volume-effect, ray-casting, tomographic data, Visible-Human-Project
1
INTRODUCTION
Three-dimensional (3D) visualization of tomographic volume data such as Computer-Tomography (CT) or Magnetic-ResonanceImaging (MR) is an important aid for diagnosis, treatment planning, teaching and other applications. The common feature of these imaging modalities is that different objects are characterized as different levels of the measured intensity values. At the boundary of adjacent objects the intensity jumps from one level to the other. However, due to the limited spatial resolution of the scanning devices the intensity of the voxels containing the boundary is averaged. This effect is called the partial-volume-effect. A variety of 3D-visualization methods using this effect implicitly have been published, e.g.
�
�
volume-rendering
One well-known algorithm for isosurface reconstruction is Marching-Cubes [7] which produces polygonal meshes of the structures that are within a given intensity range. The polygonal object representation can be rendered very fast on special graphics hardware. The disadvantage is that only surfaces can be displayed, because the information about the interior of the object contained in the original intensity values is lost. However, these values might be of great concern for diagnostic purposes. In the volume-rendering approach originally investigated by [1, 6] an opacity value is computed for each voxel by assigning color or transparency values to the original gray values and weighting them with the magnitude of the gray-level-gradient at the voxel position. A voxel with a high opacity is less transparent than a voxel with a lower value. During ray-casting the voxels are shaded and weighted with their respective opacity yielding multiple transparent surfaces, which are difficult to interpret [13]. Although volume-rendering produces nice looking images most medical applications require an explicit object representation that allows measurements and removal of structures which obscure the view to the objects of interest. In many cases objects can be differentiated with distinctive intensity ranges, a method known as threshold segmentation. Typically the average intensity value of adjacent objects is used for thresholding. An intensity range for an object is then specicified using a lower and an upper threshold value. However, if different objects share the same intensity range an explicit assignment which voxel belongs to which object is required. We use morphological operations and connected-component-analysis as described in [4]. In difficult cases the segmentation has to be done manually. The result of the segmentation process is an additional volume containing discrete attribute values for each voxel about its membership to a certain organ. These attribute values trigger the individual visualization of the respective objects.
Problem
isosurface reconstruction and
� http://www.uke.uni-hamburg.de/idv
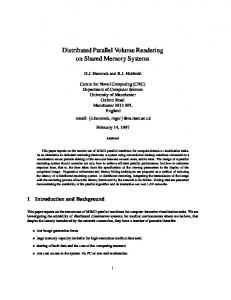
Ray-casting for visualizing sampled volume data has been elaborately described in the literature [5, 11, 15]. The classical approach uses discrete scan-conversion algorithms to access the attribute values which control the visualization of the objects. The pitfall of this method is that the subvoxel resolution of the viewing ray is lost which causes staircase looking surfaces of the objects (fig. 1 left). For technical reasons or patient care the enhancement of the spatial resolution of the volume data to reduce this effect is not possible in most cases. Although the real boundary of an object cannot be reconstructed exactly, for realistic and high resolution renderings of attributed volume data a better approximation of the surface than the arbitrary voxel boundaries is required (fig. 1 right). None of the methods published so far accomplish this for segmented data.
1. the counter is “0”, i.e. no fitting object was found, so the sample position is marked unclassified; 2. the counter is “1”, i.e. the interpolated intensity value fits exactly to one object definition. Take the attribute value of this object. This is the normal situation;
Figure 1: Classical ray-casting using discrete scan-conversion produces staircase looking surfaces (left). Aim is a better approximation of the object boundaries in subvoxel resolution (right).
2
METHOD
2.3 Interpolation of the surface location
In the following section we describe a new technique for the reconstruction of object boundaries in subvoxel resolution based on the object classification resulting from the segmentation step.
2.1 Key idea We propose the following scheme:
� � � � �
geometrically correct ray-casting using floating-point calculation instead of discrete scan-conversion; reclassification of the sample position by interpolating the gray values and searching for the best fitting attribute value in the 2 2 2 neighbourhood;
� �
interpolation of the surface location between successive sample points; computation of the surface normal at the subvoxel surface location using the gray-level-gradient; detection and handling of special situations where no threshold boundary exists as is the case for manually segmented objects.
The most difficult thing is to determine the attribute value at an arbitrary subvoxel position, because it can be different from the value at the nearest neighbour position as it was originally assigned to the voxel by the segmentation process.
2.2 Computation of the attribute value We compute the attribute value at a particular subvoxel sample position of the viewing ray as follows:
� � �
�
3. the counter is “2” or greater. In this case the classification condition of more than one object is true. A situation that occurs e.g. for manually segmented objects. For instance the gray matter of the brain can be classified using thresholding, the individual gyri forming the gray matter cannot be distinguish this way. A simple solution for these critical areas is to use the attribute value of the nearest-neighbour voxel. However, this would result in staircase surfaces and introduces aliasing. So we propose an interpolation scheme based on the attribute values (see section 2.5).
initialize a counter to zero; calculate the gray value at the sample position using tri-linear or higher order interpolation (e.g. B-splines);
� �
for each attribute voxel in the 2 2 2 neighbourhood of the sample position check if the gray value is within the intensity range of the respective object definition. If the value is inside increment the counter. Each distinct object is considered only once; after all neighbours have been tested the counter is in one of three states:
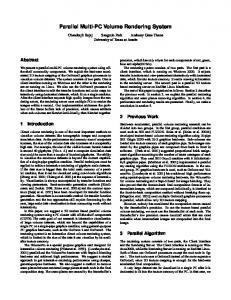
In the previous step the object membership of the sample position on the viewing ray was computed. For a realistic rendering we need a precise calculation of the surface orientation. For tomographic data the gray-level-gradient is the superior method to approximate the surface normal [3, 9]. However, the sample position is in general not on the boundary, but somewhere inside the object, therefore calculating the gradient at the sample position would introduce aliasing. The boundary of the object must be located between the current and the previous sample position. (Otherwise the previous position would have triggered the visualization.) A first approximation is to linear interpolate the boundary between successive sample points Pi,1 and Pi in the following way, 1. calculate the gray-level intensities gi,1 and gi at the respective sample points. (These values have already been computed for the attribute determination, so we use them again.) 2. given the threshold t of an object the location of its boundary B is interpolated as B = Pi
, s (P , P ,1 ) i
i
with s =
t gi
, g ,1 , , g ,1 i
i
where t is the lower bound of the intensity range if gi,1 < t, otherwise t is the upper bound. Thus the distance between Pi,1 and Pi is divided with the same ratio as s divides gi,1 and gi . However, tri-linear interpolation of the intensities produces curved boundaries between the regions seperated by a threshold t. This is demonstrated in fig. 2. Given two sample points along the viewing ray and their respective intensity values linear interpolation yields the object boundary at B1 . Besides the incorrect location of the boundary it is important to realize that the value of B1 depends of the sample positions, which themselves depend on the viewing parameters and therefore introduces aliasing in animated sequences. We also notice a C 1 discontinuity of the gray values along the ray at the position where the neighbourhood for the interpolation changes. Although an analytical solution to compute the correct boundary B2 might exist (at least for linear interpolation) for simplicity reasons we have implemented a bisection algorithm that approximates B2 through bisecting the line between Pi,1 and Pi and recalculation of g and s until g t < ". Choosing different values for " enables control of accuracy versus speed. This scheme also works correctly for higher order interpolation methods like cubic-splines as long as they are well-behaved and do not produce multiple extrema on the intensity profile between successive sample points.
j ,j
Figure 3: Depending on the intensity ranges assigned to the objects different surface boundaries exist. For manually segmented objects the boundary is not unique, because the intensity ranges overlap (right). time and the accuracy of small structures has to be made. We found a sample point distance that is about the pixel size of the resulting image is a practical solution.
Figure 2: Linear interpolation between sample points results in an object boundary at B1 . Bisecting the line between Pi,1 and Pi yields a better approximation to the correct result at B2 . Notice the C 1 discontinuity where the neighbourhood changes.
Depending on the segmentation different situations for the location of the object boundary occur (fig.3),
� � �
exactly one boundary exists if the intensity ranges of adjacent objects are in touch; if the intensity ranges form a gap there are two surfaces. The one we take depends on the viewing direction (normally the backfacing surface is not interesting). The area between the surfaces is unclassified; in cases where the intensities of the objects overlap, e.g. manual segmentation, the boundary is not unique. This situation is detected as follows, 1. if the gray value gi at position Pi is inside the intensity range of object Oi and gi,1 at position Pi,1 is outside take the boundary of object Oi ; 2. if gi as well as gi,1 are inside Oi try if the threshold of object Oi,1 forms a boundary, i.e. gi,1 is inside Oi,1 and gi is outside Oi,1 ; 3. if neither threshold produce a boundary, as is the case for manually segmented objects, we calculate the g 0 s using interpolated attribute values (see section 2.5), which then produce a unique boundary.
2.4 Detecting thin and small objects The combination of discrete attribute voxels and thresholding interpolated intensities at the sample positions along the viewing can produce very small and thin objects which might get lost if the sampling rate is too large. This results in serious aliasing artifacts, which prominently occur in animated sequences. Our new method computes the correct attribute value at any arbitrary subvoxel position and therefore enables classical oversampling (fig. 4). As the Nyquist frequency is not known a tradeoff between computation
Figure 4: The classification driven attribute computation enables oversampling so that even small and thin objects are rendered correctly.
2.5 Interpolating attribute values Although the described methods work well for normal situations there still remains a number of problematic situations, where the attribute value cannot be determined using additional threshold classification. These situations occur especially where objects have been segmentated manually, however, the affected regions are generally small, so only a few voxels are involved. Therefore our approach here is to generate interpolated values from the discrete attribute values themselves. To check if a sample position is inside of a specific object we
� �
1. create a binary subvolume where each voxel in the 2 2 2 neighbourhood of the sample position is set to “1”, if the attribute value in the corresponding attribute volume is the same we are testing. Otherwise the voxel is marked “0”; 2. compute a tri-linear interpolated value of the binary volume at the sample position; 3. if the interpolated value is less than 0:5 the position is outside of the object, otherwise it is inside. Figure 5 shows some of the surfaces generated by the 256 possible configurations of 8 neighboured “binary” voxels. This scheme can be easily extended to a larger neighbourhood, e.g. 4 4 4 for higher order interpolation and the calculation of the gradient for the surface normal.
� �
2.5.1 Extension for multi-modality volume data The described method for determining the attribute value of a given sample position in subvoxel resolution can be easily extended for
Figure 6: A more realistic object color is achieved when interpolated underneath the surface.
3
RESULTS
We integrated the methods into our VOXEL-MAN visualization system and applied them to different segmented volumes. The first example is the “standard” MR volume of a head used by many groups, which we segmented into over 200 constituents [2] (fig.7).
� �
Figure 5: Interpolation of attribute values in a 2 2 2 neighbourhood. Most attribute configurations yield smooth surfaces. The surfaces are complementary (e.g. 1st row middle and 2nd row left), so overlapping cannot occur.
multi-modality data such as the Visible-Human-Dataset (see section 3.1) which provides colored anatomical cross-sectional images together with registered CT scans of the frozen cadaver. This allows the segmentation of bony structures from the CT volume while all other structures are better segmentable from the anatomical data. The classification of different objects depends then on different volumes. We therefore changed the basic algorithm in section 2.2 in the following way: 1. determine all distinct attribute values in the neighbourhood; 2. compute an interpolated intensity value for each of these attribute values from their respective classification volume; (For each different volume this value is computed only once independant how many attributes refer to it.) 3. increase the counter if the interpolated value fits into the intensity range of the respective object; The remainder of the algorithm is the same. This simple extension is not restricted to two volumes but allows a different volume for the classification of each distinct object. Calculating surface color One interesting aspect of the Visible-Human-Dataset is that in contrast to tomographic data, which provide no color information, one can use the rgb-tuples to improve the realism of the surface appearance. Instead of assigning an artificial color to an object description, which is then attenuated by a light reflection model, each distinct surface location can be shaded individually using its respective color. Again for high quality rendering the rgb-values have to be interpolated. However, if one interpolates the color directly at the surface boundary a mixture of the colors of the adjacent objects results. To get a more realistic color we can shift the interpolation center along the surface normal underneath the surface (fig. 6).
Figure 7: Reconstruction of the “standard” MR head. The superior quality of our approach is shown in fig. 8 where the classical discrete scan-conversion technique generates staircase artifacts on the surface especially on objects boundaries while the attribute reclassification scheme produces smooth renderings at any scale. As long as the size of a voxel is about the same size as a pixel of the resulting projection the difference between the classical raycasting approach and our new method is not noticeable. However, if we compute a magnified view the discrete nature of the attribute voxels becomes prominent (fig. 9). The difference in image quality is also demonstrated in fig. 10 showing a magnified view of the bony structures taken from CT data of a cadaver. The next example illustrates the new quality on 3D-views of blood vessels reconstructed from MR- and CT-angiography acqui-
Figure 8: Magnified view of fig. 7: classical ray-casting yields staircase artifacts especially at the object boundaries (left). The brain surface appears much smoother using the reclassification algorithm.
sitions (fig. 11). Our technique also enables endoscopic views even of very small structures like bifurcations of cerebral arteries as shown in fig. 12.
3.1 Visible-Human The Visible-Human-Dataset provided by the NLM has gained much attention in the past years [8, 12]. For the first time colored digital cross-sectional images of human anatomy in a resolution unatainable of today’s tomographic scanner technology are avaiable. We reduced the slice resolution by a factor of three to get a managable volume size and segmented different parts of the body using ellipsoids in RGB-space for the classification of the objects [14, 10]. For the visualization we adapted the reclassification scheme to deal with ellipsoids: to determine the interpolation factor s as described in section 2.3 the 2nd order surface of an ellipsoid requires the solution of a quadric equation. As described in section 2.5.1 the interpolation of the color value directly at the object boundary yields in the case of the skin surface a strange appearance caused by the blue background of the data (fig. 13 left). We therefore emperically shifted the interpolation center beneath the surface until skin (fig. 13 right) and muscular structures (fig. 14) unveiled a very natural nearly photo-realistic appearance. The multi-modality capability of our approach is demonstrated in fig. 15 where we took the skull from CT and muscles and vascular structures from the RGB-volume.
3.2 Artificial object For the simulation of very small manually segmented objects we have created a volume containing a one voxel thin helical structure. The object voxels are 26-connected and no partial-volume-effect has been modeled to demonstrate the attribute interpolation scheme. Serious artifacts are visible using a straight forward ray-casting implementation (fig. 16 top left). Although the classical discrete scanconversion algorithm produces a mathematically correct result (top right) the voxel-like surface is probably not what one would expect from natural objects like blood vessels. The lower left image shows the reconstruction using the reclassification method in combination with the binary attribute value interpolation, and the lower right image is computed with B-spline interpolation and a slightly lower threshold to improve connectivity. To demonstrate the quality aviechable for “natural” objects we rendered the structures in fig. 7 with thresholding turned off for attribute determination and gradient calculation. It turns out that the appearance of areas with high curvature such as the surface of
Figure 9: Comparison of classical ray-casting (left column) and subvoxel precise determination of the attribute values (right column). Notice the smooth boundaries in the magnified view.
Figure 10: Reconstruction of the hip joint of a cadaver taken from CT. Notice the smooth shadow on the background wall generated by our reclassification scheme.
the brain are very much alike, however, low curvature structures show certain artifacts (fig. 17). Hence the described reclassification scheme is still the superior method.
3.3 Computational costs What are the additional computational costs of our new method in contrast to classical ray-casting? 1. floating-point calculation for ray-traversal to maintain subvoxel resolution in contrast to digital-differential-analyzer techniques which can be implemented using integerarithmetic only; 2. tri-linear (or higher order) interpolation of the gray-values at each sample position; 3. examination of the 8 neighbours; 4. calculation of the surface location between sample points. (For opaque surface this is only done once per pixel).
Figure 13: Calculation of surface color: directly at the surface boundary (left), one and two steps underneath the surface (middle and right). Notice the natural appearance of the lips (see color plate).
Figure 11: Reconstruction of blood vessels segmented from MRangiography: The recognizability of small vessels is significantly improved (right).
If we take volume-rendering with non-transparent objects and early ray termination as the basis only 3. applies as additional effort. Table 1 lists typical computation times for some of the figures. As our new approach generates superior image quality for segmented data computation times are not directly comparable, for instance the endoscopic view of the blood vessels in fig. 12 cannot be created with classical ray-casting. For the images shown here we found that the determination of the attribute value requires approximately 40-60%, interpolation 25%, ray-casting 14%, gradient calculation 2.5% and surface location computation 2% of the total CPU time. Image computation time will therefore mostly benefit from reducing attribute calculation costs.
4
CONCLUSION AND FUTURE WORK
We have developed a new method for the precise location of object boundaries segmented from tomographic volume data. The method is based on the partial-volume-effect and reclassifies the sample positions along the viewing rays by interpolating the original gray-values and searching for the best fitting attribute value in the neighbourhood. The boundary is then determined between successive sample points using linear interpolation or bisection. This in turn enables a more accurate calculation of the surface normal using the gray-level-gradient. Our method also detects regions which result from manual segmentation or other unusual conditions in which case we apply an interpolation scheme on the attribute values. We
Figure 12: Endoscopic view of the cerebral blood vessels (left): the viewer is located at the tip of the arrow (right) inside of the left middle cerebral artery in front of a bifurcation. Although the entire structure is only a view voxel in diameter the attribute reclassification yields smooth surfaces unatainable with classical methods.
have demonstrated the new quality achievable with a number of different datasets. Small and thin objects like blood-vessels as well as endoscopic views can be rendered in high resolution using the oversampling ability of the technique. In the case of the colored Visible-Human cross-sections nearly photo-realistic images result. The described techniques form the kernel of the VOXEL-MAN visualization system. Our future work will include
� � �
the improvement for manually segmented regions, where the proposed interpolation of the attribute values is only a first step; the extension of the scheme to other segmentation methods. So far we have only incorporated thresholding for scalar volume data and ellipsoids for the colored Visible-Human images; quantitative measurements about the accuracy of the method.
References [1] Robert A. Drebin, Loren Carpenter, and Pat Hanrahan. Volume rendering. Comput. Graphics, 22(4):65–74, 1988.
Fig. 7 17 11 left 11 right 12 left 12 right 15
image size [Pixel] 512 542
�
volume size [Voxel, MB] 150 200 192, 11.0
” 512 512
�
” 256 256 240, 30.0
”
512 542
�
” 256 256 90, 16.9
�
” 183 246 277, 97.1
” 1024 1024
� � � �
� �
� �
CPU [s] 93 137 52 131 18 169 556
remarks shadow, 4 lights attribute interpolation classical ray-casting endoscopic view shadow
Table 1: Computation times given for a DEC-Personal-Workstation (433 Mhz, 1 GB main memory)
Figure 14: Photo-realistic reconstruction of muscles and vascular structures of the Visible-Human. [2] Karl Heinz H¨ohne, editor. VOXEL-MAN, Part 1: Brain and Skull, Version 1.0. Springer-Verlag Electronic Media, Heidelberg, 1995. (ISBN 3-540-14517-6).
Figure 15: Multi-modality reconstruction of skull and muscles of the Visible-Human.
[3] Karl Heinz H¨ohne and Ralph Bernstein. Shading 3D-images from CT using gray level gradients. IEEE Trans. Med. Imaging, MI-5(1):45–47, 1986.
19–26. IEEE Computer Society Press, Los Alamitos, CA, 1990.
[4] Karl Heinz H¨ohne and W. A. Hanson. Interactive 3Dsegmentation of MRI and CT volumes using morphological operations. J. Comput. Assist. Tomogr., 16(2):285–294, 1992.
[10] Thomas Schiemann, Ulf Tiede, and Karl Heinz H¨ohne. Segmentation of the Visible Human for high quality volume based visualization. Med. Image Anal., 1(4):263–270, 1997.
[5] Arie Kaufman, editor. Volume Visualization. IEEE Computer Society Press, Los Alamitos, CA, 1991.
[11] Lisa M. Sobierajski and Arie E. Kaufman. Volumetric ray tracing. In ACM/IEEE Volume Visualization Symposium Proceedings, October 1994, pages 11–18. ACM Press, 1994.
[6] Marc Levoy. Display of surfaces from volume data. IEEE Comput. Graphics Appl., 8(3):29–37, 1988. [7] William E. Lorensen and Harvey E. Cline. Marching Cubes: A high resolution 3D surface construction algorithm. Comput. Graphics, 21(4):163–169, 1987. [8] National Library of Medicine. The Visible Human Project. World Wide Web: http://www.nlm.nih.gov/research/visible/ visiblehuman.html, 1996. [9] Andreas Pommert, Ulf Tiede, Gunnar Wiebecke, and Karl Heinz H¨ohne. Surface shading in tomographic volume visualization: A comparative study. In First Conference on Visualization in Biomedical Computing, Proc. VBC ’90, pages
[12] Victor Spitzer, Michael J. Ackerman, Ann L. Scherzinger, and David Whitlock. The Visible Human male: A technical report. J. Am. Med. Inf. Ass., 3(2):118–130, 1996. [13] Ulf Tiede, Karl Heinz H¨ohne, Michael Bomans, Andreas Pommert, Martin Riemer, and Gunnar Wiebecke. Investigation of medical 3D-rendering algorithms. IEEE Comput. Graphics Appl., 10(2):41–53, 1990. [14] Ulf Tiede, Thomas Schiemann, and Karl Heinz H¨ohne. Visualizing the Visible Human. IEEE Comput. Graphics Appl., 16(1):7–9, 1996. [15] Roni Yagel, Daniel Cohen, and Arie Kaufman. Discrete ray tracing. IEEE Comput. Graphics & Appl., 12(5):19–28, 1992.
Figure 16: Different renderings of a 26-connected one voxel thin artificial object simulating very small manually segmented structures.
Figure 17: Object rendering using attribute interpolation only (compare with fig. 7). Objects with high curvature look very similar while areas with low curvature such as the skin surface reveal some artifacts.