Improved Spectrum Sensing Technique using Multiple. Energy Detectors for Cognitive Radio Networks. ABSTRACT. Cognitive radio is an enabling technology ...
International Journal of Computer Applications (0975 – 8887) Volume 62– No.4, January 2013
Improved Spectrum Sensing Technique using Multiple Energy Detectors for Cognitive Radio Networks Ashish Bagwari Research Scholar, Assistant Professor Electronics & Communication Engineering Department Women’s Institute of Technology Uttarakhand Technical University, Dehradun, India
ABSTRACT Cognitive radio is an enabling technology to solve the spectrum scarcity problem in wireless communication. This is based on the concept of opportunistic spectrum access. Spectrum sensing is one of the most important functions in cognitive radio (CR) implementation. In this paper, we propose a multiple energy detectors (MEDs) based scheme with improved detection performance at low signal to noise ratio (SNR). We consider a framework of CR networks in which each CR node is equipped with MEDs and each energy detector with single antenna. An analytical model is developed for performance evaluation in terms of probability of false alarm Pf, and probability of detection Pd. Numerical results obtained in Rayleigh fading channel show that the proposed scheme performs better as compared to conventional energy detector (ED). The proposed scheme is further extended for cooperative detection, which further yield better detection performance. Optimal number of CR users involved in cooperative spectrum sensing is also investigated to reduce overheads and system complexity.
Geetam Singh Tomar, PhD. Professor Electronics & Communication Engineering Department School of Computing University of Kent, United Kingdom
information, while energy detection [9] methods requiring only noise power information. Ease of implementation, ED preferred for spectrum sensing in CR [10]. Meanwhile, it also brings a severe challenge, i.e. the presence of single ED in CR which arise the question over CR reliability and performance. In this scenario reliability concerts with system redundancy or system is how much loyal. The motivation of this research paper is to provide reliable system with improved spectrum sensing performance.
Keywords Spectrum Sensing, MEDs, Cooperative Spectrum Sensing, ED, CR.
1. INTRODUCTION In wireless communication, frequency spectrum is a limited resource. Moreover, due to fixed spectrum allocation scheme its utilization is poor making the scarcity more severe. In accordance to a report by Spectrum Policy Task Force of FCC, the spectrum is under or scarcely utilized and this situation is due to the static allocation of the spectrum [1-3]. Thus, to overcome the spectrum deficiencies and the inefficient utilization of the allocated frequencies [4], it is necessary to introduce new communication models through which frequency spectrum can be efficiently utilized, whenever the white space hole is available. Resolving this problem, the idea of Dynamic Spectrum Access (DSA) has been developed [5]. The opportunistic access of the frequency spectrum is realized through cognitive radio (CR). [6,7]. For a given purpose, CR arises as a tempting solution to the spectral congestion problem by introducing opportunistic usage of the frequency bands that are not heavily occupied by licensed users as depicted in Figure 1. CR is characterized by the fact that it can adapt, according to the environment, by changing its transmitting parameters, such as modulation, frequency, frame format, etc. [8]. In CR, Spectrum sensing is one of the most important functions. To detect the spectrum, there are three basics spectrum sensing techniques, named as Matched filter detection, Energy detection and cyclostationary feature detection. Matched filter and cyclostationary feature techniques requiring both source signal and noise power
Figure 1. Spectrum usage A key challenge in cognitive radio networks is the unreliability of CR which affects its performance also. In this paper, we propose an analytical model called Multiple Energy Detectors (MEDs) to overcome this problem, & derive an analytical formula in terms of Probability of false alarm Pf, Probability of detects alarm Pd, & Probability of miss detection Pm which shows improvement in performance. This propose analytical model is based on the concept of SIMO (single input multiple outputs) which is taken from [11], Here we assume that PU is using single antenna to transmit BPSK modulated signal over Rayleigh fading channel and CR containing multiple antennas, and each antenna equipped with individual single energy detectors, also assuming that channel information is known, The purpose of using multiple antennas are to mitigate fading & shadowing effects in wireless channel, But there is one limitation, the presence of single ED in each CR. Suppose, CR having single ED (currently used in CR), and somehow this ED gets fail, in this situation CR cannot communicate, though rest of all the things are fine. It shows that the working lifetime of CR is depending upon lifetime of ED. Failure of ED is one of the reasons for CR failure, which is a serious problem in CR networks. Thus to overcome this limitation we have introduced the idea of Multiple Energy Detectors (MEDs). In MEDs, suppose one ED gets fail then the rest of the process will not be affected
11
International Journal of Computer Applications (0975 – 8887) Volume 62– No.4, January 2013 because of redundancy. According to this proposed MEDs concept CR cannot fail until all EDs fail, and the chances of failure of all EDs are very less. Therefore, these MEDs are responsible for reducing the chances of CR failure. Even though it increases the system complexity but at other end we are able to enhance reliability, improve performance, processing speed, and can achieve a robust ED which performance will not be degraded due to noise uncertainty. Further, to prevent hidden primary user problems [12-14] in order to improve sensing detection, we used MEDs in cooperation among the CRs [15]. In [16], a cooperation based spectrum sensing scheme is proposed to detect the PU with an optimal linear combination of the received energies from the cooperating CRs in a fusion center (FC). The cooperative spectrum sensing scheme provides better immunity to fading, noise uncertainty, and shadowing [17, 18].
Arrangement of multiple EDs, where each ED having single antenna provide promising solution as to improve bit error rate, reducing multipath and shadowing effects of the wireless channel, making the process fast, and improve system reliability. Proposed arrangement is based on Square Law combining (SLC) receive diversity scheme, where input received signal multiplies with the conjugate of channel gain before signal received by Square Law devices (SLD) in order to improve detection capability [19].
Finally, discussed an analytical formulation, How to optimized number of cooperative CRs for detecting the spectrum hole, in terms of probability of false Pf and probability of detection alarm Pd, by reducing system complexity in form of number of overheads. The rest of the paper is organized as follows: Section II presents spectrum sensing methodologies. Section III describes the proposed analytical model for energy detector. Section IV presents improving sensing detection scheme. Section V describes Optimization of number of cooperative CR’s. Section VI presents the numerical results and analysis. Finally, Section VII concludes the paper.
2. SPECTRUM SENSING METHODOLOGIES CRs utilize unused channel of PU’s signal and spectrum sensing mechanism allows them to determine the presence of a PU while in transmitter detection based technique, CR determines signal strength generated from the PU. In this method, the locations of the primary receivers are not known to the CRs as there is no signaling between the PUs and the CRs. To detect the PU signal, we have used following hypothesis for received signal:
In the testing, x(n) shows signal received by each CR user. s(n) is the PU licensed signal, w(n) ~ (0, σw2) is additive white Gaussian Noise with zero mean and variance σw2, h(n) denotes the Rayleigh fading channel gain of the sensing channel between the PU and the CR user. H0 and H1 are the sensing states for absence and presence of signal respectively. H0 is the null hypothesis which indicates that PU has not occupied channel and H1 is the alternative hypothesis. We can define it in following cases for the detected signal.
Figure 2. Proposed Multiple Energy Detectors Diagram In the Figure 2, there is one PU contains single antenna, and one CR contains Nr number of EDs and each ED having single antennas, hence there are also Nr number of antennas. Transmitted BPSK modulated signal from PU, received by each individual antenna of CR, assuming, channel is Rayleigh fading channel & have perfect channel knowledge. Hence, received signal is multiplied by the complex conjugate of each channel’s channel gain and sent to the individual EDs. The output of each ED is combined or added in the form of vector addition, and compared with a threshold to take an appropriate decision. Suppose, xj(k) is the received signal at jth antenna for kth data stream, hj* is the complex conjugate of channel gain for the same jth antenna which is assumed to be Rayleigh fading channel, N is total number of symbol length to be sensed by CR and Nr is number of antennas. Hence, the overall output of MEDs as follows:
• Declaring H1 under H0 hypothesis which leads to Probability of False Alarm (Pf). • Declaring H1 under H1 hypothesis which leads to Probability of Detection (Pd). • Declaring H0 under H1 hypothesis which leads to Probability of Missing (Pm).
3. PROPOSED ANALYTICAL MODEL FOR ENERGY DETECTOR In our approach, we assume, CR utilizing energy detector for spectrum sensing with multiple antennas. This arrangement is referred to as Multiple Energy Detectors (MEDs).
It is seen from figure 2 that individual EDs are allocated to individual antennas. Now we sum the statistics coming from multiple detectors and compare it with a threshold. If the symbol length is assumed to be N and number of antenna used is Nr then there will be N Nr received data at the output to compare with a threshold. Hence the distribution of the output
12
International Journal of Computer Applications (0975 – 8887) Volume 62– No.4, January 2013 becomes central chi square distribution with N freedom which can be formulated as follows:
Nr degree of
Г( ) = Gamma function.
Now, the Probability of False Alarm for the MEDs can be calculated by the given equations
To find the false alarm probability Pf, we set a threshold & integrate the pdf of ) under H0 hypothesis from threshold to infinity as follows:
From (6) and (8), the probability of false alarm can be written as
Figure 3. Probability of False Alarm Probability Vs SNR with Nr = 2, N = 10 and λ = 0.5 with BPSK and Rayleigh fading channel Now, the Probability of Detection Pd for MEDs can be determined with the help of probability density function (PDF) of fy(y), PDF can be expressed as follows [20]:
Solving equation (9), the final expression for probability of false alarm for MEDs which is derived in Appendix I as
From (11) and (12), the probability of detection alarm can be written as
Where, N = Symbol length Nr = Number of Antennas.
Solving equation (13), the final expression as follows
= Threshold value. = Complex conjugate of Channel Gain. = Variance of AWGN.
Where, alarm will be
hence the probability of detection
Moreover, when there are Nr number of antennas and channel gain is hj*, Pd expression for MEDs will be Г( , ) = Upper incomplete gamma function.
13
International Journal of Computer Applications (0975 – 8887) Volume 62– No.4, January 2013
= Variance of Signal. = Variance of Noise. =
th
-order modified Bessel function of the first kind.
= Energy per bit.
Г( , ) = Lower incomplete gamma function.
Figure 5. Probability of Miss Detection Vs SNR with Nr = 2, N = 10 and λ = 0.5 with BPSK and Rayleigh fading channel It can be seen from equation (10), (16), & (19) that for =1 and =1, Pf, Pd, and Pm gives an expression for Conventional ED. In above mentioned approach, we discussed proposed MEDs model with an analytical formulation and shown that MEDs improved the performance of CR at low SNR as compare to conventional ED. Now, to improve sensing detection, we are using cooperative spectrum sensing technique with MEDs.
4. IMPROVING SENSING DETECTION SCHEME
Figure 4. Probability of Detection Alarm Vs SNR with Nr = 2, N = 10 and λ = 0.5 with BPSK and Rayleigh fading channel Now, the probability of miss detection for MEDs can be calculated as follows
The performance of spectrum sensing is limited by hidden primary user problems [12-14], noise uncertainty, Multipath fading and Shadowing [21]. To overcome these problems cooperative spectrum sensing has been utilized which gives better result at lower SNRs. Here, cooperative spectrum sensing technique with MEDs is used in order to improve sensing detection, i.e. sense the signal at lower SNRs. In cooperative spectrum sensing, the decision of each CR is forwarded to a fusion center (FC), which takes final decision about the presence of the PU. For taking final decision, we used Hard Decision Combining Rule (majority rule) in which each CR send one bit data to FC to take a global decision against presence or absence of PU. It minimizes the probability of false alarm and missed detection and improves probability of detection alarm. To determine an optimal number of cooperative CRs we have analyzed a mathematical expression in terms of probabilities, which is discussed later. Figure 6, showing Cooperative Spectrum Sensing with MEDs.
The probability of miss detection for MEDs can be calculated using equation (16) and (18), can be written as follows
14
International Journal of Computer Applications (0975 – 8887) Volume 62– No.4, January 2013
CR-1 Reporting Phase
< ,
H0
(24)
≥ ,
H1
(25)
Sensing Phase Fusion Center (FC)
CR-2 PU-Rx
The probability of false alarm (PF) of the FC for cooperative spectrum sensing can be calculate from equation (7), (24) & (25) as follows [22]
PU-Tx
CR-3
Here the values of Pf are taken from (10). CR-N
Figure 6. Cooperative Spectrum Sensing with MEDs In Figure 6, we consider a system consisting of U number of CRs, one PU and one FC. It is assumed that FC and PU contains a single antenna and each CR contains Nr number of antennas. There are two hypothesis 0 and 1 in the th CR for the detection of the spectrum hole: yi(t) = wi(t), yi(t) = si(t)
hi(t) + wi(t),
H0
(20)
H1
(21)
where = 1, 2....Nr at each CR, si(t) ∼ (0, s2 ), where s2 is the average transmitted power of the PU, denotes a zero mean Gaussian signal transmitted by the PU, and wi(t) ∼ (0, w2) is additive white Gaussian noise (AWGN) with zero mean and 2 w variance. The variance of the signal received at each CR under 1 will be ( s2 + w2). It is assumed that each CR contains MEDs.
Non-cooperative sensing scheme, many CRs exist in a cognitive radio network makes independent decision regarding the presence or absence of PU. We consider a cooperative scheme in which each CR sends its final local decision b in the form of 0 or 1 to the FC through an Error free reporting channel.
Figure 7. Probability of False Alarm Vs SNR with n = 2, U = 10, Nr = 2, N = 10 and λ = 0.5 with BPSK and Rayleigh fading channel The probability of detection alarm (PD) of the FC can be obtained from (12), (24) & (25) as follows [22]:
Here the values of Pd are taken from (16).
The FC combines these binary decisions bi to find the presence or absence of the PU as follows:
Where, D is the sum of the all local decisions from the CRs. The FC uses a majority rule for deciding the presence or absence of the PU. As per the majority decision rule if is greater or equal to then signal is detected and if is smaller than then signal is not detected. Here n is number of cooperative CRs, out of the total number of CRs U. The mathematical expression of hypothesis can be written as
Figure 8. Probability of Detection Alarm Vs SNR with n = 2, U = 10, Nr = 2, N = 10 and λ = 0.5 with BPSK and Rayleigh fading channel The probability of missed detection (PM) of the FC can be obtained from (17), (24) & (25) as follows:
15
International Journal of Computer Applications (0975 – 8887) Volume 62– No.4, January 2013 Then, to detect the spectrum hole, require number of cooperative CR users will be equal to total number of CRs i.e. n = U.
Case 2- If, OR,
Here the values of Pm are taken from (19). Then, to detect the spectrum hole, require number of cooperative CR users will be equal to the half of total number of CRs i.e. n = U/2.
Figure 9. Probability of Miss Detection Vs SNR with n = 2, U = 10, Nr = 2, N = 10 and λ = 0.5 with BPSK and Rayleigh fading channel
5. OPTIMIZATION OF NUMBER OF COOPERATIVE CR’S Cognitive network with very large number of cooperative CRs has more computational complexities like more overheads (α) [23] and large delays are incurred in deciding the presence of the spectrum hole. Therefore, it is expedient to find an optimized number of CRs which significantly contribute in deciding the presence of the PU. The condition to obtain an optimal number of cooperative CRs is derived in Appendix II as [22]
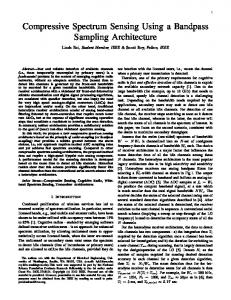
Figure 10. Number of Overheads Vs Total number of CR Users with fs = 10 kHz, t = 1 msec, SNR = 5 dB, Nr = 1, n = 2, 3, 4 and λ = 0.3 It can be seen from figure 11 that when overheads are increasing, probability of detection is decreasing, for different values of SNR performance of probability of detection alarm varies with respect to overheads. When value of SNR is more, improvement in probability of detection can be seen.
In Equation (30), n is the optimal number of cooperative CRs out of U total number of CRs. Pf and Pd are the probability of false alarm, probability of detection alarm respectively. Thus, it is shown that the probabilities like Pf & Pd are playing an important role in order to obtain optimal number of cooperative CRs. Now, discussing two cases regarding how to obtain an optimal number of cooperative CR’s based on Pf and Pd and Pm as shown in Appendix II.
Case 1- If,
Figure 11. Probability of Detection Alarm Vs Total number of CR Users at SNR = - 5 dB, 0 dB & + 5 dB, U = 10, Nr = 2, N = 10, λ = 0.3, n = 5, and fs = 0.1 kHz with BPSK and Rayleigh fading channel
OR,
16
International Journal of Computer Applications (0975 – 8887) Volume 62– No.4, January 2013 It can be seen from figure 12 that the probability of miss detection is increasing with respect to overheads for different values of SNR. When SNR is increasing, probability of miss detection improves with respect to overhead.
Figure 12. Probability of Miss detection Vs Total number of CR Users at SNR = - 5 dB, 0 dB & + 5 dB, U = 10, Nr = 2, N = 10, λ = 0.3, n = 5, and fs = 0.1 kHz with BPSK and Rayleigh fading channel It can be seen from figure 13 that when overheads are increasing, probability of false alarm is increasing. For the higher value of SNR, probability of false alarm improves with respect to overhead as compare to low SNR value.
channel. It can be seen from figure 3 that, for the given range of SNR - 15 dB to 20 dB, MEDs gives better false alarm probability (Pf), varies below 1 and at last reaches 10-60, for SNR range - 15 dB to 0 dB as compare to conventional ED. Figure 4 shows, the probability of detection alarm for the given range of SNR - 35 dB to 20 dB, here MEDs is detection signal at - 10 dB which is faster than conventional ED. Figure 5 shows, the probability of miss detection for the given range of SNR - 20 dB to 20 dB, miss detection probability (Pm) is approximately 10-7 at – 7 dB for MEDs which is very less from Pm point of view, while conventional ED reaches 10 -7 at 15 dB. The results show that proposed MEDs outperforms the conventional ED. Further, we have improved sensing detection using cooperative sensing scheme as shown in figure 6. Figures 7-9 shows, the probability of false alarm versus SNR plot, probability of detection alarm versus SNR plot, & probability of miss detection versus SNR plot respectively, where we have assumed that N = 10, Number of cooperative CRs n is taken as 2, total number of CRs U = 10, Nr = 2, λ = 0.5, modulation is BPSK and channel is Rayleigh channel. Figure 7 shows, the probability of false alarm for the given range of SNR - 20 dB to 0 dB, cooperative MEDs gives better false alarm probability (Pf) which varies below 0.1 and at last reaches approximately 10-7 for SNR range - 20 dB to - 4.5 dB as compare to MEDs. Figure 8 shows, the probability of detection alarm for the range of - 16 dB to - 6 dB, cooperative MEDs is detection signal at - 11 dB which is faster than MEDs. Figure 9 shows, the probability of miss detection for the range of - 20 dB to 0 dB, miss detection probability (Pm) is approximately 10-7 at - 9.2 dB for cooperative MEDs while MEDs reaches 10-7 at - 4 dB. The results show that MEDs with cooperative sensing scheme is enhancing the performance of proposed MEDs. In Figure 10, we have plotted overheads versus total number of CRs graph for different number of cooperative CRs, assumed n = 2, 3, & 4, Nr = 2, λ = 0.3, Sampling frequency fs = 10 kHz, time slot length t = 1 msec, and SNR = 5 dB. If n = 2, it can be seen from figure 10 that the number of overheads varies with the number of CR users, like U = 7, number of overheads (α) are 0.1 or 10 %. While U = 14, α reaches maximum 1 or 100 %.
Figure 13. Probability of False alarm Vs Total number of CR Users at SNR = - 5 dB, 0 dB & + 5 dB, U = 10, Nr = 2, N = 10, λ = 0.3, n = 5, and fs = 0.1 kHz with BPSK and Rayleigh fading channel
6. NUMERICAL RESULTS AND DISCUSSION Figure 2 shows the diagram of proposed MEDs, which shows improved detection performance. Figures 3-5 show, the probability of false alarm versus SNR plot, the probability of detection alarm versus SNR plot, & probability of miss detection versus SNR plot respectively. We assumed symbol length N = 10, the number of antenna used in CR Nr = 2, λ = 0.5, modulation scheme is BPSK and channel is Rayleigh
Similarly, for n = 3 and 4, α is increasing with respect to U. After analyzed figure 10, it may be concluded that when the number of CRs increase, overheads also increase. These overheads are responsible for congestion and complexity which should be as less as possible. Equation (30), we discussed how to optimize the number of cooperative CR’s in order to minimize number of overheads. Equation (31) & (32), if Pf = Pd, & Pf + Pm = 1, means Pf & Pd are equiprobable, To sense the spectrum hole, number of cooperative CRs are equal to total number of CRs. While in Equation (33) & (34), Pf = Pm, & Pf + Pd = 1, means Pf & Pm are equiprobable, Thus, to sense the spectrum hole and take a final decision, only half of the total number of CRs are require. As discussed more number of CRs are responsible for more overheads, thus using second case we are able to reduce number of overheads as well as system complexity.
17
International Journal of Computer Applications (0975 – 8887) Volume 62– No.4, January 2013 Figures 11-13 show, the probability of detection alarm versus number of overheads, the probability of miss detection versus number of overheads, & probability of false alarm versus number of overheads plot in terms of SNRs like – 5 dB, 0 dB, & + 5 dB respectively. We assumed U = 10, Nr = 2, N = 10, λ = 0.3, n = 5, and fs = 0.1 kHz. It can be seen from figure 11 that, when overheads are increasing, probability of detection is decreasing, for 0 % overhead, probability of detection is maximum 1 for all three SNRs like - 5 dB, 0 dB, & + 5 dB. When overheads are 10 %, value of probability of detection is 0.05 for - 5 dB, 0.42 for 0 dB, and 0.81 for + 5 dB SNR. It shows that probability of detection alarm can improve via increasing value of SNR. In figure 12, when overheads are increasing, probability of miss detection is increasing, when overhead is 0 %, probability of miss detection is minimum 0 for all three SNRs. When overhead is 0.1 %, probability of miss detection is 0.95 for - 5 dB, 0.58 for 0 dB, and 0.19 for + 5 dB SNR. Further increasing overheads, probability of miss detection alarm reaches to 1 for all three SNRs. Thus the probability of miss detection can improves when value of SNR increases. Figure 13 shows that the probability of false alarm is increasing with respect to overheads, when overhead is 0 %, probability of false alarm is minimum 0 for all three SNRs. For 0.1 % overhead, probability of false alarm is 0.05 for - 5 dB, 0.01 for 0 dB, and 0 for + 5 dB SNR. Further increasing overheads, probability of miss detection alarm reaches to 1 at different values of SNR at different overhead levels like, overheads are 30 % for - 5 dB SNR, overheads are 40 % for 0 dB SNR, overheads are 70 % for + 5 dB SNR to reach probability of false alarm 1. Thus improvement in probability of false alarm can be happened when value of SNR will increase.
7. CONCLUSION To improve the spectrum sensing performance of CR networks we have presented an Improved Spectrum Sensing technique using Multiple Energy Detectors for Cognitive Radio Networks. Performance is measured in terms of probability of detection and probability of false alarm for given SNR. Numerical results showed that the value of false alarm probability for MEDs was measured less than 1 at - 15 dB SNR, & it detected signal at - 10 dB, which was low SNR, as shown in fig 3, & 4 respectively. Further, the proposed scheme was utilized in cooperative spectrum sensing to further mitigate the effect of fading, and hidden terminal problem in wireless channel. Cooperative MEDs, improved sensing, where false alarm probability was below 10 -1 at - 20 dB, & it was detecting signal at - 11 dB, as shown in fig 7, & 8 respectively. Hence, using cooperative MEDs we were able to achieve robust spectrum sensing at low SNR. Furthermore, optimal number of CR users was also investigated for minimizing the overheads & system complexity due to multiple users. To obtain optimal number of cooperative CRs, we discussed how probabilities Pd and Pf were playing an important role. Thus we showed, how probability of detection, probability of miss detection, and probability of false alarm are related to overheads in terms of SNR. In future, adaptive
threshold to improve the performance of energy detector system will be focused.
8. ACKNOWLEDGMENTS The authors wish to thank their parents and God for supporting and motivating for this work because without their blessings this was not possible.
9. REFERENCES [1]
Federal Communications Commission, “Notice of proposed rule making and order: Facilitating opportunities for flexible, efficient, and reliable spectrum use employing cognitive radio technologies,” ET Docket No. 03-108, Feb. 2005.
[2]
Federal Communications Commission (FCC), 2002. “Spectrum Policy Task Force,” Report, pp: 2-37.
[3]
Federal Communications Commission (FCC), 2003. “FCC 03-322,”
[4]
Haykin, S. 2005. Cognitive radio: brain-empowered wireless communications. IEEE Journal on Selected Areas in Communications 23(2): 201 - 220.
[5]
I. F. Akyildiz, W.-Y. Lee, M. C. Vuran, and S. Mohanty, “Next generation/dynamic spectrum access/cognitive radio wireless networks: A survey,” Comput. Netw., vol. 50, pp. 2127–2159, May 2006.
[6]
Mitola, J. and G.Q. Maguire, 1999. “Cognitive Radio: Making Software Radios More Personal,” IEEE Personal Communication Magazine, 6(4): 13-18.
[7]
McHenry and McCloskey, 2005. "Spectrum Occupancy Measurements, Shared Spectrum Company Report".
[8]
Ali Gorcin and Bhaskar Thiagarajan, 2007. "A Signal Identification Application for Cognitive radio", SDR Forum Technical Conference.
[9]
Ashish Bagwari, and Brahmjit Singh, “Comparative performance evaluation of Spectrum Sensing Techniques for Cognitive Radio Networks,” 2012 Fourth IEEE International Conference on Computational Intelligence and Communication Networks (CICN-2012), pp. 98-105.
[10] Miguel
López-Benítez, and Fernando Casadevall, “Improved Energy Detection Spectrum Sensing for Cognitive Radio,” In IET Communications, vol. 6, Issue 8, pp. 785-796, 09 July 2012.
[11] Refik Fatik Ustok and Berna Ozbek, “Spectrum Sensing
based on Energy Detection for Cognitive Radio Systems with Multiple Antennas,” IEEE 17th Signal Processing and Communications Applications Conference, pp. 396399, 2009. [12] G. Ganesan and Y. Li, “Agility improvement through
cooperative diversity in cognitive radio,” in Proc. IEEE Global Telecomm. Conf. (Globecom), vol. 5, St. Louis, Missouri, USA, Nov./Dec. 2005, pp. 2505–2509. [13] Ghurumuruhan
Ganesan and Ye (Geoffrey) Li, “Cooperative spectrum sensing in cognitive radio networks,” in Proc. IEEE Int. Symposium on New Frontiers in Dynamic Spectrum Access Networks, Baltimore, Maryland, USA, Nov. 2005, pp. 137–143.
[14] D. Cabric, A. Tkachenko, and R. Brodersen, “Spectrum
sensing measurements of pilot, energy, and collaborative
18
International Journal of Computer Applications (0975 – 8887) Volume 62– No.4, January 2013 detection,” in Proc. IEEE Military Commun. Conf., Washington, D.C., USA, Oct. 2006, pp. 1–7.
Receiver will detect False Alarm when, (7)
[15] G. Ganesan and Y.Li, “Cooperative spectrum sensing in
cognitive radio, Part II: multiuser networks,” IEEE Trans. on Wireless Commun., vol.6, pp.2214-2222, June 2007. [16] Z. Quan, S. Cui, and A. H. Sayed, “Optimal linear
cooperation for spectrum sensing in cognitive radio networks,” IEEE J. Sel. Topics in Sig. Proc., vol. 2, no. 1, pp. 28-40, Feb. 2008. [17] Lu Lu*, Xiangwei Zhou, Uzoma Onunkwo and Geoffrey
Ye Li, “Ten years of research in spectrum sensing and sharing in cognitive radio,” In EURASIP Journal on Wireless Communications and Networking, pp. 1-16, Jan. 2012. [18] J. Unnikrishnan and V. V. Veeravalli, “Cooperative
sensing for primary detection in cognitive radio,” IEEE J. Sel. Topics in Sig. Proc., vol. 2, no. 1, pp. 18-27, Feb. 2008. [19] Fadel F. Digham, Member, IEEE, Mohamed-Slim
Alouini, Senior Member, IEEE, and Marvin K. Simon, Fellow, IEEE. “On the Energy Detection of Unknown Signals Over Fading Channels”, IEEE TRANSACTIONS ON COMMUNICATIONS, vol. 55, NO. 1, JANUARY 2007, pp. 21-24. [20] Tevfik Y¨ucek and H¨useyin Arslan, “A Survey of
Spectrum Sensing Algorithms for Cognitive Radio Applications,” IEEE Communications Survey & Tttorials, vol. 11, no. 1, pp. 116-130, FIRST QUARTER 2009. [21] Digham, F., M. Alouini, and M. Simon. 2003. On the
energy detection of unknown signals over fading channels. Proc. IEEE Int. Conf. on Communications. 5: 3575-3579. [22] Wei Zhang, Rajan K. Mallik, and Khaled Ben Letaief,
“Optimization of cooperative spectrum sensing with Energy detection in Cognitive Radio Networks,” IEEE Transaction on wireless communications, vol. 8, No. 12, December 2009. [23] Yulong Zou,Yu-Dong Yao, and Baoyu Zheng, “A
selective-relay based cooperative spectrum sensing scheme without dedicated reporting channels in cognitive radio networks Energy detection of unknown deterministic signals,” In IEEE Transaction on wireless communications, vol. 10, no. 4, pp. 1188-1198, Apr. 2011.
(37) The expression for Gamma Function is as follows
10. APPENDIX I 10.1 Proof of equation (10)
(38) Now, comparing between equations (37) and (38),
Putting the value of & in Equation (38), the final expression of probability of false alarm for MEDs as follows (6)
19
International Journal of Computer Applications (0975 – 8887) Volume 62– No.4, January 2013
Taking logarithm on both sides,
11. APPENDIX II 11.1 Proof of equations (30), (31), (32), (33) & (34) Total Error rate is Z, which is the sum of probability of false alarm and probability of miss detection, i.e.
U = Total number of CR users. n = Total number of Cooperative CR users. To obtain an optimal number of CRs. Differentiating equation (41) with respect to number of cooperative CR users (n) as follows
Final relation between n is U is as follows
20
International Journal of Computer Applications (0975 – 8887) Volume 62– No.4, January 2013 Now, discussing two cases related to total number of CR users U and number of cooperative CRs n in terms of probability of false alarm Pf, and probability of detection alarm Pd.
Case 1- If, OR,
The numbers of cooperative CR users are equal to the half of total number of CR.
The numbers of cooperative CR users are equal to total number of CR.
Case 2- If, OR,
21