Instantaneous Frequency Estimation Using the S-Transform - iMED Lab
Recommend Documents
to estimate the IF of the received signal at the mobile unit antenna. Instead, in this ... where Saa(/) is the PSD of a(t) , and *f stands for the con- volution operator ...
[3] D. B. Percival and A. T. Walden, Spectral Analysis for Physical. Applications: Multitaper and Conventional Univeriate Tech- niques. New York: Cambridge ...
Sep 19, 2017 - We found that single and multi-layer Deep Belief networks perform nearly identically ... rological conditions such as physical trauma or stroke [1, 2]. Though ...... [24] D. Kriesel, A Brief Introduction of Neural Networks, 2007.
not necessarily polynomial, frequency modulated (FM) signals affected by stationary multiplicative and additive noise. Both noise processes are assumed to be ...
sonar, biomedical engineering, and automotive signals, the IF characterizes important ... The authors are with the Signal Processing Research Centre, School of Electrical and ...... 1986, he joined the University of Colorado, Boul- der, where he ...
The continuous wavelet transform (CWT)-based SST sharpens the time-frequency representation of a non-stationary signal by assigning the scale variable of.
Instantaneous Frequency Estimation of. Multicomponent Nonstationary Signals Using. Multiview Time-Frequency Distributions Based on the Adaptive Fractional ...
Alternatively, we ca.11 estimate t,his variance using the jack- ... Figure 2. 95% confidence intervals for the IF of a linear FM signal embedded in Gaussian noise ...
OT scheme based on extended Kalman filter (EKF), which comprises the advantages ... Kalman filtering (VKF) scheme is developed using two synthetic signals, ...
May 11, 2018 - Mohammad Amin Hariri-Ardebili,. University of Colorado Boulder,. United States. *Correspondence: Ya-juan Xue [email protected].
Proceedings of the 7th International Conference on Ground Penetrating Radar (GPR '98). 219. GPR SIGNAL ANALYSIS: INSTANTANEOUS PARAMETER ...
Jun 6, 2016 - Keywords: Graph signal processing, vertex-frequency analysis, ... In the graph representation, the vertices (i.e., nodes) refer to objects of ...
Mar 22, 2010 - Figure 3: The illustrations of several zoomed time-frequency regions and corresponding .... recent advances,â Digital Signal Processing, vol. .... Procedures to submit a paper and proposals for special sessions and tutorials will.
Pattern Recognition in Time-Frequency Domain: Selective Regional Correlation and. Its Applications. Ervin SejdiÄ1 and Jin Jiang2. 1Bloorview Research ...
Jun 13, 2017 - Compressive sensing is a framework for acquiring sparse signals at ... Thirdly, compressive sensing based time-frequency representations.
Sep 10, 2013 - Iva Jestrovic1, Joshua M Dudik1, Bo Luan1, James L Coyle2 and Ervin Sejdic1*. 4. *Correspondence: [email protected]. 1Department of ...
observed as a strong pump transferring power to a carrier and producing an idler. In Eq. (1) there are two pumps of amplitude (A) and two signals of amplitude ...
Zehnder modulators (MZMs) biased at the transmission null point. Then, ... X. H. Zou, W. Pan, B. Luo, and L. Yan, âFull-scale phase demodulation approach for ...
AbstractâA method for minimization of the mean square error. (MSE) of the instantaneous frequency estimation using time- frequency distributions, in the case ...
and Jianping Yao, Senior Member, IEEE. AbstractâA photonic ..... Xu, âPhotonic measurement of microwave frequency based on phase modulation,â Opt.
Alternatively, if the signal is spectrally too dense, neighboring channels generate ..... 3 J. L. Flanagan and R. M. Golden, ''Phase vocoder,'' Bell Syst. Tech. J. 45,.
Mar 3, 2009 - the inverse of RR-intervals expressed in beats per minute, as HRV .... Note that very low frequency with band between 0.0â. 0.03 Hz was ...
Instantaneous Frequency Estimation and its Application in Radar Signal. Analysis. Irena Orovic, Srdjan Stankovic, Thayananthan Thayaparan, and LJubiša ... modification is proposed in this paper. ... The short-time Fourier transform (STFT).
Instantaneous Frequency Estimation Using the S-Transform - iMED Lab
estimator, based on a time-frequency technique known as S-trans- form, is performed. ... white Gaussian noise environment, and expressions for the bias and.
IEEE SIGNAL PROCESSING LETTERS, VOL. 15, 2008
309
Instantaneous Frequency Estimation Using the S-Transform Ervin Sejdic´, Student Member, IEEE, LJubiˇsa Stankovic´, Senior Member, IEEE, Miloˇs Dakovic´, and Jin Jiang, Senior Member, IEEE
Abstract—Instantaneous frequency (IF) is a fundamental concept that can be found in many disciplines such as communications, speech, and music processing. In this letter, analysis of an IF estimator, based on a time-frequency technique known as S-transform, is performed. The performance analysis is carried out in a white Gaussian noise environment, and expressions for the bias and the variance of the estimator are determined. The results show that the bias and the variance are signal dependent. This has been statistically confirmed through numerical simulations of several signal classes. Index Terms—Instantaneous frequency estimation S-transform, time-frequency.
I. INTRODUCTION
frequency estimation error using the -transform. Such an analysis is performed for signals in the presence of white Gaussian noise. Results of numerical analysis confirm the derived expressions. This letter is organized as follows: In Section II, a review of the -transform followed by derivations of the bias and the variance for the IF estimation algorithm are given. Section III illustrates the performance of the proposed scheme through an example. Finally, conclusions are drawn in Section IV. II. PERFORMANCE ANALYSIS OF THE -TRANSFORM-BASED IF ESTIMATOR A.
NSTANTANEOUS frequency (IF), defined as the derivative of the phase of a signal, is a fundamental concept present not only in communications (e.g., frequency modulation) but also in nature (e.g., changing color of light) [1]. The estimation of IF is important in signal analysis with time-frequency analysis being one of the tools for IF estimation [2]. The -transform is conceptually a hybrid of short-time Fourier analysis and wavelet analysis. It employs a variable window length but preserves the phase information by using the Fourier kernel in the signal decomposition [3]. As a result, the phase spectrum is absolute in the sense that it is always referred to a fixed time reference. The real and imaginary spectrum can be localized independently with resolution in time in terms of basis functions. The changes in the absolute phase of a certain frequency can be tracked along the time axis and useful information can be extracted. For this reason, the -transform has already found applications in many fields such as geophysics [4], cardiovascular time series analysis [5], pattern recognition [6], and signal processing for mechanical systems [7]. The IF of a noiseless signal can be determined from the phase of the signal representation obtained by the -transform. It is given by a partial derivative of the phase with respect to time [3]. However, in previous works, it has not been demonstrated how well the -transform performs when a signal is contaminated by noise. Hence, the main contribution of this letter is the derivation of accurate analytical expressions for instantaneous
I
Manuscript received August 29, 2007; revised November 7, 2007. The associate editor coordinating the review of this manuscript and approving it for publication was Prof. James E. Fowler. E. Sejdic´ and J. Jiang are with the Department of Electrical and Computer Engineering, The University of Western Ontario, London, ON N6A 5B9 Canada (e-mail: [email protected]; [email protected]). L. Stankovic´ and M. Dakovic´ are with the Electrical Engineering Department, University of Montenegro, 81000 Podgorica, Montenegro (e-mail: [email protected]; [email protected]). Digital Object Identifier 10.1109/LSP.2008.917014
-Transform The -transform of a signal
is defined by [3] (1)
where the window function is (2) If the discrete samples of the continuous signal are available, the integral form of the -transform can be discretized. By sampling (1) in with a sampling period , a discretized -transform can be defined as follows:1
(3) Due to the fact that the window is a function of both time and frequency, it can be noted that the window is wider in the time domain for lower frequencies, and it is narrower for higher frequencies. In other words, a wide time-domain window implies good localization in the frequency domain for low frequencies, while a narrow window provides good localization in the time domain for higher frequencies. In order to illustrate the advantage of the variable window length used in the -transform, let us compare the time-frequency representations obtained by the short-time Fourier transform (STFT), pseudo Wigner–Ville distribution (PWVD), and the -transform for the following signal: (4) where the IF of the signal is given by for . This is only an illustrative example; more thorough investigation of hyperbolic FM signals and other signal classes will be presented in Section III. 1
demonstrate that the MSE of the IF estimator based on the -transform is significantly lower than those based on STFT and PWVD. B. Performance Analysis In order to perform a statistical analysis of the estimator, discrete-time observations (5)
Fig. 1. Four time-frequency representations of a sample hyperbolic signal. (a) Ideal time-frequency representation. (b) STFT. (c) PWVD. (d) S-transform. TABLE I MEAN-SQUARE ERROR FOR THE IF ESTIMATION BASED ON THE THREE TIME-FREQUENCY REPRESENTATIONS UNDER THREE NOISE LEVELS
is a sampled verwill be used, where is an integer, with sion of a continuous analytical signal being a sampling interval, and is a complex-valued white Gaussian noise with independent and identically and distributed real and imaginary parts. Thus, and the total variance of the noise is equal to . By definition, the instantaneous frequency of the considered , and it is assumed that continuous signal is is an arbitrary smooth differentiable function of time with , where and bounded derivatives denotes an th derivative of . The value of can be estimated in the time-frequency domain as in the following [2]: (6)
The Gaussian window is also used for the STFT and the PWVD, with the standard deviations of the window being 0.01 . and 0.25, respectively. The sampling interval is The advantage of the -transform as the instantaneous frequency estimator can be seen from Fig. 1. In order to obtain good concentration at higher frequencies, a narrow window in the time domain should be used for the STFT. However, the narrow window in the time domain significantly diminishes the concentration of the lower frequencies contents of the signal as shown in Fig. 1(b). Even though the PWVD provides improvement over the Wigner–Ville distribution and achieves higher concentration for all frequencies than the STFT, it still suffers from some inner interference effects and cross-terms. The -transform provides much better representation of the sample hyperbolic signal as shown in Fig. 1(d). It is also important to examine the mean-square error (MSE) of the IF estimator based on the STFT, the PWVD, and the -transform. The MSE is defined as , where is the IF of the signal and is its estimate. The IF is estimated based on the peak of the magnitude of each transform with the additive complex white Gaussian noise added to the signal. The MSE in with the total variance of Table I represent an average of 1000 realizations. These results
with being a basic interval along the frequency axis, and where we see (7) at the bottom of the page. for some Before proceeding further, let us consider . Using the fact that the signal has a slow-varying signal amplitude and Taylor series expansion of the phase differences , of can be expressed as (8) at the bottom of the page, equals the Taylor series expansion of the where desired terms, that is, phase difference evaluated for the first
(9) and equals the Taylor series expansion of the phase difference evaluated for (10) representing a th derivative of . In this letter, represents the third and higher order terms, . i.e., As a measure of the quality of estimation, at a given instant , the estimation error can be defined as with
(11)
(7)
(8)
´ et al.: INSTANTANEOUS FREQUENCY ESTIMATION USING THE -TRANSFORM SEJDIC
where is the IF of the signal and is its estimate from the noisy observations of the signal. Due to the presence of the white , is also a random Gaussian noise, the estimation error, variable characterized by its bias and variance. Proposition: Let be a solution of (6); then the bias and are given by the variance of the IF estimation error
311
is linTo perform the estimation error analysis, earized around the stationary point with respect to small esti, phase residue , and noise [2] mation error
(19) where
(12) and
indicates that the derivatives are evaluated at the point , , and . The terms and represent variations of the derivative caused by small and noise , respectively. It can be shown that the terms in (19) are equal to (20) (21) Similarly, the effects of a phase residue, that is, third and higher , are given order terms in a Taylor expansion of the phase by
(13) (22) where
The expected value of the last term in (19) is given by (14) (23)
(15) and the expected value of its square is given by (16)
(24) (17) with
. Proof: The IF is located at the stationary points of , which is defined by the zero value of the derivative , given by
Having obtained the expressions for all the terms in (19), it can be written as (25) By substituting (20)–(23) in (25), an expression for the bias of the estimation is obtained as
(26) which is equal to (12). To determine the variance of the estimation, the following relation is used: (18)
(27)
312
IEEE SIGNAL PROCESSING LETTERS, VOL. 15, 2008
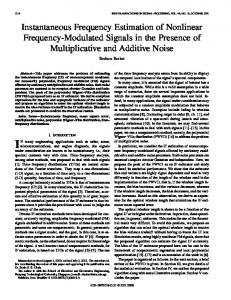
Fig. 2. Performance of IF estimator using the S-transform. (a) Bias of the estimator for CS signal. (b) Variance of the estimator for CS signal. (c) Bias of the estimator for the LFM signal. (d) Variance of the estimator for the LFM signal. (e) Bias of the estimator for the HFM signal. (f) Variance of the estimator for the HFM signal.
Equations (25) and (26) are substituted in (27), and after some algebraic manipulations, the following expression is obtained:
(12) and (13) for the particular signals, while the statistical data are obtained by 100 000 realizations. The vertical axis represents the magnitude of the estimation bias and variance, while the horizontal axis represents the values of variables ( , , and ) normalized with the Nyquist frequency for the sampling in, , and ). terval ( A good agreement between the theoretical results (dashed line) and the statistical results (solid line) can be observed. For all three classes of the signals, as the frequency of the signals increases, the variance of the of the IF estimation error increases, too. For the complex sinusoids, the variance exhibits linear behavior, while for the rest, the variance behaves in a nonlinear manner. The bias linearly increases for the complex sinusoids and the LFM signals. However, as increases, the bias linearly decreases for the HFM signals due to the fact that the -transform achieves higher energy concentration of the signal for the given sampling interval. Hence, the peak location, that is, the instantaneous frequency, is estimated more accurately. This essentially means that a linear time-frequency representation such as the -transform could be potentially used for accurate estimation of the instantaneous frequency for certain higher order signals which previously has been only accomplished with bilinear representations. IV. CONCLUSION In this letter, the analysis of an IF estimation based on the -transform has been performed. Such an analysis has been carried out for signals in the presence of white Gaussian noise. Accurate analytical expressions for instantaneous frequency estimation error using the -transform have been derived. These expressions have been confirmed through numerical analysis. Furthermore, the analysis has shown that the bias and the variance are signal dependent. For the considered signal classes, the -transform showed favorable performance for the HFM signals. REFERENCES
(28)
It is clear that (28) is equal to (13). III. EXAMPLE In the analysis, three classes of signals are used. A simple , a linear FM complex sinusoidal (CS) signal (LFM) signal , and a hyperare considbolic FM (HFM) signal with 2048 data ered. The sampling interval used is points, and the variance of the noise used in the analysis is set . The results of the numerical analysis along with to the theoretical values are depicted in Fig. 2, and they represent . Values from the analytical the bias and the variance for expressions are produced by applying the derived expressions
[1] B. Boashash, “Estimating and interpreting the instantaneous frequency of a signal – Part 1: Fundamentals,” Proc. IEEE, vol. 80, no. 4, pp. 520–538, Apr. 1992. [2] V. N. Ivanovic´ , M. Dakovic´ , and L. Stankovic´ , “Performance of quadratic time-frequency distributions as instantaneous frequency estimators,” IEEE Trans. Signal Process., vol. 51, no. 1, pp. 77–89, Jan. 2003. [3] R. G. Stockwell, L. Mansinha, and R. P. Lowe, “Localization of the complex spectrum: The S-transform,” IEEE Trans. Signal Process., vol. 44, no. 4, pp. 998–1001, Apr. 1996. [4] C. R. Pinnegar and L. Mansinha, “The S-transform with windows of arbitrary and varying shape,” Geophysics, vol. 68, no. 1, pp. 381–385, Jan./Feb. 2003. [5] G. Livanos, N. Ranganathan, and J. Jiang, “Heart sound analysis using the S-transform,” in Proc. Computers in Cardiology 2000, Cambridge, MA, Sep. 24–27, 2000, pp. 587–590. [6] E. Sejdic´ and J. Jiang, “Selective regional correlation for pattern recognition,” IEEE Trans. Syst., Man, Cybern. A, vol. 37, no. 1, pp. 82–93, Jan. 2007. [7] A. G. Rehorn, E. Sejdic´ , and J. Jiang, “Fault diagnosis in machine tools using selective regional correlation,” Mech. Syst. Signal Process., vol. 20, no. 5, pp. 1221–1238, Jul. 2006.