performance objectives. In industrial fermentation, for example, the fed-batch culture of Saccharomyces cerevisiae known as Baker's yeast is aimed to achieve.
PARAMETER ESTIMATION USING GENETIC ALGORITHM FOR FED-BACTH GROWTH OF SACCHAROMYCES CEREVISJAE
Endra Joelianto l , Ruth Dwihandayani1, and Ling Ling2
I Department of Engineering Physics, lnstitllt Teknologi Bandllng, )1. Ganesha 10, Bandllng 40132 Indonesia
2Department of Chemical Engineering Parahyangan Catholic University, )1. Ciumbuleuit 94, Bandung 40J41lndonesia
This paper considers parameter estimation of the growth of Saccharomyces cerevisiae in fed -batch processes. The mathematical model is first derived by using mass and energy balance principles. The derived nonlinear model consists of four state variables and two inputs with five unknown parameters. Genetic algorithm is applied to obtain the optimal parameters by minimizing the error between the experimental data and the output of the model. Simulation shows that the estimated parameters using genetic algorithm lead to dynamics of the outputs follow the dynamics of the experimental data.
Keywords : modeling, parameter estimation, genetic algorithm, simulation, validation, errors criteria.
l. INTRODUCTION
In recent years, fed-batch fermentation processes have received considerable attention due to effectiveness in overcoming substrate inhibition, catabolic repression and glucose effect by applying of an appropriate substrate feed rate, see for example (Bastin and van Impe, 1995), (Chattway, et. al. , 1992), (Boskovic and Narendra, 1995). This type of fermentation culture is characterized by time-varying nature where cell concentration, liquid volume and other state variables change significantly during operation. Depending on objectives of the fed-batch fermentation, it is necessary to find the substrate feed rate profile, wh ich minimizes or maximizes the performance objectives. In industrial fermentation, for example, the fed-batch culture of Saccharomyces
cerevisiae known as Baker's yeast is aimed to achieve maximum yield or productivity. Current methods for process design and optimization to determine the substrate feed rate profile rely on the availability of a mathematical model of the bioprocess (Takamatsu, et. af., 1985) (Roubos, el. aI., 1997) (Srinivasan, et. al., 2000a), (Srinivasan, el. at, 2000b). This is due to the fact that most optimization techniques are model-based. In such cases, a good model is a key factor in obtaining the optimal feed rate profile. The growth of S. cerevisiae in fed-batch fermentat ion has received considerable attention since 1965, see (Bijkerk and Hall, 1977). The fermentation in fed batch growth encounters severe nonlinearities, this makes a linear model is insufficient to describe
226
complex and time-varying nature of the fermentation processes. A nonlinear mathematical model can be derived by using mass and energy balance principles (Shuler and Kargi, 1992). However, in order to obtain a mathematical model that describes real mechanism, parameters in the model must be optimized so that the dynamics of the fermentation processes are encountered in the developed model. This paper considers parameter estimation of a non linear model of the fed-batch growth of S. cereV1Slae genetic algorithm. One main advantage of the genetic algorithm compares to other conventional algorithms (such as gradient-based search, linear programming, etc.) is the ability to find the global optimum from multiple optima. In this paper, the genetic algorithm is used to obtain optimal parameters of the nonlinear model by minimizing errors between the output of the developed model and the experimental data. Several variations such as number of generations, mutation and cross over probability, number and length of strings are simulated in order to find appropriate initial conditions of the genetic algorithm.
The state variables XI> X3 and X4 denote biomass concentration, glucose concentration, product concentration, and broth volume and the input UI and u2 are feed rate and feed concentration respectively. in the model are Ilm is specific growth The rate, k. is saturation constant / half-velocity constant, Yp is product yield, Y. is biomass yield and qp is product formation rate.
Ill. PARAMETER ESTIMATION WITH GENETIC ALGORITHM
In this case, there are 5 parameters (Ilm , qp, and Yp) of the model (l) need to be optimized simultaneously. In this optimization, the performance criteria to be minimized is given by an objective function F as follows F == :E (Y model -
(3)
Where the error criteria is defined as sum of square of difference between experimental data and output of the model.
11. MATHEMATICAL MODEL 3.1 Initial Parameter Estimation
A general model of the fed-batch growth of S. cerevisiae is described by the nonlinear state equation x
(x ,u,p)+~(x)
x(O) == Xo
where the process state at time t is denoted by x(t); the substrate feed rate is denoted by u(t). The parameter vector is given by p and the process un modelled dynamic ~ whose exact form is not known. Mathematical model for the growth of S. cerevisiae is first derived by using mass and energy balance principles (Shuler and Kargi, 1992). Since the experiments are carried out with constant temperature, only the mass balance principle is needed. The derivation results in a particular structure or a non linear state of 1'0111' slate variables, two inputs The nonlincar model is given
The main problem in estimation using genetic algorithm is how to determine the initial value of the parameters and their range. In this case, initial parameters are first estimated analytically before genetic algorithm is applied. For this purpose, data from experiment, such as: glucose concentration, biomass concentration and ethanol concentration are analyzed via graphical method. Initial parameters for Ilm and k. can then be estimated from Monod's equation (4)
and initial parameter qp is estimated from product mass balance principle for fed-batch fermentation which is given by (5)
(I)
dl
To estimate initial parameters of Y~ and Yp, the substrate balance equation at the steady state (Fukuda, et al., 1978) is used. (6)
o
where ~! is the growth rate of biomass, which is given by Monod's equation (2)
The data was obtained from experiment held in a fermentor with physical states as follow: temperature 30°C, pH 4.5, air speed flow I wm, initial volume 1.5 L, feed concentration (U2) 10 gIL, feed speed (uJ) 0.104 glL, sampling time 2 hours, and sampling
volume 20 mL. From I si hour until 14"', baker's yeast was grown in batch condition, and the fedbatch condition started at 141h hour until 36'" hour.
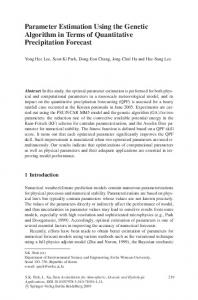
100, 200, and 500 generations. Results of these variations are shown in Fig. I. Simulation shows that larger number of generations (500 generations) has tendency to give smaller error deviation than 100 and 200 generations.
Initial parameter obtained by using equation (4), (5) and (6) with respect to the experimental data are: Ilm = 0,631 h'l; k. = 21,42614 gIL; qp = 0,00007 h'l; Y. = 0,6648 g biomass/g substrate; and Yp = 0,0583 g product/g substrate. These initial parameters are then used to initialize and maintain range of parameters in the genetic algorithm.
850 800
--+-100 generalion> • • •• • 200 gen ....lion.
750
- . - SOO senerlCians
700 650
3.2 Genetic Algorithm
W w
Genetic algorithm begins by initializing a population of candidate solutions to a problem. The initial population is then randomly varied to produce new solutions. All solutions are then selected by measuring with respect to the performance criteria. Those parameters that are below par are not selected in the next iteration until a specific criterion is met.
600 550 500 450 400 350 0
Genetic algorithm is applied to estimate the fittest parameter for the growth of Saccharomyces cerevisiae. Genetic algorithm for this application starts from initial population that corresponds to numerical value of the parameters (Linfield and Penny, 1995). This initial population is generated randomly and then it develops next population according to strings' objective function value.
10
15
Sample
20
25
30
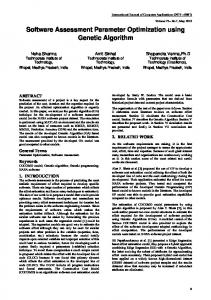
Fig.1 Influence of number of generations (100, 200, 500) to error value in genetic algorithm where: ~E2 = ~ (Y model- YdAII)2 Cross over probability. Variations are given for Pc=0.6, 0.7, 0.8, 0.9, and I. From Fig. 2, it can be seen that Pc = 0.6 gives the lowest error value than other cross over probability. This result conforms De Jong's investigation, see (Goldberg, 1989). At Pc = 0.6 random cross over between strings is sufficient so that premature convergence can be reduced. If cross over probability is higher than Pc = 0.6, the potential strings is lost because of excess cross over between strings.
The five parameters in (I) are optimized simultaneously by using genetic algorithm which has been modified for 5 variables. Each string of the population is divided unto five parts so each part represents parameter values. The genetic algorithm was coded in MA TLAB with following steps: a. Initial population that is generated randomly with certain number and length. The members of the population are binary strings consist zeros (0) and ones (I). b. Fitness evaluation of each string of the population to the objective function F in (3). c. Reproduction of strings with a probabilistic method (e.g., roulette wheel). d. Cross-over between reproduced strings with certain cross over probability. e. Mutation on a random bit with low probability. f. Repeat step b. until the defined limit (convergence or number of generations) is met.
850,0 800,0
_P...o.6 _P...o.7 -p...o.'
750,0 700,0 .
--H--Pc-o.9
650.0
-'-Pc-1.0
'/.,.,l w 600 ,0 550,0 500.0 450.0
In genetic algorithm there are some factors to be considered, such as number of generation, cross over probability, mutation probability. number and length of strings. In order to find initial factors of the genetic algorithm, the effect of these factors are simulated.
400.0 350,0 0
10
15
20
Sample
Fig.2 Influence of cross over probability to error value in genetic algorithm
Numher of Generation. In order to see the influence of number of generation, variations are given for
228
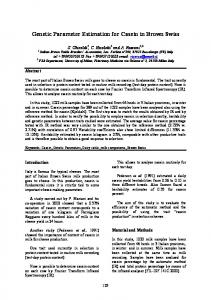
Mutation Probability. Variations given are Pm = 0.1, 0.05, 0.0 I, 0.005, and 0.00 J. Fig. 3 shows that mutation probability gives significant influence to error value. At Pm = 0.1, smaller error value can be reached. The increase of mutation probability maintains sufficient diversity of string so that the searching of better error value can be continued (Goldberg, 1989).
850 .0 r - - - - - - - - - - - - - - - - - , 800 .0 -Pm-O. '
750.0
--+--Pm9l.05 _ _ Pm..().O,
700.0
-Pm-1l005 -Pm~OO'
650 .0
'~ 600.0
Fig. 5. Influence of length of strings to error value in genetic algorithm (bitl = length of strings)
550.0 500.0 450 .0
IV. SIMULATION AND VALIDATION 400 .0
In order to encounter the effect of unmodelled dynamic, a modification that conforms to the nonlinear model developed by (Boskovic and Narendra, 1995) is made by adding parameters a, j3 and X as shown in equation (7). The final model is then obtained as follows. The parameters in the non linear model (7) is then estimated by using genetic algorithm with initial factors: P0=0.6, Pm=O.I, number of strings 25 and length of strings 200 bits.
350.0 . --=----,----,------,---~
o
10
20
15
Sample
Fig.3 Influence of mutation probability to objective error value in genetic algoritlun Number and Length a/Strings Variations of number of string are 5, 10,25,50, and 100 strings. Variations of length of strings are 25, 50, 100, 150, and 200 bits. From Fig. 4, it can be seen that larger number of strings gives smaller error value because of availability of diverse string in larger pool. Length of string limits the number of distinct value of parameters (Linfield and Penny, 1995). Fig. 5 shows that less error can be achieved by using length of strings 200 bits.
dX, dt
dX 2 dt
dX) dt
700 .0
dX 4
r-- - -- - - - - -- --
650.0
dt
f.I""X"X 2 X·(k.+X l )
u,.X, X4
1X.(u 2 -~ . X2) · U,
f.lm ,X"X 2
X4
X·(k. + X 2 )·Y,
_ qp .X,
(7)
Yp
X X).u, qp ' , - - X4 u,
_po p ~5
_pop~'O _pop ~ '~
600.0
Results of the algorithm are optimal parameters: J.lm = 0.5 h-'; Ks = 24 .5161 glL; qp = 0.00007 h-I ; Y, = 0.6839 g biomass / g substrate; and Yp = 0.0452 g product / g substrate. In equation (7), the added constants are found by trial and error that yields a = 5; j3 = 1/3; X =3. The parameters are then applied in the model (7). The response of the outputs is shown in Figure 6 and Figure 7.
_popm20 --popa2~
550.0
'(oj
500 .0 450.0 400.0 350.0
300.0
It can be seen that, at the beginning of fed-batch
fermentation, the substrate concentration increases because the amount of the feed is higher than the biomass consumption. Then, the effect of increasing the population of biomass is the substrate concentration is decreased . The simulation shows good response to the experimental data.
I-----_---~---____.j
o
10
15
Sump!!!
Fig.4 . Influence of number of strings in genetic algorithm (pop = number of strings)
229
The biomass concentration decreases in lag phase because of adaptation to the feed given. After this adaptation phase, the biomass concentration increases. At the beginning of the simulation, there is a discrepancy to experimental data.
larger number of generations, cross over probability (Pc) 0.6, mutation probability (Pm) 0.1, and larger number of strings.
REFERENCES
., ',:';, -" - --1
al,
lB!
'.' 16i
~,,,,,
Xl
I
i
141
I
12i
I
I
~101
s:/
I
'-:1,
R BI 61 I
4! 2i 0' 10
j !
15
al
35
JJ
25 t (In.r)
Fig. 6. Simulation and validation ofbiomass concentration (X I) and substrate concentration (X2) (solid line"" simulation).
Xl
.
""
51
" 15
20
25
" 11," JJ
35
40
I (to.r)
rig. 7. Simulation and validation ofproduc concentration (X3)(solid line = simulation)
V. CONCLUSIONS Genetic algorithm has successfully estimated all five parameters of the mathematical model of the growth of Saccharomyces cerevlslae in fed-batch fermentation process simultaneously. This model has good agreement with experimental data as can be seen on the simulation above. It is found that genetic algorithm gives good performance on the model in
Bastin, G. and 1.F. van Impe (1995). Nonlinear and Adaptive Control in Biotechnology. Eur. J Control, ], 37-53. Bijkerk, A. H. R. and R. J. Hall (1977). A Mechanistic Model of The Aerobic Growth of Saccharomyces cerevisiae, Biotechnology and Bioengineering Journal, 19,267-296. Boskovic, DJ . and K.S. Narendra (1995). Comparison of Linear, Nonlinear and Neural Network based Adaptive Controllers for A Class of Fed-batch Fermentation Process. Automatica, 3],817-840. Chattaway, T., G.A. Montague and AJ. Morris (1992). Fermentation Monitoring and Control. In: Biotechnology CHJ. Rehm and G. Reeds. (Ed»,Vol. 3,319-354. VCH Weinheim. Fukuda, H., T. Shiotani, W. Okada and H. Morikawa (1978). A Mathematical Model of The Growth of Baker's Yeast Subject to Product Inhibition, J Fermentation Technology, 56, 361-368. Goldberg, D.E., Genetic Algoritms in Search, Optimization & Machine Learning C1989). Addison-Wesley Publishing Company, Inc., Massachusetts. Linfield, G. and 1. Penny (1995). Numerical Methods Using MATLAB. Ellis Horwood Limited, Hertfordshire. Roubos, J.A., CD. de Gooijer, G. van Straten and AJ .B. Boxtel (1997). Comparison of Optimization Methods for Fed-bacth Cultures of Hybridoma Cells. Bioprocess Engineering, 17,99-102. Shuler, M, L. and F. Kargi (1992). Bioprocess Engineering: Basic Concepts. Prentice-Hall [nc., New Jersey . Srinivasan, B., S. Palanki, and D. Bonvin (2000a). A Tutorial on the Optimization of Batch Processes: I. Characterization of the Optimal Technical Report Institut Solution, d'automatique, Ecole Polytechnique Federale de Lausanne, Lausanne. Srinivasan, B., S. Palanki, and D. Bonvin (2000b). A Tutorial on the Optimization of Batch Processes: 11. Handling Uncertainty Using Measurements, Technical Report Institut d'automatique, Ecole Poly technique Federale de Lausanne, Lausanne. Takamatsu, T., S. Shioya, S. Okada and M. Kanda (1985). Profile Control Scheme in a Baker's Yeast Fed-batch Culture. Biotechnology and Bioengineering, 27, 1675-1686.
230