Fadi M. Albatsh1,*, Shameem Ahmad2, Saad Mekhilef2, Ibrahim Alhamrouni1, Mohd Fairuz Abdul Hamid1
J. Electrical Systems 13-2 (2017): 398-414 Regular paper Power Flow Control using Fuzzy Based UPFC under different operating conditions
JES Journal of Electrical Systems
Now a days power system network operates at different states due to variation in load demand. As a result, the power flow in transmission line keeps on changing which needs to be controlled precisely. Therefore, in this paper an attempt to control power flow in transmission line at various operating states of power system network using Unified power flow controller (UPFC) is considered. Fuzzy logic controller (FLC) has been employed to provide dynamic control of series and shunt converters of UPFC because it adapts wide range of dynamic changes of power sys-tem operations easily. The performance of the FLC based UPFC to control power flow under three operating states (nominal loading, variable loading and different referencing of power) of IEEE-14 bus system has been observed in PSCAD environment. The results show that FLC based UPFC is capable of controlling power flow in transmission line in whatever states the power system network is operating. In addition, to validate the statement that FLC based UPFC cope up with networks variation flexibly, the simulation results are compared with proportional integral (PI) based UPFC. The results show that the FLC based UPFC has better power flow capability compared to PI controller.
Keywords: FACTS, UPFC, Power Flow Control, Fuzzy Logic, PSCAD. Article history: Received 24 June 2016, Accepted 13 Abril 2017
1. Introduction Modern power system network does not operate in a single operating mode. Its states of operation keep on changing due to variation in load demand, integration of renewable energy sources with the grid and electric vehicles charging unit. As a fact, the power flow in transmission line does not remain constant which has a grave impact on power system stability. To re-solve this issue for last few decades in many literatures UPFC has been used which combines the functions of several FACTS (STATCOM and SSSC) devices and is capable of providing support concurrently or selectively for voltage regulation, series compensation, phase angle regulation, and control of the active or reactive power separately transmitted over the line [1-4]. Though UPFC implies many advantages, but its controller design still being a matter of challenge since it is a multi-variable controller. Many control techniques had been implemented in literatures to control UPFC for various power system applications. Nonlinear control of UPFC has been presented in [5, 6] to improve damping of power oscillations. In [7, 8], decoupled control approach based UPFC has been designed to control the active and reactive powers flow in transmission line. Cross-coupled controller in [9-11] has been implemented by considering the variation of the power system parameters. In [12] *
Corresponding author: Fadi M. Albatsh, Electrical Engineering Section, Universiti Kuala Lumpur, International College, 53100 Gombak, Selangor, Malaysia, E-mail:
[email protected] 1 Electrical Engineering Section, Universiti Kuala Lumpur, International College, 53100 Gombak, Selangor, Malaysia 2 Power Electronics and Renewable Energy Research Laboratory (PEARL), Department of Electrical Engineering, University of Malaya, 50603 Kuala Lumpur, Malaysia. Copyright © JES 2017 on-line : journal/esrgroups.org/jes
J. Electrical Systems 13-2 (2017): 398-414
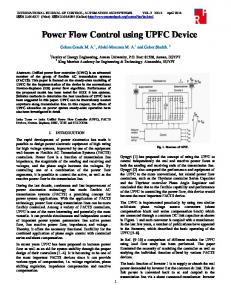
the coordination control based UPFC has been proposed to control the power flow in transmission network where the interaction between UPFC converters has been eliminated. There is a common requirement of all control methods discussed above is the need of output feed control system for regulating the power system parameters [7, 13, 14]. In all these control techniques PI controller has used. The disadvantages of PI based control algorithms is that to tune the optimum parameters i.e. Kp, Ki of PI controller, trial and error method must be performed. Recently, sliding mode controller has been used in [13] to design UPFC control system. Note, however, that system robustness is not assured until the sliding mode is reached. The main drawback of SMC is “chattering” which can excite undesirable high-frequency dynamics [15]. Intelligent controller artificial neural network (ANN) has been used to pacify the problem of PI controllers, in [16]. While the generation of the training patterns of the ANN controller for large power system network is difficult. The common drawbacks of PI, sliding mode and ANN based UPFC control system is all these controllers regulate the power perfectly when the power system is operating at single operating mode. It has not been verified whether these controllers can cope up with any change in the power system dynamics for various operating point. To overcome the above mentioned problem, FLC based controller for UPFC has been pro-posed in this paper. That is FLC is employed to develop the control algorithms for both shunt and series converters of UPFC. The advantages of FLC over other controllers are it doesn’t need an accurate mathematical model of the system and it is robust to power system parameters changes and dynamic operations. IEEE-14 bus system is considered as a case study. The performance of the developed FLC based UPFC has been tested in PSCAD environment for three operating states of the power system network namely nominal loading, variable loading and different referencing of power. Apart from this, the developed FLC based UPFC’s performance is compared with PI based UPFC’s performance The organization of the remaining paper is as follows: Section (2) introduces the dynamic model of UPFC. Section (3) presents an extensive description on shunt and series controllers of UPFC. A brief explanation of IEEE-14 bus system is presented in Section (4). Section (5) exe-cutes the simulation results and discussions after implementing FLC based UPFC including a comparison with PI controller. Finally, a conclusion has been reported. 2. UPFC model A dynamic model of the UPFC is shown in Fig. 1. UPFC connects to the transmission line with shunt and series voltage source converters (VSC) which are coupled via a common DC link. Normally, the shunt VSC is considered as (STATCOM) and series one as a static compensator (SSSC). Low pass AC filters are connected in each phase to prevent the flow of harmonic cur-rents generated due to switching. The transformer connected at the output of converters to pro-vide the isolation, modify voltage/current levels and also to prevent DC capacitor being shorted due to the operation of various switches. Insulated gate bipolar transistors (IGBTs) with anti-parallel diodes are used as switching devices for both converters.
399
Fadi M. Albatsh et al: Power Flow Control using Fuzzy Based UPFC ...
Sending Bus Is
Recieving Bus Iline
Zse Nse:1
Vr
Shunt Transformer Series Transformer Series Converter
Shunt Converter
Zsh
Vs
Nsh:1
ISh
Pse
Idc + Psh
Vdc Vsh
Vse -
Vmag_sh Theta_sh
Vmag_se Theta_se
Fig. 1. UPFC model in PSCAD 3. UPFC Controller UPFC controller consists of shunt and series controllers for both shunt and series converters. To achieve real and reactive power flow control in transmission line, UPFC controller has been designed to control shunt current, magnitude and angle of the series injected voltage. 3.1. Shunt controller The control algorithm of shunt controller builds inside PSCAD software is shown in Fig. 2(a) and 2(b). Fig. 2(a) represents the FLCs of sending - end voltage and DC link voltage to generate (Vd_sh) and (Vq_sh). Fig. 2(b) illustrates the internal architecture of SPWM technique to generate the firing signals for the UPFC shunt converter switches. The shunt converter draws current from the sending - end of the transmission line to keep the voltage of the DC link capacitor at its reference value by drawing real power from the line and to maintain the sending - end voltage at its reference value by absorbing or providing reactive power to the transmission line. To simplify the dynamic analysis of the shunt current (Ish) controller, three phase shunt current (Ia_sh, Ib_sh and Ic_sh) have been converted to d-axis and q-axis components in a synchronously rotating d-q frame (Idsh_measured and Iqsh_measured). For obtaining the objectives the sending-end voltage (Vs_ measured) is measured instantly, subtracted from its reference value (Vs_ref) as per unit (p.u), which reveals Vs_error. This error signal and the rate of change of error (Vs_error_rate) have been given as inputs to another FLC block to control the sending – end bus voltage. The output of FLC gives reference quadrature component (Iqsh_ref) of the shunt current (Ish). The measured value of the quadrature shunt current (Iqsh_measured) has been compared with obtained reference quadrature shunt current (Iqsh_ref) and send to PI controller to protect the shunt converter from overcurrent flow. The parameter of the PI controller gains (Kp and Ki) are given in Table 1. The gains of the PI controller is obtained by trial and error method.
400
J. Electrical Systems 13-2 (2017): 398-414
Table 1. PI controller gains of shunt and series controllers of UPFC Controller Shunt controller Series controller
Kp 0.25 0.15
Ki 0.8 0.9
The output of the PI controller will be multiplied with impedance (WLsh) to produce the quadrature component of the injected shunt voltage (Vq_sh). Meanwhile, the difference between measured DC link capacitor voltage (Vdc_ measured) and its reference value (Vdc_ref) is obtained to get Vdc_error. FLC with inputs error signal and the rate of change of error (Vdc_error_rate) are employed to obtain the reference direct component (Idsh_ref) of the shunt current. The measured value of the direct shunt current (Idsh_measured) has been compared with obtained reference direct shunt current (Idsh_ref) and send to PI controller. By multiplying the output of the PI controller with impedance (WLsh), a direct component of the injected shunt voltage (Vd_sh) can be found. The magnitude (Vmag_sh) and phase angle (α_sh) of the injected voltage by the shunt converter have been determined as follows:
Vmag _ sh = Vd2_sh + Vq2_sh
α _ sh = tan −1
Vq _ sh Vd _ sh
(1) (2)
To generate the switching firing signals, sinusoidal pulse width modulation (SPWM) has been used. For this purpose the phase angle of the reference sine wave has obtained from the difference (angle_s − α_sh) of the two angles where the angle (α_sh) is determined from equation (2) and the angle (angle_s) is the sending-end voltage which has been extracted from phase locked loop (PLL). The magnitude (Vmag_sh) of the shunt injected voltage obtained from equation (1) has been used as a magnitude for the reference sine wave. In the SPWM technique, the reference signals are compared with the carrier (triangle) signal, which has a switching frequency of 4.5 KHz, to generate the switching firing signals (g1_sh, g4_sh, g3_sh, g6_sh, g5_sh and g2_sh) for the shunt converter switches. The linguistic variables of error are NL (negative large), NM (negative medium), NS (negative small), VS (very small), PS (positive small), PM (positive medium), and PL (positive large). Similarly error rates are NL1 (negative large1), NM1 (negative medium1), NS1 (negative small1), VS1 (very small1), PS1 (positive small1), PM1 (positive medium1), and PL1 (positive large1). The linguistic variables of output are BN (big negative), MN (medium negative), SN (small negative), ZO (zero output), SP (small positive), MP (medium positive), and BP (big positive). All the membership functions of the FLCs are shown in Figs. 3(a), b and c. The fuzzy based input and output membership functions are formed in C-program by using one dimensional array concept. Similarly all other input and output membership functions of fuzzy based controllers are fuzzified by using one dimensional array concept. The fuzzy rule base is used in IF-THEN rule form to assign the input and output control. The rules of FLCs are summarized in Table 2.
401
Fadi M. Albatsh et al: Power Flow Control using Fuzzy Based UPFC ...
(a) Reference A
Vmag_sh
g1_sh
sin
Theta_sh
Comparator
g4_sh
Frequency Reference B
Vmag_sh Theta_sh
+ + 120°
g3_sh Comparator
g6_sh
Frequency Reference C
Vmag_sh Theta_sh
/
sin
g5_sh
sin
+ 120°
Comparator
g2_sh
Frequency
Carrier Signal
(b) Fig. 2. (a) FLC of sending-end voltage and DC link voltage to generate Vd_sh and Vq_sh (b) SPWM technique to generate firing signals for shunt converter of UPFC
Error
Table 2. Rule table for Vs and Vdc FLCs Error - rate
402
PL PM PS VS NS NM NL
PL1 BP BP BP MP MP SP ZO
PM1 BP BP MP MP SP ZO SN
PS1 BP MP MP SP ZO SN MN
VSI MP MP SP ZO SN MN MN
NS1 MP SP ZO SN MN MN BN
NM1 SP ZO SN MN MN BN BN
NL1 ZO SN MN MN BN BN BN
J. Electrical Systems 13-2 (2017): 398-414
NL
NM
NS
VS
PS
PM
PL
0.0
0.225
0.45
0.675
Membership Degree
1
0 -0.9
-0.675
-0.45
-0.225
0.9
Error (Vs or Vdc)
(a) NL1
NM1
NS1
VS1
PS1
PM1
PL1
-0.05
0.0
0.05
0.10
0.15
Membership Degree
1
0 -0.20
-0.15
-0.10
0.20
Error – rate (Vs or Vdc)
(b) BN
MN
-0.36
-0.24
SN
ZO
SP
MP
BP
-0.12
0.0
0.12
0.24
0.36
Membership Degree
1
0 -0.48
0.48
Output ( Iqsh_ref or Idsh_ref )
(c) Fig. 3. Membership functions of (a) Error, (b) Error-rate and (c) Iqsh_ref or Idsh_ref 3.2. Series controller The controller of series converter is illustrated in Fig. 4(a). The series converter controls the active and reactive power flow through the transmission line by injecting a voltage in series with the line current having controllable magnitude and angle. The active and reactive power (P_actual and Q_actual) flow through the line are measured and subtracted from their references (P_ref and Q_ref). These revealed the error signals (P_error and Q_error). These two error signals and their rate of change (P_error_rate and Q_error_rate) are given as inputs to two fuzzy logic controllers (FLCs) as shown in Fig. 4(a). The outputs of the two FLCs provided the orthogonal components of the series injected voltage (Vq_se and Vd_se). The magnitude and phase angle of series injected voltage are obtained through the following equations:
Vmag _ se = Vd2_ se +Vq2_ se
(3)
403
Fadi M. Albatsh et al: Power Flow Control using Fuzzy Based UPFC ...
α _ se = tan −1
Vq _ se
(4)
Vd _ se Vr_a
α _r
Vr_b
PLL
Vr_c
P_ref
-
SPWM Vmag_se
α _se
Series Converter
Vq _se
P_error
+ -
Theta_se
+
FLC of active power flow
P_error_rate
P_actual Q_ref
Q_error
+
-
Q_error_rate
FLC of Reactive power flow
Vd _se
Q_actual
(a) Reference A
Vm_se
g1_se
sin
Phase
Comparator
g4_se
Frequency Reference B
Vm_se Phase
/
g3_se
sin
+ +
Comparator
g6_se
120° Frequency
Phase
g5_se
Reference C
Vm_se
sin Comparator
+ -
g2_se
120° Frequency
Carrier Signal
(b) Fig. 4. (a) Series controller of real and reactive powers to generate Vmag_se and α_se (b) SPWM technique to generate firing signals for series converter of UPFC As like shunt converter controller in series controller also the process of switching signal generation has been conducted by using SPWM technique. The internal configuration of the SPWM technique used to generate switching signals for series converter switches is presented in Fig. 4(b). The magnitude of the reference sine wave has been obtained from equation (3) and the phase angle (Theta_se) is obtained by finding the difference (α_r −
404
J. Electrical Systems 13-2 (2017): 398-414
α_se) of receiving-end voltage angle (α_r) obtained via PLL and angle (α_se) obtained from equation (4). In SPWM, the reference sine waves are compared with carrier (triangle) signal having a switching frequency of 4.5 KHz. The outputs of the SPWM have been provided as firing signals (g1_se, g4_se, g3_se, g6_se, g5_se and g2_se) for the series converter switches. 4. Test system To analyse the performance of the proposed FLC based UPFC, this study considers IEEE-14 bus system as a case study. A single line model of the IEEE-14 bus network is depicted in Fig. 5. The parameters of the network is taken from [17]. The location of UPFC in IEEE-14 bus network has been chosen the line connecting buses 9-14 [18]. 12
C Synchronous
14
13
Condenser
UPFC 10 11
9
2
3
8
1
1 2
C
1 2
6
7
1 5
C
4
2
3
C
Fig. 5. Single line diagram of IEEE 14 bus system 5. Results and Discussions In this section, the simulation results for analyzing the performance of the proposed controller are presented. The simulations are conducted for the following three conditions: 1. Under normal operating condition. 2. For variable loading condition. 3. For different power referencing condition. 5.1 Performance analysis of the FLC based UPFC under normal loading condition In this case, the performance of proposed FLC based UPFC is tested for the nominal operating state of the network. The reference values of power system parameters for line 914 are randomly chosen as: active power 0.072 p.u (7.2 MW), reactive power 0.09375 p.u (9.375 MVAR), and line voltage (1.01 p.u). The simulation is conducted till t= 2 sec without UPFC as shown in case “a” of Figs. 6 and 7. The measured values of active and reactive power flow through the line 9-14 without
405
Fadi M. Albatsh et al: Power Flow Control using Fuzzy Based UPFC ...
UPFC were 0.06251 p.u. (6.21 MW) and 0.0998 (9.98 MVAR) respectively. UPFC based on PI and FLC are connected to the line 9-14 at t = 2 sec as shown in case”b” of Figs. 6 and 7. From Fig. 6, case”b”, it has been found that with PI based UPFC the active power flow was 0.069 p.u (6.9 MW) which has been improved by 8.66 % of the nominal value, where with FLC based UPFC active power flow has been improved by 13.39% of the nominal value i.e. 0.07194 p.u (7.194 MW). With FLC based UPFC reactive power flow has reached to 0.09394 p.u (9.394 MVAR) which is closed to the reference value 0.09375 p.u (9.375 MVAR). In contrast, reactive power flow over the line with PI UPFC falls short by 0.00383 p.u from the reference value i.e. 0.09758 p.u (9.758 MVAR) as shown in Fig. 7, case”b”.
P (with fuzzy UPFC)
P (without UPFC) 0.072
Active power (pu)
0.063 0.054
P (with PI UPFC)
0.045 0.036 0.027
Case “a” Without UPFC
0.018
Case “b” With UPFC
0.009 0.00 0.00
1.00
2.00
3.00
4.00
5.00
Time (s)
Fig. 6. Active power flow through line 9-14
Q (with PI UPFC)
Q (without UPFC)
Reactive Power (pu)
0.1105 0.0935 0.0765
Q (with fuzzy UPFC)
0.0595 0.0425 0.0255
Case “a” Without UPFC
Case “b” With UPFC
0.0085 0.00 0.00
1.00
2.00
3.00
4.00
5.00
Time (s)
Fig. 7. Reactive power flowing through line 9-14 To further show the effectiveness of the proposed FLC based UPFC in terms of fast response, the simulation has been carried out up to 1s for both active and reactive power flow on the line 9-14 with respect to settling time. Figs. 8 and 9 show the settling time response of active and reactive power flows without UPFC, with PI based UPFC and with FLC based UPFC and in Table 3 these values are summarized.
406
J. Electrical Systems 13-2 (2017): 398-414
Table 3. Active and Reactive power flow on line 9 -14 with respect to settling time Settling time (s) Settling time for active power flow response Settling time for reactive power flow response
Without UPFC 0.71 s
With PI UPFC 0.47 s
With FLC based UPFC 0.285 s
0.685 s
0.60 s
0.29 s
P (without UPFC) P (with PI UPFC) P (with Fuzzy UPFC)
Active Power (pu)
0.072 0.063 0.054 0.045 0.036 0.027 0.018 0.009 0.00 0.00
0.10
0.20
0.30
0.40
0.50
0.60
0.70
0.80
0.90
1.00
Time (s)
Fig. 8. Active power flow on line 9-14 with respect to settling time
Q (without UPFC) Q (with PI UPFC) Q (with Fuzzy UPFC) 0.1105
Reactive Power (pu)
0.0935
0.0765
0.0595
0.0425
0.0255
0.0085
0.00 0.00
0.100
0.200
0.300
0.400
0.500
0.600
0.700
0.800
0.900
1.000
Time (s)
Fig. 9. Reactive power flow on line 9-14 with respect to settling time It can be noticed from Figs. 8 and 9 and Table 3 that the proposed FLC based UPFC has shorter settling time for the active and reactive power flow compared to PI based UPFC and without UPFC. One of the UPFC advantages is to maintain the line voltage of the transmission network. To address this case, the response of the proposed FLC based UPFC controller for line voltage is shown in Fig 10.
407
Fadi M. Albatsh et al: Power Flow Control using Fuzzy Based UPFC ...
Sending – end voltage (pu)
Vs (without UPFC) Vs (with fuzzy UPFC) 1.045 1.00 0.950 0.855 0.760 0.665 0.570 0.475 Case “a” 0.380 Without UPFC 0.285 0.190 0.095 0.00 0.0 1.0 2.0
Vs (with PI UPFC)
Case “b” With UPFC
3.0
4.0
5.0
Time (s)
Fig. 10. Sending end voltage across line 9-14 Here also, the simulation is conducted till t= 2 sec without UPFC as shown in case “a” of Fig. 10. The measured value of the line voltage across without UPFC were 0.9886 p.u. According to Fig. 10, case”b”, after Connecting UPFC at t= 2 sec, the line voltage has reached to 0.9931 p.u for PI based UPFC and this value has become 1.008 p.u for FLC based UPFC. The overall network voltage profile is demonstrated in Fig. 11 and it has been observed that with FLC based UPFC the voltages across all the buses of the network have been improved better than PI based UPFC.
To improve theVoltage power factor the power Fig. 11. profileof across all the system buses innetwork, IEEE-14the busreactive system power flow in the line should be decreased by reducing the phase angle difference ( θ se − θrec ) between both ends of the line. Fig. 12 shows the angle difference between buses 9-14 before and after connecting the UPFC. From Fig. 12, it can be observed that the angle difference without UPFC was 0.23 degrees. At t= 2sec, the UPFC is connected to the line 9-14. With PI based UPFC, the angle difference is reduced to 0.145 degrees. However, the proposed FLC based
408
J. Electrical Systems 13-2 (2017): 398-414
UPFC has successfully reduced the angle difference to 0.0753 degrees offering more improvement in power factor correction compared to PI based UPFC.
Angle (deg)
without UPFC
with PI UPFC with Fuzzy UPFC
0.27 0.24 0.21 0.18 0.15 0.12 0.09 0.06 Case “a” 0.03 Without UPFC 0.00 1.00 2.00 0.00
Case “b” With UPFC 3.00
4.00
5.00
Time (s)
Fig. 12. Angle difference ( θ se − θ rec ) of line 9-14 The response of the DC link capacitor voltage is shown in Fig. 13. As per Fig. 13, before t=2 sec, the UPFC was not connected to the line, therefore DC link capacitor wasn’t charging. At t=2 sec, UPFC was connected to the line 9-14. The DC link capacitor was charged up to 9.45 kV based on PI UPFC which took 4.6 s to reach to its steady state value. However, the capacitor charged to 10.435 kV with a time period of 2.75 s when FLC based UPFC was in operation. For both the cases the reference charged value was set to 10.45 kV.
10.4 9.6 8.8 8.0 7.2 6.4 5.6 4.8 4.0 3.2 2.4 1.6 0.8 0.00 0.0
Before connecting UPFC
volatge (kV)
Vdc (Reference)
2.0
Vdc (With Fuzzy UPFC)
4.0
6.0
Vdc (with PI UPFC)
8.0
10.0
12.0
14.0
Time (s)
Fig. 13. DC voltage across DC link capacitor in IEEE-14 bus system
The waveforms of the series injected voltage for both PI and FLC based UPFC are presented in Fig. 14. From Fig. 14, it can be noticed that the UPFC was connected to the line 9-14 at t=2sec. The series injected voltage for both PI and FLC based UPFC were 4.5 kV and 5.4 kV respectively.
409
Fadi M. Albatsh et al: Power Flow Control using Fuzzy Based UPFC ...
Vinj (with PI UPFC)
Vinj (with Fuzzy UPFC) 6.0
Voltage (kV)
4.0 2.0 0.0 -2.0 -4.0
With UPFC
Without UPFC
-6.0 1.90
2.00
2.01
2.02
2.03
2.04
2.05
Time (s)
Fig. 14. Series injected voltage in line 9-14
One important objective of using the UPFC is to reduce the power loss in the transmission network. Table 4 represents the calculated power losses before and after connecting UPFC. It is seen that the real power loss is observed11.04893 MW without UPFC which reduced to 10.05 MW and 9.2814 MW after PI and FLC based UPFC respectively are place to the network. The reactive power loss has been reduced 3.9568 MVAR (40.2095 MVAR) and 5.681 MVAR (38.48 MVAR) more with PI and FLC based UPFC respectively compare to no UPFC (44.16 MVAR). 5.2 Performance analysis for FLC based UPFC under variable loading condition The response of the proposed FLC based UPFC under load variation has been tested to validate its robustness over a wide range of operating points. Thereby, four loading conditions are considered for simulation. The simulation has run for 4 sec. and each second the load across bus 14 has kept different. The reference values of active power, reactive power and line voltage are kept to 0.065 p.u., 0.091 p.u. and 1.018 p.u. for this analysis. Four loading conditions are normal loading, 5% PQ load increase, 10% PQ load increase and 10% PQ load decrease at bus 14 which are addressed as case ‘a’, ‘b’, ‘c’ and ‘d’ respectively in Fig. 15. Till t=1 sec. the simulation has run without UPFC under nominal loading condition which is termed as case ‘a’ in Figs. 15 and 16. During that period the active and reactive power flow across line 9-14 were 0.0621 p.u. and 0.0998 p.u. respectively. However, when UPFC connected to the line, the active and rective power have started following almost the reference real and reactive power of 0.0655 p.u. and 0.0915 p.u. respectively. For case ‘b’ and ‘c’ according to Figs. 15 and 16, the PQ load at bus 14 has been increased by 5% and 10% at t=1 sec. and t=2 sec. respectively. As a result, from t=(1-2) sec. the active and reactive power flow through line 9-14 have increased to 0.068 p.u. and 0.107 p.u. respectively, where for t=(2-3) sec. active and reactive power flow has reached to 0.075 p.u. and 0.113 p.u. respectively. For both the cases when at t=2 sec. UPFC has connected to the line 9-14 active and reactive power flow has become 0.0653 p.u. and 0.091 p.u. At t= 3 sec, in case ‘d’, PQ load at bus 14 has decreased by 10% which has brought the active and reactive power flow across line 9-14 to 0.058 p.u. and 0.084 p.u. respectively. For this case also the flow of active and reactive power through line 9-14 has started following the reference value due to the connection of UPFC.
410
J. Electrical Systems 13-2 (2017): 398-414
With fuzzy based UPFC Without UPFC 0.080 0.070
Active Power (pu)
0.060 0.050 Case “ a ”
Case “ c ”
Case “ d ”
PQ Load increment by 10%
PQ Load decrement by 15%
Case “ b ”
0.040 PQ Load increment by 5%
Normal load
0.030 0.020 0.010 0.00
0.0
1.0
2.0
3.0
4.0
Time (s)
Fig. 15. Active power flow under PQ load variation at bus 14
With fuzzy based UPFC Without UPFC
Reactive Power (pu)
0.100 0.080 Case “ a ”
Case “ b ”
Normal load
PQ Load increment by 5%
Case “ d ”
Case “ c ”
0.060 0.040
PQ Load decrement by 15%
PQ Load increment by 10%
0.020 0.00 0.0
1.0
2.0
3.0
4.0
Time (s)
Fig. 16. Reactive power flow under PQ load variation at bus 14
From the above discussion it can be concluded that regardless of the load variation FLC based UPFC has maintained the active and reactive power flow through line 9-14 at their preffered reference values. Further, the response of the line voltage has been tested to validate the effectiveness of the proposed FLC based UPFC to maintain the line voltage under load variation condition. The line voltage at bus 14 was (1.008 p.u) under normal load condition as shown in case “a” of Fig. 17. The PQ load at bus 14 has been increased by 5% and 10% in case “b” and “c” respectively, while the PQ load has been decreased by
411
Fadi M. Albatsh et al: Power Flow Control using Fuzzy Based UPFC ...
15% in case “d”. The response of the line voltage at bus 14 for these load variations is shown in Fig. 17.
With fuzzy based UPFC Without UPFC 1.190 1.105 1.020 0.935
Voltage (p.u.)
0.850 0.765 0.680 0.595 0.510 0.425
Case “ a ”
Case “ b ”
Normal load
PQ Load increment by 5%
0.340 0.255 0.170
Case “ d ”
Case “ c ”
PQ Load decrement by 15%
PQ Load increment by 10%
0.085 0.00 0.0
1.0
2.0
3.0
4.0
Time (s)
Fig. 17. Line voltage at bus 14 under PQ load variation It can be observed from Fig. 17 that FLC based UPFC followed the reference line voltage regardless of the load variation. Thus, proposed FLC based UPFC can work well in different operating points and different load variations. 5.3 Performance analysis for proposed FLC based UPFC with respect to reference changes To verify the performance of UPFC with reference changes, the simulations are conducted to control power flow according to different active and reactive power references. In this regard, this research employs three different references for both active and reactive power flows. The active power flow reference “1”, “2” and “3” have been set to 0.060 p.u (6 MW), 0.072 p.u (7.2 MW) and 0.080 p.u (8 MW) respectively. Similarly, reactive power flow reference “1”, “2” and “3” have been chosen as 0.098 p.u (9.8 MVAR), 0.09275 p.u (9.275 MVAR) and 0.084 p.u (8.4 MVAR) respectively. The results obtained for above references with PI and FLC based UPFC are illustrated in Figs. 18 and 19 whereas Table 5 provides their comparison. It can be noticed from Figs. 18 and 19 that FLC based UPFC can successfully control power flow in transmission line at any mentioned reference with high accuracy compared to PI based UPFC. The accuracy of FLC based UPFC for reference “1”, “2” and “3” are 98.65%, 99.18% and 98.78% respectively. On the contrary, the accuracy of PI based UPFC for reference “1”, “2” and “3” are 91.84%, 93.95% and 93.52% respectively. The accuracy level of FLC based UPFC is higher than PI based UPFC by 6.81 %, 5.23%, and 5.26% for reference “1”, “2” and “3” respectively. Thus, FLC based UPFC due to its flexibility in dealing with dynamic changes has higher efficiency over PI based UPFC.
412
J. Electrical Systems 13-2 (2017): 398-414
P(with fuzzy UPFC) P(with fuzzy UPFC)
0.084 0.077
P(with fuzzy UPFC)
0.070
Active Power (pu)
0.063
P(with PI UPFC)
0.056
P(with PI UPFC)
0.049 0.042
P(with PI UPFC)
0.035 0.028 0.021
Reference “1”
Reference “2”
Reference “3”
0.014 0.0070 0.00 0.00
0.50
1.00
1.50
2.00
2.50
3.00
Time
Fig. 18. Active power flow on line 9-14 with reference changes
Table 5. Performance analysis of PI and FLC based UPFC power flow with respect to reference changes
Reference “1” Reference “2” Reference “3”
Reference value Real Reactive Power Power (MW) (MVAR) 6 9.8
PI UPFC Real Reactive Power Power (MW) (MVAR) 5.55 9.985
Fuzzy UPFC Real Reactive Power Power (MW) (MVAR) 5.93 9.808
Accuracy (%) PI Fuzzy based based UPFC UPFC 92.5% 98.83%
7.2
9.275
6.9
9.658
7.184
9.295
94.16%
99.33%
8
8.4
7.783
8.814
7.944
8.501
93.21%
98.67%
5. Conclusion This paper has presented real time implementation of a FLC based UPFC to control the transmission line power flow. The proposed controller is validated on IEEE 14 bus network. The performance of the proposed controller is tested under different references, and load variations. Furthermore, the response of proposed FLC based UPFC is compared to PI based UPFC. The results showed that proposed FLC based UPFC has enhanced power flow ability, improved bus voltages and reduced the power losses of the networks more than PI based UPFC. FLC based UPFC enhanced active power flow by 5.86 %, and reduced power losses
413
Fadi M. Albatsh et al: Power Flow Control using Fuzzy Based UPFC ...
by 6.95% com-pared to those without UPFC condition. Moreover, a comparison of different conventional controllers proved the robustness of FLC based UPFC over other controllers. Thus, FLC based UPFC has successfully controlled power flow dynamically in transmission line at any mentioned references, at different load variations with high accuracy. References [1] [2] [3]
[4]
[5]
[6]
[7]
[8]
[9] [10]
[11]
[12] [13]
[14] [15] [16]
[17] [18]
414
B. Mahdad, T. Bouktir and K. Srairi, "Strategy based PSO for Dynamic Control of UPFC to Enhance Power System Security," Journal of Electrical Engineering & Technology, Korea, Vol. 4, No. 3, pp. 315-322, 2009. M. Pereira and L. C. Zanetta, "A current based model for load flow studies with UPFC," IEEE Transactions on Power Systems, vol. 28, pp. 677-682, 2013. F. M. Albatsh, S. Mekhilef, S. Ahmad, H. Mokhlis, and M. Hassan, "Enhancing power transfer capability through flexible AC transmission system devices: a review," Frontiers of Information Technology & Electronic Engineering, vol. 16, pp. 658-678, 2015. S. Ahmad, F. M. Albatsh, S. Mekhilef, and H. Mokhlis, "An approach to improve active power flow capability by using dynamic unified power flow controller," in IEEE Innovative Smart Grid TechnologiesAsia conference(ISGT Asia), 2014, pp. 249-254. A. M. Shotorbani, A. Ajami, M. P. Aghababa, and S. H. Hosseini, "Direct lyapunov theory-based method for power oscillation damping by robust finite-time control of unified power flow controller," Generation, Transmission & Distribution, IET, vol. 7, 2013. F. Albatsh, S. Ahmad, S. Mekhilef, H. Mokhlis, and M. Hassan, "Optimal Placement of Unified Power Flow Controllers to Improve Dynamic Voltage Stability Using Power System Variable Based Voltage Stability Indices," PloS one, vol. 10, pp. e0123802-e0123802, 2015. L. Slimani and T. Bouktir, "Application of Differential Evolution Algorithm to Optimal Power Flow incorporating FACTS: a case study, " Journal of Advanced Sciences & Applied Engineering, vol. 1, pp. 815, 2014. P. García-González and A. García-Cerrada, "Detailed analysis and experimental results of the control system of a UPFC, " in IEE Proceedings-Generation, Transmission and Distribution, vol. 150, pp. 147-154, 2003. A. Kannan and R. Kayalvizhi, "Modeling and implementation of dq control system for a unified power flow controller," International Journal of Engineering and Technology, vol. 2, pp. 450-457, 2010. H. Fujita, H. Akagi, and Y. Watanabe, "Dynamic control and performance of a unified power flow controller for stabilizing an AC transmission system," IEEE Transactions on Power Electronics, vol. 21, pp. 1013-1020, 2006. S. Hosseini and A. Ajami, "Voltage regulation and transient stability enhancement of a radial AC transmission system using UPFC," in 30th Annual Conference of IEEE Industrial Electronics Society, IECON. 2004, pp. 1150-1154. S. Kannan, S. Jayaram, and M. Salama, "Real and reactive power coordination for a unified power flow controller," IEEE Transactions on Power Systems, vol. 19, pp. 1454-1461, 2004. X. Jiang, J. H. Chow, A.-A. Edris, B. Fardanesh, and E. Uzunovic, "Transfer path stability enhancement by voltage-sourced converter-based FACTS controllers," IEEE Transactions on Power Delivery, vol. 25, pp. 1019-1025, 2010. F. M. ALBATSH, "Multirate ripple-free deadbeat control," Islamic Univ. of Gaza, Palestine, 2009. P. Kasinathan, R. Vairamani, and S. Sundramoorthy, "Dynamic performance investigation of dq model with PID controller-based unified power-flow controller," Power Electronics, IET, vol. 6, pp. 843-850, 2013. J. Verveckken, F. Silva, D. Barros, and J. Driesen, "Direct Power Control of Series Converter of Unified Power-Flow Controller With Three-Level Neutral Point Clamped Converter," IEEE Transactions on Power Delivery, vol. 27, pp. 1772-1782, 2012. R. D. Christie, "Power systems test case archive," Electrical Engineering dept., University of Washington, 2000. S. Ahmad, F. M. Albatsh, S. Mekhilef, and H. Mokhlis, "A placement method of fuzzy based unified power flow controller to enhance voltage stability margin," in 16th European Conference on Power Electronics and Applications (EPE'14-ECCE Europe), 2014, pp. 1-10.