Spatial Variability of Measured Soil Properties across Site-Specific Management Zones Reproduced from Soil Science Society of America Journal. Published by Soil Science Society of America. All copyrights reserved.
M. Mzuku, R. Khosla,* R. Reich, D. Inman, F. Smith, and L. MacDonald ABSTRACT
homogeneous yield-limiting factors, for which a single rate of a specific crop input is appropriate (Doerge, 1999). Various techniques of delineating management zones are currently being investigated in different parts of the USA (Fraisse et al., 1999; Fleming et al., 2000; Khosla et al., 2002; Fleming et al., 2004). Site-specific management zones as described by Fleming et al. (2000) and Khosla et al. (2002) were delineated from the variability in color observed in bare soil imagery of conventionally tilled field, farmer’s perception of field topography, and farmer’s knowledge of past production practices. The variability in bare soil reflectance, and that observed by the farmer, is due, in part, to non-uniform distribution of certain soil properties that influence crop productivity. Variability in soil properties is a direct result of the five soil forming factors: climate, organisms, relief, parent material, and time (Jenny, 1941). Of the five soil forming factors, relief (topography) can be most readily assessed. Changes in field topography influence the distribution of soil properties and crop productivity across a field. Multi-fold variations in crop yields within a field have been reported in several studies. Crop yields ranged from 1.0 to 6.7 Mg ha⫺1 in a field in east-central Alberta, Canada (Goddard and Grant, 2001). Low, medium, and high organic matter zones were found to correspond with top, middle, and bottom slope landscape positions (Mulla and Bhatti, 1997). They also reported increasing grain yields with increasing soil organic matter content. Spatial variability in soil physical properties, nutrient levels, and water content has been well documented (Fulton et al., 1996; Chung et al., 2001; Gaston et al., 2001). Chung et al. (2001) found that grain yield, electrical conductivity, Ca, K, Mg, Na, and SiO2 can exhibit significant and large-scale variability within a relatively small area of relatively low topographic relief (i.e., 3 ha). Soil compaction and bulk density have also been documented as varying significantly within single fields (Fulton et al., 1996; Wells et al., 2000). Spatial variability in certain soil parameters can have influence on the spatial distribution of crop productivity potential. Variability in clay and soil organic C was shown to exert influence on the location and density of weeds (Gaston et al., 2001). Inman et al. (2005) reported that fields that have a high degree of spatial variability in soil properties could be better managed using site-specific management zones. Review of the literature indicates that most previous investigations have focused on the study of spatial variability caused by a particular soil property, that is, compaction, texture, soil organic C, etc. (Fulton et al., 1996; Wells et al., 2000; Gaston et al., 2001). Classifying fields into different levels of productivity management zones
The spatial variation of productivity across farm fields can be classified by delineating site-specific management zones. Since productivity is influenced by soil characteristics, the spatial pattern of productivity could be caused by a corresponding variation in certain soil properties. Determining the source of variation in productivity can help achieve more effective site-specific management. The objectives of this study were (i) to characterize the spatial variability of soil physical properties across irrigated corn (Zea Mays L.) production fields and (ii) to determine if soil physical properties could explain the variability in productivity between site-specific management zones. The study was conducted over three study sites in northeastern Colorado. The soil properties measured were bulk density, cone index, surface soil color, organic C, texture, sorptivity, and surface water content. A multiresponse permutation procedure was used to test for significant differences among soil properties between management zones. Box plots of soil physical properties were created for each management zone within each study site to determine if trends in soil physical properties corresponded to the productivity potential of the management zones. Overall, this study showed that soil physical properties exhibited significant spatial variability across production fields. The trends observed for the measured soil physical properties corresponded to the productivity potential of the management zones. Utilizing site-specific management zones could help manage the in-field variability of yieldlimiting soil physical properties.
S
everal studies have documented that soil properties vary across farm fields, causing spatial variability in crop yields (Rockstro¨m et al., 1999; Gaston et al., 2001). Precision farming or site-specific management is aimed at managing soil spatial variability by applying inputs in accordance with the site-specific requirements of a specific soil and crop (Fraisse et al., 1999). Such management practices require quantification of soil spatial variability across the field. One of the recent approaches to quantify soil spatial variability for site-specific management is to divide fields into productivity level management zones (Khosla et al., 2002; Fleming et al., 2000). A management zone is a subregion of a field with M. Mzuku, Lecturer, Dep. of Agricultural Engineering and Landuse Planning, Private Bag 0027, Botswana College of Agriculture, Gaborone, Botswana; R. Khosla, Associate Professor, Dep. of Soil and Crop Sciences, Colorado State Univ., Fort Collins, CO 80523-1170; D. Inman, Research Associate, Dep. of Soil and Crop Sciences, Colorado State Univ., Fort Collins, CO 80523-1170; R. Reich, Professor, Dep. of Forest, Range, and Watershed Stewardship, Colorado State Univ., Fort Collins, CO 80523. F. Smith, Professor, Dep. of Forest, Range, and Watershed Stewardship, Colorado State Univ., Fort Collins, CO 80523; L. MacDonald, Professor, Dep. of Forest, Range, and Watershed Stewardship, Colorado State Univ., Fort Collins, CO 80523. Received 27 Feb. 2005. *Corresponding author (
[email protected]). Published in Soil Sci. Soc. Am. J. 69:1572–1579 (2005). Soil Fertility & Plant Nutrition doi:10.2136/sssaj2005.0062 © Soil Science Society of America 677 S. Segoe Rd., Madison, WI 53711 USA
Abbreviations: DGPS, differentially corrected global positioning system; GIS, geographic information system; GPS, global positioning system.
1572
Reproduced from Soil Science Society of America Journal. Published by Soil Science Society of America. All copyrights reserved.
MZUKU ET AL.: SPATIAL VARIABILITY OF MEASURED SOIL PROPERTIES
is a relatively new concept. Previous studies investigated spatial variability in field properties independent of productivity level management zones. Also, understanding the role of several soil properties together, and their interactions, may help to explain the cause of variation in crop productivity as defined by site-specific management zones. The objectives of this study were (i) to characterize the spatial variability of soil physical properties across irrigated production corn fields and (ii) to determine if the measured soil physical properties could explain the variability between site-specific management zones. MATERIALS AND METHODS This study was conducted in 2001 and 2002 on three fields that were in irrigated continuous corn in northeastern Colorado. Study Site I was furrow irrigated, while study Sites II and III were irrigated using center-pivot sprinkler irrigation systems. Before planting, site-specific management zones were delineated on all fields using the commercially available AgriTrak Professional1 software (Fleming et al., 1999). This program relies on three geographic information system (GIS) data layers: (i) bare soil aerial imagery on conventionally tilled land; (ii) farmer’s perception of field topography; and (iii) farmer’s past crop and soil management experience. These data layers were incorporated into a MapInfo (MapInfo, Troy, NY) GIS database to generate mathematical interpolation surfaces to develop three management zones (Khosla et al., 2002). Traits such as regions of dark color, areas of low-lying topography, and areas of historic high yields as reported by the farmer were designated as a zone of potentially high productivity or high zone. Details of this technique are provided in Fleming et al. (1999), Khosla et al. (2002), Koch et al. (2004), and Inman et al. (2005). Fields ranged from 19 to 35 ha in size (Fig. 1). The high zone accounted for 30, 23, and 35%; while the medium zone was 35, 46, and 41%; and the low zone was 35, 21, and 24 for Sites I, II, and III, respectively (Fig. 1). Study Site I was at an elevation of 1420 m, and had a slope of 0 to 2%. Soils mapped at Site 1 were: Ascalon fine sandy 1 Mention of a trade name neither constitutes endorsement of the equipment or products used nor criticism of similar ones not used or mentioned by the authors or by Colorado State University.
1573
loam (fine-loamy, mixed, superactive, mesic, Ardic Argiustoll), Haverson loam (fine-loamy, mixed, superactive, calcareous, mesic Aridic Ustifluvent), Otero sandy loam (coarse loamy, mixed, superactive, calcareous, mesic Aridic Ustorthent), Nunn clay loam (fine smectitic, mesic, Aridic Argiustoll), and Olney loamy sand (fine loamy, mixed, superactive, meisc Ustic Haplargid) soil series (USDA, 1980). Study Site II was a nearly level (0–2% slope) field at an elevation of 1437 m. Soil mapped were Valentine fine sand (mixed, mesic, Typic Ustipsamment) and Dwyer fine sand (mixed, mesic, Ustic Torripsamment) series (USDA, 1968). Both Valentine soils and Dwyer soils are eolian derived, occur on upland positions, and are excessively well-drained. The Dwyer soil series tends to occur on dunelike features on or near high alluvial terraces. Study Site III was located on a nearly level (0–2% slope) field at an elevation of 1286 m. Site III was mapped as having Albinas loam (fineloamy, mixed, superactive, mesic Pachic Argiustoll), Ascalon fine sandy loam (fine-loamy, mixed, superactive, mesic, Aridic Argiustoll), and Haxton loamy sand (fine-loamy, mixed, superactive, mesic Pachic Argiustoll) soil series (USDA, 1981). These soils are characterized as being very deep, well drained, and have accumulated carbonates in the soil solum. The Ascalon series occurs on upland positions and is formed from calcareous parent material. The Haxtun series consist of eolian deposits that overlay buried soil, occurring in drainages and depressions. The Albinas series is alluvial and occurs on fans and terraces.
Measurements and Soil Analyses Selected soil physical and chemical properties that have been documented in the literature to be directly and indirectly related to productivity potential were measured in this study. Soil samples were collected before planting using a non-aligned systematic grid sampling strategy with a sampling density of 2.5 samples per hectare (Fig. 1). Sample positions were logged using a Trimble Ag 114 differentially corrected GPS unit. Soil samples were collected with a Giddings hydraulic soilsampling probe (Giddings Machine Co., Fort Collins, CO). Surface samples were taken from the top 10 cm of each soil core. Subsurface samples were taken at 30, 60, and 90 cm. Soil samples were oven dried to a constant weight. Bulk density of each sample was determined using the method of Donahue et al. (1983). Soil color was determined for both moist and dry surface samples using a Munsell color chart (Schoeneberger et al., 1998). Organic matter and organic C content was deter-
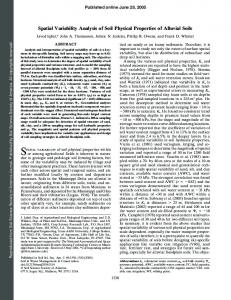
Fig. 1. A, B, and C represents 19-ha study Site I, 35-ha study Site II, and 28-ha study Site III respectively, showing regions of site-specific management zones and georeferenced soil sample locations. [Low soil productivity ⫽ white; Medium soil productivity ⫽ light gray; High soil productivity ⫽ dark gray.] Fields are not to scale.
1574
SOIL SCI. SOC. AM. J., VOL. 69, SEPTEMBER–OCTOBER 2005
Table 1. Sample mean and coefficient of variation (CV) for selected soil properties from study Sites I, II, and III. Soil property
Reproduced from Soil Science Society of America Journal. Published by Soil Science Society of America. All copyrights reserved.
Study site
Statistic
Sand
Silt
Clay
OC‡
b§ (0 cm)
g kg⫺1 I II III
Mean CV† % Mean CV % Mean CV %
550 16 860 5 590 15
210 24 50 40 260 24
b (30 cm) kg m⫺3
240 18 90 37 150 25
9.5 15 5.6 23 8.7 17
1433 13 1703 6 1845 5
1240 11 1431 13 1520 14
† CV ⫽ Coefficient of variation. ‡ OC ⫽ Organic C. § b ⫽ Bulk density: measurements were taken at the soil surface (0 cm) and at the 30-cm depth (30 cm).
mined using methods described by Nelson and Sommers (1996). Soil texture was determined using the hydrometer method (Gee and Bauder, 1986). Cone indices were measured with an electronic cone penetrometer at the following soil depths: 0, 5, 10, 15, and 20 cm. Sorptivity measurements were made in situ at each sample location using the method explained in Smith (1999). Average sorptivity values were adjusted for the initial moisture content to allow comparison among the points (Shaver et al., 2001).
Statistical Analysis Statistical analysis was performed using SPLUS 6.1 (Insightful Corp., 2001) and SAS 8.0 (SAS Institute, 2001). Moran’s I and semi-variogram plots were used to test for spatial autocorrelation in the measured soil properties. Since range of the Moran’s I statistic depends on the spatial weight matrix, Moran’s I statistics were rescaled. When Moran’s I is rescaled by its bounds the statistic is restricted to the range ⫾1 (Upton and Fingleton, 1985). Response surfaces for selected soil properties were created using median-polish kriging. Cressie (1993) introduced the median polish kriging method, which is based on the median polish approach for two-way tables to extract a mean surface from spatial data and then to use ordinary kriging for spatially predicting the residual process. Median polish kriging is described in more detail in Cressie (1993), along with applications to such different types of data such as regular or irregular distributed geostatistical data as well as regional count data. There are two advantages of Median polish kriging over universal kriging: first, the mean component of model is estimated by the outlier resistant method of median polishing, which gives less biased residuals for estimating the structure function, and second, the spatial structure function, that is, the variogram, is not assumed to be known a priori (Cressie, 1993). Multi-response permutation procedure (MRPP) was used to test for significant differences in soil properties between management zones (Mielke, 1991). The MRPP is a median based, distribution free procedure that relies on Euclidean distance functions and it makes use of small samples sizes (Mielke, 1991). Multi-response permutation procedure is distribution free in the sense that probabilities of obtaining extreme test statistic values given the validity of the null hypothesis (Type I errors) are based on permutations of the data from randomization theory and are not based on an assumed population distribution (Edgington, 1987; Good, 2000; Mielke and Iyer, 1982). Box plots were created for soil properties that were significantly different among management zones. Soil colors determined from Munsell color charts were treated as categorical data and were statistically analyzed.
RESULTS AND DISCUSSION Overall Spatial Variability Mean and coefficient of variation for selected soil properties from all study sites are presented in Table 1. Overall, the sites used in this study were high in sand content, with mean sand ranging from 550 to 860 g kg⫺1. Silt was the most variable soil separate, ranging from 50 to 280 g kg⫺1. Mean organic C ranged from 5.6 to 9.5 g kg⫺1, with study Site I having the highest mean organic C content. Average bulk density was highest in study Site III. In general, soil separates exhibited the highest degree of variability as compared with the other measured soil properties. Variability in soil texture is likely one of the major factors in the observed variability in productivity potential at the sites used in this study. This is not surprising because the sites used in this study were mapped, at the 1 to 24 000 scale, with multiple soil series present. Using the management zone technique described herein, we can potentially detect changes in soil properties at a much finer scale than the commonly used 1:24 000 scale employed by the USDA-NRCS. Hence, there is potential for more precise management of farm inputs using site-specific management. Spatial analysis of the soils data using Moran’s I, showed that the three fields had significant spatial variability in soil physical properties (p ⬍ 0.05). Results from Moran’s I (Table 2) along with semi-variogram results (Table 3) indicate that all study sites have soil physical properties that exhibit some degree of positive spatial auto-correlation. Positive spatial auto-correlation indicates that similar attributes (i.e., areas that possess like soil properties) are grouped together spatially. It should be noted, however, that the degree to which spatial correlation is characterized is dependant on the sampling grid size. In this study, the spatial structure of the data was not fully realized because of the relatively coarse grid size (i.e., 2.5 samples per hectare) used while collecting soil samples. Soil properties that were found to exhibit significant spatial dependency were modeled using median polish kriging. Predicted surfaces from the median polish krigging are shown in Fig. 2. Coefficients of determination associated with the trend surface and the krigged surface are also presented in Table 3. Spatially auto-correlated (p ⬍ 0.05) soil properties that were common at all study sites include: organic C, sand, and silt (Tables 2 and 3). These soil properties have a direct
1575
MZUKU ET AL.: SPATIAL VARIABILITY OF MEASURED SOIL PROPERTIES
Reproduced from Soil Science Society of America Journal. Published by Soil Science Society of America. All copyrights reserved.
Table 2. Soil properties for all study sites that were found to exhibit spatial autocorrelation using Moran’s I statistic. All properties listed were significant at P ⬍ 0.05.† Study site I Moisture OC Sand Silt Clay
II 0.07 0.16 0.11 0.12 0.06
III
Soil Property and Moran’s I Moisture 0.48 O.C. O.C. 0.46 Sand Sand 0.59 Silt Silt 0.38 b (0 cm) Clay 0.62 b (30 cm) b (0 cm) 0.06 ⌽ (0 cm) b (30 cm) 0.09 ⌽ (30 cm) ⌽ (0 cm) 0.22
0.10 0.08 0.19 0.22 0.06 0.22 0.06
† OC ⫽ Organic carbon; b ⫽ Bulk density; ⌽ ⫽ Soil porosity.
impact on water holding capacity and nutrient uptake and therefore affect productivity potential.
Variability between Management Zones Soil Compaction At study Sites I and III, surface bulk density was significantly different between low and high management zones, but surface bulk density was not significantly different between the low and medium, and the medium and high productivity zones (Fig. 3a and 3i). These results are consistent with those reported for site-specific management zones by Inman et al. (2005). Westfall et al. (2003) reported that such a finding is not unexpected, because the management zones are intentionally smoothed during the process of delineation to accommodate commercial-scale equipment (Westfall et al., 2003). Trends observed for surface bulk density indicate that there is an inverse relationship between the high and low management zones. This is not surprising because the low zone has higher sand content and therefore higher bulk den-
sity. Al-Ghazal (2002) found surface bulk density could be increased by as much as 0.31 g cm⫺2 with eight passes of a standard tractor. Sites used in this study have been intensively managed, and therefore, these results may indicate that the soils in the low zone are more prone to compaction than those in the medium and high zones. Perhaps this could be attributed to the observed increase in organic C from the low to the high productivity level zone (Fig. 3). Soil organic C helps to form stable aggregates that can result in relatively low bulk density (Lal and Kimble, 2001). For study Site II, surface bulk density was not significantly different between zones (p ⬍ 0.05); however, bulk density taken at 30 cm was found to differ significantly between the low and high zones (Fig. 3). Contrary to the trends observed for surface bulk density for Sites I and III, the highest bulk density measurements taken at 30 cm for Site II were found in the high productivity zone (Fig. 3). Al-Ghazal (2002) found that in sandy soils, bulk density, and infiltration rate have a strong negative relationship (r ⫽ ⫺0.887). For Site II, the low zone has a lower bulk density at 30 cm and therefore a higher infiltration rate. Because the soils at Site II are excessively well-drained (USDA, 1968) any reduction in infiltration rate would likely increase the plant available water in the portion of the soil solum above 30 cm. Cone indices were also measured to determine soil compaction across management zones and were found to be significantly different between zones for study Site III only. Because bulk density was a more reliable measure of soil compaction across sites (i.e., statistically significant across sites and management zones), an indepth discussion of cone index will be excluded. Soil Organic Carbon Soil organic C was significantly different between management zones for all study sites (Fig. 3). This was ex-
Table 3. Variogram parameters (nugget, sill, and range) and the coefficients of determination associated with the trend surface and the final krigged surface for spatially dependant soil properties for each study site (p ⬍ 0.05). Soil property†
Nugget
Sill
Moisture OC§ Sand Silt Clay
0.00 0.00 8.26 1.67 3.11
0.003 0.024 84.20 26.13 20.17
Moisture OC Sand Silt Clay Pb (0 cm) Pb (30 cm) ⌽ (30 cm)
0.00 0.00 2.32 0.06 2.11 0.00 0.00 0.00
0.002 17.38 4.057 9.210 9 754 58 194 0.009
OC Sand Silt Pb (0 cm) Pb (30 cm) ⌽ (0 cm) ⌽ (30 cm)
0.01 0.51 0.02 0.00 74.70 0.00 0.00
0.021 75.59 35.84 11 064 94 826 0.005 0.014
Range Study site I 100 200 123 112 124 Study site II 200 200 165 131 161 75 79 100 Study site III 100 97 107 79 77 200 77
R2 (TS)‡
R2 (KS)§
0.25 0.03 0.07 0.11 0.03
0.98 0.89 0.98 0.99 0.96
0.62 0.51 0.61 0.48 0.59 0.18 0.15 0.15
0.89 0.86 0.95 0.99 0.92 0.99 0.97 0.97
0.09 0.20 0.37 0.10 0.06 0.16 0.06
0.99 0.99 0.99 0.99 0.99 0.71 0.99
† OC ⫽ organic carbon; Pb (0 cm) ⫽ bulk density measured at the soil surface; Pb (30 cm) ⫽ bulk density measured at the 30-cm soil depth; ⌽ (30 cm) ⫽ soil porosity measured at the 30-cm soil depth; ⌽ (0 cm) ⫽ porosity measured at the soil surface. ‡ R2 (TS) ⫽ coefficient of determination associated with the median polish (trend) surface. § R2 (KS) ⫽ coefficient of determination associated with the median polish krigged surface (trend ⫹ krigged).
Reproduced from Soil Science Society of America Journal. Published by Soil Science Society of America. All copyrights reserved.
1576
SOIL SCI. SOC. AM. J., VOL. 69, SEPTEMBER–OCTOBER 2005
Fig. 2. Krigged surfaces for sand, silt, clay, organic C, soil moisture, and bulk density for study Site II. Management zones are superimposed (black lines) over each image to show the relationship of the soil properties to each management zone.
pected because the management zone delineation technique used in this study relies on bare-soil imagery, the tone of which is directly affected by organic C. At study Site I and II, the high and low productivity management zones were significantly different with respect to organic C. Organic C concentration was significantly different among all three zones at study Site III. The differences
observed for organic C between management zones affects the availability of water to the crop. Since the fields used in this study contain soils that are well to excessively well drained, the availability of water is a key factor in nutrient uptake and therefore productivity potential. Box plots show an inverse relationship between sur-
1577
Reproduced from Soil Science Society of America Journal. Published by Soil Science Society of America. All copyrights reserved.
MZUKU ET AL.: SPATIAL VARIABILITY OF MEASURED SOIL PROPERTIES
Fig. 3. Box plots of soil properties that were significantly different among the low, medium, and high management zones at study Site I (A, B, C, and D), Site II (E, F, G, and H), and Site III (I through N). Boxes within plots with same letter are not significantly different at 0.05 probability level.
Reproduced from Soil Science Society of America Journal. Published by Soil Science Society of America. All copyrights reserved.
1578
SOIL SCI. SOC. AM. J., VOL. 69, SEPTEMBER–OCTOBER 2005
face bulk density and organic C content for study Sites I and III (Fig. 3). Higher organic C content likely contributed to increased soil aggregation and therefore increased soil aggregate stability in the high productivity zone. Increased organic C would also raise the CEC of the soil relative to the other management zones and improve the water holding capacity (Lal and Kimble, 2001). Soil Texture Silt content was found to be significantly different between management zones at all study sites (Fig. 3). Again, from Table 1, silt was the most variable soil property measured. Silt content increased from the low to the high zone. Sand content was also found to be significantly different between management zones at study Sites I and III. As expected, sand content increased from the high to the low productivity level zone. At Sites I and II, silt was not significantly different between the high and medium management zones. However, both the medium and high zones were significantly different from the low zone. At study Site III, silt was found to differ significantly between the low and high and between the medium and high zones. Sand was found to differ significantly between the low and high zones, with the low zone having more sand than the high zone. At study Site III, the high zone was found to have significantly more clay than the low productivity zone. The spatial variability observed for soil texture reflects the changes in soil map units. At study Site I for example, soils ranged from coarse loamy entisols to fine-smectic mollisols. Such changes in soil map units will have pronounced affects on productivity potential. The increase in silt content (Fig. 3) from low to high productivity zones, coupled with the increase in organic C, could help explain the differences in productivity potential of the management zones. More organic C, silt and/or clay and less sand, would increase productivity potential because such zones would have higher CEC and better capability to retain moisture and nutrients. Soil texture is likely one of the major contributors to the differences in productivity potential of the management zones. Sorptivity Sorptivity was significantly different among management zones at study Site III. However, the 25th percentile is highest in the medium productivity zone and not in the high productivity zone, as it would be expected because of the textural differences. In addition, sorptivity was significantly different between the low and meTable 4. The average dry and moist surface soil color of the sitespecific management zones for all study sites. Productivity level management zone Study site I Dry Soil Color Moist Soil Color II Dry Soil Color Moist Soil Color III Dry Soil Color Moist Soil Color
Low 10YR 10YR 10YR 10YR 10YR 10YR
5/4 4/3 5/3 4/2 5/3 4/2
Medium 10YR 10YR 10YR 10YR 10YR 10YR
5/4 4/3 5/3 4/2 5/2 4/1
High 10YR 10YR 10YR 10YR 10YR 10YR
5/4 4/3 4/3 3/2 5/2 4/1
dium, but not between the low and high productivity management zones. The low and high productivity zones would be expected to be more separable than the low and medium zones if the trend in sorptivity corresponded to that in the productivity of the zones. Overall, sorptivity values were high and therefore were not a factor affecting productivity potential. The observed difference in productivity as delineated by management zones, therefore, could not be attributed to the spatial variation of sorptivity. Surface Soil Water Content Water content increased significantly from the low to the medium, and also from the medium to high productivity management zone at study Site III (Fig. 3). This trend could be attributed to the corresponding increase in organic C, silt, and clay content at this study site. Mulla and Bhatti (1997) also reported a significant increase in profile available water content from the low to the medium, and from the medium to the high organic matter management zones. Surface Soil Color Both dry and wet surface soil color were significantly different among zones at study Sites II and III (Table 4). At Site II, the average dry and moist soil color was darker (10YR 4/3 and 10YR 3/2, respectively) in the high productivity level zone. Average dry and moist color was the same for both medium and low productivity level zones at the same site. The darker color may be due to more organic matter content (1.1 g kg⫺1) in the high productivity level zone as shown by the organic carbon content in Fig. 3. Value extends from pure black (0) to pure white (10) (Turene, 2002). At Site III, the Munsell chroma of dry and wet colors was different in some management zones, but Munsell value was the same in all zones (Table 4). Chroma was 2 in the high and medium, and 3 in the low productivity level zone, for dry color, and it was 1 in the high and medium, and 2 in the low productivity level zone, for moist color. The higher chroma number in the low productivity level zone only shows the higher strength of “yellow red” (YR) or hue in that zone, but not the relative darkness of the soil. Chroma runs from 0 (neutral gray) to 8, which is the highest strength of spectral color found in soils. Therefore, the soil color is correlated to the variation in productivity among zones.
CONCLUSIONS In this study, soil physical properties were shown to exhibit significant positive spatial auto-correlation across continuous corn irrigated production fields. Surface plots revealed that the spatial variability for the soil properties exhibited salient patterns within the fields. Site-specific management zones were shown to differ significantly with regard to some of the measured soil physical properties. Overall, the low management zone was consistently separable from the high management zone based on bulk density, organic C, sand, silt, poros-
Reproduced from Soil Science Society of America Journal. Published by Soil Science Society of America. All copyrights reserved.
MZUKU ET AL.: SPATIAL VARIABILITY OF MEASURED SOIL PROPERTIES
ity, and soil moisture. Soil properties that were significantly different between management zones ultimately affected the available water and therefore the nutrient uptake within each zone. In general, the trends observed for the soil properties followed the productivity potential of the management zones. An overall goal of precision farming is to manage inherent in-field variability in the most cost-effective and efficient manner. Using site-specific management zones, low productivity potential areas can be reliably separated from the high productivity potential areas thus allowing for differential management of highly variable crop production fields. ACKNOWLEDGMENTS The authors acknowledge and thank the Kellogg Foundation, Academy of Educational Development, USDA-IFAFS, and Agricultural Experiment Station for funding parts of this research project. Our gratitude also goes out to Tim Shaver, Brad Koch, and Andy Hornung for their support of this study.
REFERENCES Al-Ghazal, A.A. 2002. Effect of tractor wheel compaction on bulk density and infiltration rate of a loamy sand soil in Saudi Arabia. Emir. J. Agric. Sci. 14:24–33. Chung, S.O., J.H. Sung, K.A. Sudduth, S.T. Drummond, and B.K. Hyun. 2001. Spatial variability of yield, chlorophyll content, and soil properties in a Korean rice paddy field. In P.C. Robert et al. (ed.) Proc. 5th International Conf. on precision agriculture. [CD-rom] ASA, CSSA, Madison, WI. Cressie, N. 1993. Statistics for spatial data. Revised ed. John Wiley & Sons, New York. Doerge, T.A. 1999. Management zone concepts [Online]. Available at http://www.ppi-far.org/ssmg (verified 14 June 2005). Donahue, R.L., R.W. Miller, and J.C. Shickluna. 1983. Soils: An introduction to soils and plant growth. 5th ed. Prentice Hall Inc., Upper Saddle River, NJ. Edgington, E.S. 1987. Randomization tests. Marcel Dekker, Inc., New York. Fleming, K.L., D.G. Westfall, D.W. Wiens, L.E. Rothe, J.E. Cipra, and D.F. Heermann. 1999. Evaluating farmer developed management zone maps for precision farming. p. 335–343. In P.C. Robert et al. (ed.) Precision agriculture. Proceedings of the 4th Intl. Conf. ASA, CSSA, and SSSA, Madison, WI. Fleming, K.L., D.F. Heermann, and D.G. Westfall. 2004. Evaluating soil color with farmer input and apparent soil electrical conductivity for management zone delineation. Agron. J. 96:1581–1587. Fleming, K.L., D.G. Westfall, D.W. Weins, and M. Brodhall. 2000. Evaluating farmer defined management zone maps for variable rate fertilizer application. Precis. Agric. 2:201–215. Fraisse, C.W., K.A. Sudduth, N.R. Kitchen, and J.J. Fridgen. 1999. Use of unsupervised clustering algorithms for delineating withinfield management zones. ASAE Paper No. 993043. International Meeting, Toronto, Ontario, Canada. July 18–21. Fulton, J.P., L.G. Wells, S.A. Shearer, and R.I. Barnhisel. 1996. Spatial variation of soil physical properties: A precursor to precision tillage. ASAE Paper No. 961002. International Meeting, Phoenix, Arizona. 14–18 July 1996. ASAE, St. Joseph, MI. Gaston, L.A., M.A. Locke, R.M. Zablotowicz, and K.N. Reddy. 2001. Spatial variability of soil properties and weed populations in the Mississippi delta. Soil Sci. Soc. Am. J. 65:449–459. Gee, G.W., and J.W. Bauder. 1986. Particle size analysis. p. 404–408. In A. Klute (ed.) Methods of soil analysis. Part I. 2nd ed. Agron. Monogr. No. 9. ASA and SSSA, Madison, WI. Goddard, T., and R. Grant. 2001. Landscape management of agro-
1579
nomic processes for site-specific farming [Online]. Available at http:// www.ppi-ppic.org/far/farguide.nsf/$webindex/article⫽860FC176852 56A1000521799506AEE1C!opendocument (verified 13 June 2005). Good, P. 2000. Permutation tests: A practical guide to resampling methods for testing hypotheses. 2nd ed. Springer, New York. Inman, D.J., R. Khosla, and D.G. Westfall. 2005. Nitrogen uptake across site-specific management zones in irrigated corn production systems. Agron. J. 97. 169–176. Insightful Corporation. 2001. S-Plus 6.1. Insightful Corp., Seattle, WA. Jenny, H. 1941. Factors of soil formation. McGraw-Hill. New York. Khosla, R., K. Fleming, J.A. Delgado, T. Shaver, and D.G. Westfall. 2002. Use of site-specific management zones to improve nitrogen management for precision agriculture. J. Soil Water Conserv. 57: 513–518. Koch, B., R. Khosla, M. Frasier, D.G. Westfall, and D. Inman. 2004. Economic feasibility of variable rate nitrogen application utilizing site-specific management zones. Agron. J. 96:1572–1580. Lal, R., and J.M. Kimble. 2001. Importance of soil bulk density and methods of its measurement. p. 31–44. In R. Lal et al. (ed.) Assessment methods for soil carbon. Lewis Publishers, Boca Raton, FL. Mielke, P.W. and H.K. Iyer. 1982. Permutation techniques for analyzing multi-response data from randomized block experiments. Commun. Statist. Theory Meth. 11:1427- 1437. Mielke, P.W., Jr. 1991. The application of multivariate permutation methods based on distance functions in the earth sciences. EarthSci. Rev. 31:55–71. Mulla, D.J., and A.U. Bhatti. 1997. An evaluation of indicator properties affecting spatial patterns in N and P requirements for winter wheat yield. p. 145–153. In J.V. Stafford (ed.) Precision agriculture. Vol. 1: Spatial Variability in Soil and Crop. BIOS Scientific Publishers Limited. Nelson, D.W., and L.E. Sommers. 1996. Total carbon, organic carbon, and organic matter. p. 961–1010. In Methods of soil analysis. Part 3. D.L. Sparks (ed.) SSSA Book Series No. 5. SSSA, ASA, Madison, WI Rockstro¨m, J., J. Barron, J. Brouwer, S. Galle, and A. de Rouw. 1999. On-farm spatial and temporal variability of soil and water in pearl millet cultivation. Soil Sci. Soc. Am. J. 63:1308–1319. SAS Institute. 2001. Statistical analysis software. Ver. 8. SAS Institute, Cary, NC. Schoeneberger, P.J., D.A. Wysocki, E.C. Benham, and W.D. Broderson. 1998. Field book for describing and sampling soils. NRCS, USDA, National Soil Survey Center, Lincoln, NE. Shaver, T.M., G.A. Peterson, L.R. Ahuja, D.G. Westfall, L.A. Sherrod, and G. Dunn. 2001. Surface soil physical properties after 12 years of dryland no-till management. Soil Sci. Soc. Am. J. 66:1296– 1306. Smith, R.E. 1999. Technical note: Rapid measurement of soil sorptivity. Soil Sci. Soc. Am. J. 63:55–57. Turene, J. 2002. Soil color: A powerpoint presentation. Available online at http://nesoil.com/properties/color (verified 10 June 2005). Upton, G.J.G., and B. Fingleton. 1985. Spatial data analysis by example: Vol. 1. Point pattern and quantification data. John Wiley & Sons, New York. USDA. 1968. Soil survey of Morgan County, Colorado. USDA-SCS, Colorado Agricultural Experiment Station, Fort Collins, CO. USDA. 1980. Soil Survey of Weld County, Colorado, Southern Part. USDA-SCS, Colorado Agricultural Experiment Station, Fort Collins, CO USDA. 1981. Soil Survey of Yuma County, Colorado. USDA-SCS, Colorado Agricultural Experiment Station, Fort Collins, CO. Wells, L.G., S.A. Shearer, J.P. Fulton, and L.W. Murdock. 2000. Assessment of remote sensing for implementation of precision tillage. ASAE Paper No. 001084. International Meeting, Milwaukee, WI. 9–12 July 2000. ASAE, St. Joseph, MI. Westfall, D.G., W.J. Gangloff, R. Khosla, R.M. Reich, A. Hornung, D.F. Heermann, H.J. Farahani, and K. Fleming. 2003. Development of production level management zones for nitrogen fertilization. p. 141–142. In A. Werner and A. Jarfe (ed.) Program book of the joint conference of ECPA-ECPLF. Wageningen Academic Publishers, The Netherlands.