result in different state machines, we believe it is significant to emphasize and represent .... ATM machine, where the user performs operations like inserting or ...
Synthesis of State Machines from Multiple Interrelated Scenarios Using Dependency Diagrams Simona VASILACHE Department of Computer Science, University of Tsukuba Tsukuba, Ibaraki 305-8573, Japan and Jiro TANAKA Department of Computer Science, University of Tsukuba Tsukuba, Ibaraki 305-8573, Japan
ABSTRACT Requirements specification is one of the most important phases in developing a software application. In defining the behavior of a system, requirements specifications make use of a number of scenarios that are interrelated in many ways. Most of the current approaches, even though giving directions on how to translate them into state machines, treat each scenario separately. Because different relationships between scenarios result in different state machines, we believe it is significant to emphasize and represent these relationships. In order to illustrate them we propose a new type of diagrams named dependency diagrams. We offer a set of rules and steps for the synthesis of state machines from multiple inter-related scenarios, based on the initial scenarios and on the newly introduced dependency diagrams, as a means to describe the requirements specifications and to offer support during the design and implementation phases of developing a system. Keywords: requirements specification, dynamic modeling, scenarios, state machines.
1. INTRODUCTION Requirements analysis represents a crucial phase in the software development process. The main task of the requirements analysis is to generate specifications that describe the behavior of a system unambiguously, consistently and completely [1]. Several object-oriented methodologies and notations (like OMT [2], UML [23]) make use of scenarios as a means of capturing requirements specifications, as well as a means of communication between users and software developers. A scenario is a sequence of events that occurs during one particular execution of a system [1], it is one particular “story” of using a system. During the recent years, scenarios have gained considerable popularity. However, we believe that they have not yet received the attention they actually deserve and they have not been used up to their entire potential. Their usefulness lies not only in the ability to capture requirements, but also in their applicability when used in conjunction with other models. We specifically refer to what is called "behavior models", that is models that describe the behavior of a system. State machines (particularly statecharts, originally introduced by D. Harel [3]), represent a compact and elegant way of describing the aspects concerning the behavior of a system.
18
They can be used not only for behavioral requirements specifications, but also for detailed design models close to implementation [4]. While scenarios represent a single trace of behavior of a complete set of objects, state machines represent the complete behavior of a single object. Together, they provide an orthogonal view of a system. By transforming scenarios into state machines, we can take advantage of the benefits offered by both of these concepts. Scenarios are generally not independent of each other; various relationships and dependencies connect them. We make a classification of these relationships and in order to represent them we propose a new type of diagrams. We call these diagrams dependency diagrams. Based on these dependency diagrams and on the given scenarios, we give rules and steps of synthesis of state machines from multiple interrelated scenarios. We will describe in this paper the newly introduced diagrams and our method of synthesis. The remainder of the paper is organized as follows: section 2 offers an overview of scenarios and state machines. In section 3 we make a classification of the relationships that can exist between various scenarios and we describe the dependency diagrams. Section 4 illustrates the synthesis of state machines from multiple scenarios. Section 5 discusses several issues, while section 6 deals with related work and is followed by conclusions in section 7.
2. SEQUENCE DIAGRAMS AND STATE MACHINE DIAGRAMS Scenarios as sequence diagrams In UML, scenarios are represented as sequence diagrams. Sequence diagrams illustrate how objects interact with each other. They focus on showing the sequence of messages sent between objects, that is the interaction between objects from a temporal point of view. Sequence diagrams have two axes: the vertical axis shows time and the horizontal axis shows a set of objects. An object is represented by a rectangle and a vertical bar called the object's lifeline. Objects communicate by exchanging messages, represented by horizontal arrows drawn from the message sender to the message recipient. The message sending order in a sequence diagram is indicated by the position of the message on the vertical axis.
SYSTEMICS, CYBERNETICS AND INFORMATICS
VOLUME 3 - NUMBER 3
State machine diagrams State machine diagrams represent state machines from the perspective of states and transitions. The representation used in UML’s state diagrams is inspired from Harel's statecharts [3]. State diagrams describe what states an object can have during its life cycle and the behavior in those states, along with what events cause the states to change. All objects have a state; the state is a result of previous activities performed by the object. An object changes state when something happens, which is called an event. State diagrams may have a starting point and several end points. A state is represented as a rounded rectangle; between states there are state transitions, shown as a line with an arrow from one state to another. The state transitions may be labeled with the event causing the state transition. When the event happens, the transition from one state to another is performed (the transition is "triggered"). This means that the system leaves its current state, initiates the actions specified for the transition and enters a new state. A state transition normally has an event attached to it, but not necessarily. If an event is attached to a state transition, the transition will be performed when the event occurs. If a state transition does not have an event specified, the attached state will change when the internal actions in the source state are executed. Therefore, when all the actions in a state are performed, a transition without an event will automatically be triggered. State machine diagrams have proved their usefulness in the dynamic description of the behavior of a system. Moreover, they can be used for generating code directly from them, since each of them describes the complete behavior of one object.
3. RELATIONSHIPS BETWEEN SCENARIOS; DEPENDENCY DIAGRAMS Classification of relationships Since a scenario represents a particular “story” of the execution of a system, in order to describe a system completely, we need to know all the possible scenarios. Depending on the application, the number of scenarios varies; however small the number of all possible scenarios is, relationships, dependencies exist between them. Sometimes, one scenario follows another scenario or is conditioned by another one. Many times the order and the timing of their execution are not arbitrary. To illustrate our point, let us consider a simplified example of an ATM (Automated Teller Machine). A consortium of banks shares the ATMs. Each ATM accepts a cash card, interacts with the user, communicates with the central system to carry out the transaction, dispenses cash and prints receipts. We will use (simplified) typical scenarios for user interaction with an ATM machine, where the user performs operations like inserting or removing a card, entering a password, deciding upon a certain type of transaction (withdrawal, deposit or transfer) and so on. For example, if we consider the scenario depicting the action of withdrawing cash, this can be executed only in the situation of the user possessing a valid card. The scenario of the user applying for a card with a bank must precede the scenarios involving transactions with the bank in the user’s name. Therefore we consider that, in order to be able to understand and describe the whole system, we need to take into account not only the scenarios themselves, but also the interrelations between them. Based on [11], we make a classification of the relationships and dependencies between scenarios as follows:
- time dependencies; - cause-effect dependencies; - generalization dependencies. A time dependency signifies the fact that one scenario has to be executed at an earlier/later moment in time than another scenario. Only after the scenario that has to be executed first has finished its transitions, the second one can start its execution. It can also mean that two (or more) scenarios must be executed at the same time. For instance, as described above, a user must first prepare a card and only then (s)he can perform transactions through the ATM. Therefore, the scenario of creating a card precedes the scenario of withdrawing cash and the two scenarios are in a time dependency. A cause-effect dependency reflects the fact that the execution of a scenario can take place only the moment certain conditions (established in another scenario) become valid. For example, an ATM can satisfy the user’s request for withdrawing cash only if it has been previously provided with a number of bills/coins. The scenario of withdrawing cash depends on the scenario of the ATM machine being ”loaded” with a sufficient amount of cash (considered to cover the maximum amount that could be withdrawn during a whole day). The condition “being able to provide enough cash” is established in a different scenario from the one where the transaction itself takes place. A generalization dependency emerges when one scenario is a constituent part of another one or a variant of it. As a rough example, we can consider that the scenario of withdrawing cash is very similar to the scenario of depositing money. They can be generalized under one scenario, ”cash operations”, for example, where we have 2 variants with slight differences between them (in the case of deposit: the user selects ”deposit” and inserts the money in the special slot in the ATM; in the case of withdrawal: the user selects ”withdrawal” and the money is ejected through the same slot). One could argue that time dependencies and cause-effect dependencies are equivalent, but we believe that it is important to emphasize when the dependency arises from a specific time sequence (like having to insert the card and password first, and only after that being able to perform a transaction) and when a dependency arises from certain conditions that are not explicitly time-related (at least, not necessarily). As we described above, a user could withdraw cash only if the ATM has been provided with bills and coins. In this case, we believe it is not so important to emphasize the time sequence (supplying bills first and then being able to satisfy the user’s request for cash), as it is important to emphasize that having the bills is a necessary condition, which if it is not met, the operation cannot take place. When we deal with time (as well as cause-effect) interdependent scenarios, the execution order of the scenarios defines, in most cases, these dependencies. The execution order of a number of scenarios falls into one of the following categories: succession (one scenario follows another one); disjunction (at a certain moment in time either one of the scenarios is executed); conjunction (the scenarios are executed simultaneously); recurrence (a scenario is executed a certain number of times). Introducing dependency diagrams When trying to synthesize state machines from scenarios, different relationships between scenarios result in different
SYSTEMICS, CYBERNETICS AND INFORMATICS
VOLUME 3 - NUMBER 3
19
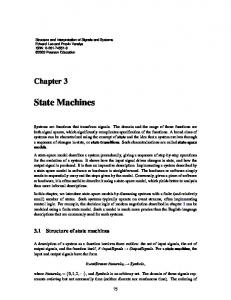
state machine structures. It is because of this that we need to represent exactly how the given scenarios are related to each other. In order to be able to represent and make use of these relationships, we introduce a new kind of diagrams, named dependency diagrams. The notation used in these diagrams is based on the notation used in Message Sequence Charts [5]. One scenario is represented as a rounded rectangle, with connectors for start point and end point (corresponding to entry and exit points). The positioning in space of different scenarios shows the order of execution. The basic notation used in our dependency diagrams has been described in [14]. A simple example of a dependency diagram is shown in Fig.1. It is based on the same example of ATM, where we consider Scenario start the initial scenario (where the user approaches the ATM, inserts the card, the card is validated and the main options screen is displayed). From this point, the user can select any of the three operations of withdrawing cash, depositing cash or transferring cash, meaning that (s)he can select either Sc. withdraw or Sc. deposit or Sc. transfer. We also suppose that when the user changes his(her) password (Sc. chg. pass.), the scenario Sc. videotape takes place simultaneously (that is, the user is videotaped during the operation of changing the password). Fig.1 illustrates three alternative scenarios (any of them can be executed after Scenario start), as well as the concurrency of two scenarios, Scenario chg. pass. and Scenario videotape. Several constraints must be kept in mind when representing the dependency diagrams. Some of them are mentioned in the following. The dependency diagram must have a single start point (but can have several end points). The return of a loop can only be linked to a connection node. The end of synchronization point forces the flow of control to wait until the end of each of the concurrent scenarios before continuing. One block containing these concurrent scenarios is considered as one entity, so no derivation and loops are possible before the resynchronization point.
By introducing dependency diagrams, we can ensure that the requirements of the system are completely described; by knowing the dependencies that exist between scenarios, we can create state machines that show the complete behavior of objects, according to the requirements specification information contained in the scenarios. Furthermore, by representing the relationships between various scenarios, we can easily tell what other scenarios would be affected if one scenario were changed. This contributes considerably to the enhancement of traceability. Also, we beneficiate of an improved readability; by seeing how the different scenarios are related to each other, we can have a better overview of the requirements of the system. Last, but not least, by carefully representing all the possible relationships, we can easily generate a multitude of test cases.
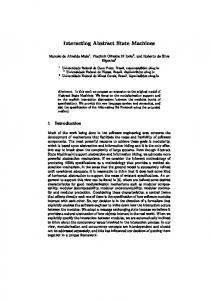
4. SYNTHESIS OF STATE MACHINES FROM MULTIPLE SCENARIOS In a scenario, more exactly in its representation as a sequence diagram, there are a number of messages exchanged between objects. Each such message is a tuple (Mijk, N, W), where: - Mijk depicts a message originating in object i and going to object j; there can be more messages exchanged between the same objects, so k is used to denote these different messages; - N is the name attached to the message; - W is the type of message, and it can have one of the following values: 0, 1 or 2 (corresponding to a simple message, a synchronous message and an asynchronous message respectively). Therefore a scenario will be a matrix of tuples including all the messages exchanged between all objects part of that scenario. For example, if we consider the ATM system, let us assume a scenario (represented in Fig.2) where 4 objects are involved: User, ATM, Consortium and Bank. (We will consider these objects as O1, O2, O3 and O4.) The messages exchanged in our example are: displaying the main screen (from the ATM to the user), inserting a card (from the user to the ATM), requesting the password (from the ATM to the user), entering the password (from the user to the ATM), and so on. In this scenario, after the user enters the card and then the password, the ATM verifies the card with the consortium, which, in turn, verifies it with the bank. The bank sends a bad bank account event to the consortium, and the consortium sends a bad account event to the ATM. The ATM, in turn, sends a bad account message event to the user. In the end, a receipt is issued, the card is ejected and the user is requested to take the card back. Our scenario S1 will therefore have the following matrix:
S1 = Fig. 1 Dependency diagram for several scenarios of an ATM system
20
SYSTEMICS, CYBERNETICS AND INFORMATICS
M211, Display_main_screen, 1 M121, Insert_card, 1 M212, Request_password, 1 M122, Enter_password, 1 M231, Verify_account, 1 M341, Verify_card_with_bank, 1 M431, Bad_bank_account, 1 M321, Bad_account, 1 M213, Bad_account_message, 1 M214, Print_receipt, 1 M215, Eject_card, 1 M216, Request_take_card, 1 M123, Take_card, 1 M217, Display_main_screen, 1
VOLUME 3 - NUMBER 3
for a class of objects, we have to consider the vertical line that corresponds to the objects of that class. Based on [6], we can define the basic rules for generating state machines from single scenarios: z For an object in a sequence diagram, incoming arrows represent events received by the object and they become transitions. Outgoing arrows are actions and they become actions of the transitions leading to the states. The intervals between events become states. Before receiving any event, the object is in the default state.
Fig. 2 Sequence diagram (scenario) of an ATM system
There are 4 objects involved in this scenario; from this scenario only, we can obtain 4 state machine diagrams, one for each object.
The number of initial state machines for an object Oi will be equal to the number of scenarios in which the object Oi is involved. Sequentially, the steps of creating initial state machines are the following: 1. create empty state machine diagrams, one for each scenario where the object appears; 2. for each state diagram, create all events (corresponding to transitions to the object); 3. for all transitions from the object, create actions that will lead to states and create the respective states; 4. set the right time sequence for the transitions.
In a complete description of this system, there are N scenarios, with a total number of P objects. We will have N matrices including all the transitions between objects. The total number of state machine diagrams will be equal to the number of objects in all scenarios. We will therefore have a number of P state machine diagrams. Algorithm of synthesis In order to synthesize the state machine diagrams for all objects, our methodology proposes the following phases: identify and represent (as sequence diagrams) all single scenarios; identify and represent (as dependency diagrams) the relationships between all scenarios; synthesize the state machines diagrams, based on the information acquired in the previous two phases. The synthesis of the state machine diagrams involves two steps, for each object in the system: 1. creating one initial state machine diagram for each scenario where the object appears; 2. synthesizing the final state machine diagram from all the initial state machine diagrams, based on the information in the dependency diagrams. Creation of initial state machines The creation of the initial state machines represents the basis for the synthesis of the final state machine. In the following, we are going to describe briefly how to obtain these state machines. State machines are the ones that relate events and states. When an event is received, the next state depends on the current state as well as the event. A change of state caused by an event is called a transition. When a transition is triggered, the system leaves its current state, initiates the actions specified for the transition and enters a new state. A state machine diagram is a graph whose nodes are states and whose directed arcs are transitions (labeled by event names). One state machine diagram describes the behavior of a single class of objects. The sequence of events in a sequence diagram corresponds to paths through the state machine diagrams of the corresponding objects [6]. In order to construct a state machine
Fig.3. State machine diagram for object ATM
Specifically, step 1 creates a state machine diagram for every distinct scenario involving our object. Considering that we focus on the object ATM and since in our example we presented only one scenario, the one in Fig.1, step 1 will create only one empty state machine diagram. (After obtaining the final state machine diagram for ATM, we proceed in the same manner for the other objects, User, Consortium and Bank). Step 2 creates all events corresponding to transitions to the object. In our example, it creates Insert card, Enter password, Bad account, and Take card.
SYSTEMICS, CYBERNETICS AND INFORMATICS
VOLUME 3 - NUMBER 3
21
In step 3 the actions that lead to states are created, that is Display main screen, Request password, Verify account, Bad account msg., Print receipt, Eject card and Request take card. States with the same names are created at this moment as well. During this step the default state has to be specified; in our case, it is Display main screen. At this point, the transitions are not set into the right time sequence. This is the task of step 4, where - for all transitions the source and the destination are identified, so all transitions will be associated a starting point and an end point. Fig.3 illustrates the state machine diagram corresponding to the ATM object in the scenario given as example in Fig.2. (The default state must be set; in this case, it is Display main screen.)
While scenario Scenario_start precedes the other three scenarios, Scenario_withdraw, Scenario_deposit and Scenario_transfer, these are related by disjunction (only one of them can take place at a certain time). The dependency diagram showing the relationships existing between these 4 scenarios appears in Fig.6.
Synthesis of final state machines In order to obtain the final state machines, we need to combine all the initial state machines, making use of the information in the dependency diagrams. As described before, the dependency diagrams show the possible relationships existing between scenarios. Based on the classification of relationships between scenarios, there are several rules that need to be followed: z In a succession of two scenarios, the resulting state machine diagram merges the two basic corresponding state machine diagrams. z If a transition is common to 2 scenarios, it will be taken only once in the final state machine. z For two scenarios related with a disjunction relationship, their corresponding state machines should be combined with OR. z If two scenarios are executed at the same time, their corresponding state machines must be combined with AND. z In the final phase, the state machine diagrams should be refined, with respect to aggregation of states and generalization of states. To illustrate our point, let us consider three scenarios of using the ATM: one for withdrawing cash, one for depositing cash and one for transferring money (Scenario_withdraw, Scenario_deposit and Scenario_transfer). They are all preceded by a common scenario, that is the scenario where the user inserts the card and password and they are validated by the bank (Scenario_start). The preceding common scenario appears in Fig. 4, while the other three scenarios appear in Fig.5.
Fig.5. Scenarios Scenario_withdraw, Scenario_deposit and Scenario_transfer for ATM system
Fig.6. Dependency diagram for ATM system Fig.4. Scenario Scenario_start for ATM system
22
SYSTEMICS, CYBERNETICS AND INFORMATICS
VOLUME 3 - NUMBER 3
We want to obtain the state machine corresponding to object ATM. This object appears in all 4 scenarios; we will therefore have 4 initial state machines for it, depicted in Fig.7.
Fig.8. State machine diagram for object ATM
Fig.7. Initial state machines for object ATM, each corresponding to one scenario
Based on the given scenarios and on the dependency diagram above, illustrating the relationships between them, we will obtain the state machine diagram in Fig.8. Summarizing, if we have a total number N of scenarios, with a total number P of objects, for each of these objects, the number of initial state machines will be less than or equal to N (since each object does not necessarily appear in all scenarios). After the synthesis of the final state machines, one such state machine will exist for each object. Therefore, there will be a total number P of final state machines.
5. DISCUSSION Refining the final state machines A synthesized final state machine contains all the information regarding the behavior of the object considered. However, it can be refined with the purpose of obtaining a more compact and/or readable state machine. A complete state machine does not have to be extremely complex. At any level, details can be omitted and can be modeled in separate lower level diagrams. The concept of state hierarchy is very useful and can be used to decrease the number of transitions in a state machine diagram. Hierarchy involves the existence of a superstate – a transition from and to a superstate is inherited by each of its substates. In case several states have the same transition, a superstate having the respective transition can be introduced. The above states will become substates of this superstate and the common transition will be removed from these substates.
SYSTEMICS, CYBERNETICS AND INFORMATICS
VOLUME 3 - NUMBER 3
23
Introducing pseudostates can also help in obtaining a more readable state machine. According to their definition, junction pseudostates allow the merging or splitting of multiple transitions. One junction can have one or more incoming transitions and one or more outgoing transitions. Depending on a condition, a transition can be split into multiple outgoing transitions; a conditional branch is realized this way. Using such pseudostates can help in offering a better overview of the behaviour of the state machine. (This represents what is called a “static” conditional branch, as opposed to a “dynamic” conditional branch, which appears in the case of a choice pseudostate). Furthermore, several states can be combined into a single one, in case there are no events triggered in between them, and therefore no possibility of altering the succession of these states. In the case of our ATM example in section 4, in the state machine in Fig. 7, we notice that the states Eject card and Request take card/cash can be merged into a single one, since there are no events in between these states. (We will name this state Eject card & Request take card/cash.) Also, we notice that the states Eject card, Request take card/cash, Display main screen, as well as the transition labeled Take cash/card, are common in the three branches corresponding to the three alternative scenarios. We are therefore going to include them only once in our final state machine. Also, we notice that Take cash/card takes us back to the initial state Display main screen. All these observations considered, we obtain a refined state machine as the one in Fig.9.
Scenario overlapping The steps and rules above apply to disjoint scenarios only, because the states of the component scenarios must be disjoint for proper composition. However, it is possible that some scenarios overlap. Most of the times, this happens when the scenarios describe variants of the same portion of the process. The overlapping must be treated before the composition. There are two choices for this: the scenarios that overlap can be decomposed into mutually disjoint scenarios (subscenarios) or they can be merged into a single, more complex scenario. We consider the first option more appropriate, since it allows an easier synthesis of the state machines. Consistency between scenarios and state machines The process of synthesis does not end with applying the algorithm and the rules defined. Before we can say that we obtained a correct and complete final state machine diagram for each object, we need to address the issue of consistency between the state machines and the scenarios. We have to make sure that the behavior of the final state machine diagrams reflects the information contained in the scenarios, so that we respect the requirements specifications. There are several issues that we need to consider, like the detection of implied scenarios, the external messages exchanged between different scenarios, and the possible conflicts that might arise. Only after solving these problems the process of synthesis can reach its end. Using the synthesized state machines The synthesized state machines can be used during the design and the implementation phases. They offer a dynamic view of the system, while a static view can be found in the class diagram of the system. Attached to this class diagram, the state machine diagrams can express the design model of the system and can facilitate the code generation. Several tools and research papers (like [21] and [22]) deal with generating code from state machine diagrams.
6. RELATED WORK
Fig.9. Refined state machine diagram for object ATM
24
Several papers deal with the transformation of scenario type models into behavior models. SCED [8] is a tool for automatic generation of statecharts from single scenarios. In [9], an algorithm for generating UML statecharts from sequence diagrams is given, but the relationships between the sequence diagrams (as representations of scenarios) are limited to the introduction of hierarchy. Schonberger et. al [10] describe an algorithm for model transformation, more precisely an algorithm for transforming collaboration diagrams into state diagrams. Collaboration diagrams describe the interaction among objects, with the focus on space. This means that the links among objects in space are of particular interest and explicitly shown in the diagram. Sequence diagrams (as representation of scenarios) on the other hand, although they also describe how objects interact and communicate with each other, focus on time. Although the two kinds of diagrams are similar, we believe that sequence diagrams are more suited for use in the analysis phase, as they allow an easier representation of the requirements (when we think of scenarios in the usage of a system, it seems more natural and it requires less effort to focus on the time flow in the development of events). Ryser and Glinz introduced in [11] a new kind of chart, dependency chart, and a new notation to model the dependencies between scenarios. However, the charts only
SYSTEMICS, CYBERNETICS AND INFORMATICS
VOLUME 3 - NUMBER 3
show the dependencies between various scenarios, without giving directions about the way they could be used for translation into state machine diagrams. Actually, we can observe that most work in progress related to object-oriented software development produces models that are only loosely coupled. Most methods describe how to specify models, yet do not sufficiently guide the developer in the task of transforming one model type into another.
7. CONCLUSIONS We describe a method of synthesizing state machine diagrams from multiple scenarios, with regard to the relationships between them. We introduce dependency diagrams for showing all the relationships between scenarios. We offer steps and rules for the synthesis of state machines from multiple interrelated scenarios, based on the initial scenarios and on the newly introduced dependency diagrams. Our approach offers complete requirements specifications, an accurate design, and helps during the implementation.
8. REFERENCES [1] P. Hsia, J. Samuel, J. Gao, D. Kung, Y. Toyoshima, C. Chen, “Formal approach to scenario analysis”, IEEE Software, 11(2), 1994, pp. 33-41. [2] J. Rumbaugh, M. Blaha, W. Premerlani, F. Eddy, W. Lorensen, Object-oriented modeling and design, Prentice Hall, 1991. [3] D. Harel, “Statecharts: A visual formalism for complex systems”, Science of Computer Programming, 8(3), 1987, pp. 231-274. [4] M. Mutz, M. Huhn, “Automated Statechart Analysis for User-defined Design Rules”, Informatik-Bericht Nr. 200310, 2003. [5] L. Helouet, C. Jard, “La manipulation formelle de scenarios”, Modelisation des systemes reactifs, Vol. 0, 2001. [6] J. Ali and J. Tanaka, “Constructing statecharts from event trace diagrams”, Technical report of IEICE, KBSE98-33, 1998, pp. 41-47. [7] J. Ali and J. Tanaka, “Implementing the dynamic behaviour represented as multiple state diagrams and activity diagrams”, Journal of Computer Science and Information Management (JCSIM), 2(1), 2001, pp. 2234. [8] K. Koskimies, T. Mannisto, T. Systa, J. Tuomi, “Automatic support for dynamic modeling of object-oriented software”, IEEE Software, 15(1), 1998, pp. 87-94.
[9] J. Whittle and J. Schumann, “Generating statechart designs from scenarios”, Proceedings of International Conference on Software Engineering (ICSE2000), Limerick, Ireland, 2000, pp. 314-323. [10] S. Schonberger, R. K. Keller, I. Khriss, “Algorithmic support for model transformation in object-oriented software development”, Concurrency and Computation: Practice and Experience, 13(5), 2001, pp. 351-383. [11] J. Ryser, and M. Glinz, “Using dependency charts to improve scenario-based testing”, Proceedings of the 17th International Conference on Testing Computer Software (TCS2000), Washington D.C., 2000. [12] J. C. S. P. Leite, G. D. S. Hadad, J. H. Doorn, G. N. Kaplan, “A scenario construction process”, Requirements Engineering, 5, 2000, pp. 38-61. [13] S. Vasilache and J. Tanaka, “Synthesizing statecharts from multiple interrelated scenarios”, Proceedings of the International Symposium for Future Software Technology ISFST2001, ZhengZhou, China, 2001, pp. 158-163. [14] S. Vasilache and J. Tanaka, “Using dependency diagrams in dynamic modelling of object-oriented systems”, Proceedings of the 7th IASTED Conference on Software Engineering and Applications SEA2003, Marina del Rey, USA, 2003, pp. 277-283. [15] H. Muccini, “An approach for detecting implied scenarios”, Scenarios and state machines: models, algorithms, and tools, ICSE2002 Workshop, Orlando, Florida, USA, 2002. [16] M. Glinz, “Improving the quality of requirements with scenarios”, Proceedings of the 2nd World Congress on Software Quality, Yokohama, 2000; pp. 55-60. [17] I. Jacobson, Object-oriented software engineering: A use case driven approach, Addison Wesley, Reading, Massachusetts, 1992. [18] R. J.A. Buhr, R. S. Casselman, Use case maps for objectoriented systems, Prentice Hall, 1996. [19] F. Bordeleau, J. P. Corriveau, “On the need for "state machine implementation" design patterns”, Scenarios and state machines: models, algorithms, and tools, ICSE2002 Workshop, Orlando, Florida, USA, 2002. [20] Craig Larman, Applying UML and patterns, Prentice Hall, 2002. [21] A. Knapp and S. Merz, “Model Checking and Code Generation for UML State Machines and Collaborations”, in Proc. 5th Workshop on Tools for System Design and Verification, Reisenburg, Germany, 2002, pp. 59-64. [22] I. A. Niaz and J. Tanaka, "Mapping UML Statecharts to Java Code", Proceedings of the IASTED International Conference on Software Engineering (ICSE 2004), Innsbruck, Austria, February 17-19, 2004, pp. 111-116. [23] UML Resource Page, http://www.uml.org/. [24] Object Management Group, http://www.omg.org/
SYSTEMICS, CYBERNETICS AND INFORMATICS
VOLUME 3 - NUMBER 3
25


![[DOWNLOAD] Read Synthesis of Finite State Machines ... - Google Sites](https://m.moam.info/img/260x300/download-read-synthesis-of-finite-state-machines-g_647777b0097c474d228c12f9.jpg)